


If you’re as overwhelmed by statistics as I am sometimes, you’re probably pretty used to browsing a player’s FanGraphs or Baseball Savant page and having no idea what 80% of the things you’re looking at really mean. The formula for wRC+ looks like something only Matt Damon could solve in the middle of one of his janitorial shifts. There are more interpretations of the proper way to calculate WAR than there are opinions on where to get the best slice of pizza in New York City (it’s at Juliana’s, by the way). And that’s not even mentioning the litany of new statistics that have popped up over the years like Meatball Swing%, BIZ, and pLI. Sometimes it makes me wonder if I have a variant of dyslexia that applies only to statistics. Maybe it’s just called being dumb.
A series of stats that I’ve been particularly curious about over the past few months are all of the non-Barreled batted ball types shown on Baseball Savant. These include Solid%, Flare/Burner%, Topped%, Under%, and Weak%. What makes these stats so mystifying is that, unlike Barrels or Hard-Hit rate, they’re not quite as easy to define. And, furthermore, there isn’t a common understanding of what they really mean in the context of player analysis.
Breaking Down Non-Barrels
Barrels are great. I love Barrels. I roll like them in Star Fox. I eat at Barrels of the Cracker variety. The podcast I host is named after them. I’m a big fan of Barrels. And the reason I like them so much, at least in terms of fantasy analysis, is because they describe a specific and incredibly fruitful type of batted ball — in general terms, a ball that is hit hard and well-elevated. In specific terms, this (from MLB.com):
To be Barreled, a batted ball requires an exit velocity of at least 98 mph. At that speed, balls struck with a launch angle between 26-30 degrees always garner Barreled classification. For every mph over 98, the range of launch angles expands.
For example: A ball traveling 99 mph always earns ‘Barreled’ status when struck between 25-31 degrees. Add one more mph — to reach 100 — and the range grows another three degrees, to 24-33.
Every additional mph over 100 increases the range another two to three degrees until an exit velocity of 116 mph is reached. At that threshold, the Barreled designation is assigned to any ball with a launch angle between eight and 50 degrees.
So we have a pretty clear definition of what a Barrel is. Why, then, don’t we have a similarly succinct definition for all of the non-Barreled batted-ball types? Well, the answer partially lies in this graphic:

As you can see, the combination of launch angle and contact quality that make up these non-Barrels isn’t all that clear-cut. Flares/Burners and Hit Under, in particular, have amorphous parameters that don’t appear particularly easy to pin down. These varying combinations of exit velocity and launch angle that determine each batted ball’s classification are partly why they can be so difficult to summarize.
Now, this isn’t to say that a definition for these batted-ball types doesn’t exist. Because it does. Tom Tango was actually kind enough to link me to the blog post where he outlined the formulas. For the fingerless, or those just too lazy to click, here’s the breakdown:
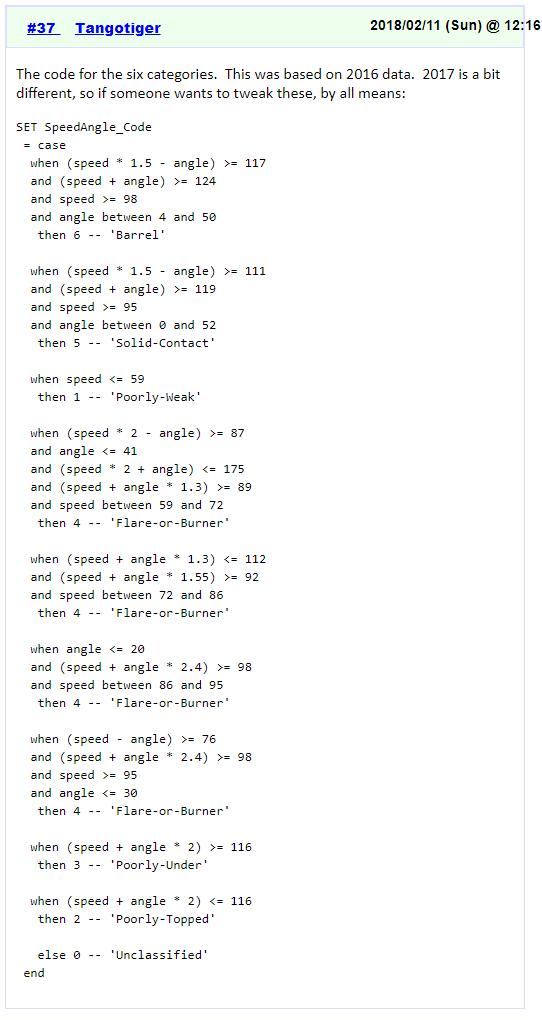
This is awesome information obviously, and provides a ton of great insight into how each of these stats is actually calculated. If you have a mashed potato brain like me though, it’s a lot to sift through. And it doesn’t quite address how to use these stats to evaluate players–which from a fantasy standpoint would be quite helpful.
The Results
So for those of us who can’t be bothered to dust off our TI-83 calculators or apply our intelligence to these formulas in a constructive, enlightening way, where do we go from here? Well, why not use these formulas in conjunction with the results of these batted balls over the past few years to get a better sense of what each of them is good for. The following is a breakdown of the results of each non-Barrel over the last two seasons, with Barrels included as well for reference:
| Total | BA | ISO | BABIP | SLG | wOBAcon | xwOBAcon | xBA | Launch Speed | Launch Angle | HR/BBE | |
|---|---|---|---|---|---|---|---|---|---|---|---|
| Barrel | 17,741 | 0.795 | 1.939 | 0.509 | 2.733 | 1.411 | 1.372 | 0.777 | 104.5 | 26.00 | 56.78% |
| Solid | 14,888 | 0.489 | 0.631 | 0.415 | 1.120 | 0.646 | 0.641 | 0.478 | 100.9 | 23.65 | 10.59% |
| Flare/Burner | 62,071 | 0.659 | 0.129 | 0.657 | 0.788 | 0.622 | 0.619 | 0.655 | 93.1 | 11.60 | 0.02% |
| Poorly/Under | 63,179 | 0.072 | 0.072 | 0.059 | 0.144 | 0.087 | 0.088 | 0.071 | 85.4 | 45.15 | 1.11% |
| Poorly/Topped | 83,859 | 0.180 | 0.017 | 0.180 | 0.197 | 0.164 | 0.166 | 0.182 | 84.9 | -14.40 | 0.00% |
| Poorly/Weak | 10,286 | 0.201 | 0.007 | 0.201 | 0.208 | 0.179 | 0.178 | 0.202 | 48.1 | -15.66 | 0.00% |
This is a lot to process, so let’s break down each batted ball type and sort out the major takeaways.
Barrel
World-renowned. Iconic. Universally loved. Ageless. If batted ball types were celebrities, Barrels would be Brad Pitt. More than half of Barrels (56.78%) have resulted in home runs over the past two years, and 83.8% of the home runs hit during that span have been barreled. They’re not just great for power output, though — they result in a base hit nearly 80% of the time. They’re an incredibly useful metric for measuring how often hitters are elevating the ball with authority.
Solid
Solids are interesting, because their average launch angle (23.6 degrees) isn’t all that different from a Barrel’s (26 degrees). And their 100.9 mph average launch speed indicates they’re hit nearly as hard as Barrels as well. Though they only generate home runs 10.59% of the time, they’ve produced a 1.120 SLG and .646 wOBAcon over the last two years. As you can see in the graphic from earlier, Solids are essentially any batted ball that falls just short of the requirements necessary to be a Barrel, either because their launch angle isn’t as ideal or because they’re not hit quite hard enough. Still, they’re excellent at producing extra-base hits, and they’re well above average in terms of generating offensive production.
Flares/Burners
Flares/Burners are the second-best batted ball types for base hits, generating a .659 average over the last two years. EDIT: Flares and Burners are actually two distinct batted ball types that tend to produce similar results. The exact breakdown can be seen in the formulas shared above, but Burners have higher exit velocities and lower launch angles (e.g. a blistered groundball), and Flares have lower exit velocities and higher launch angles (e.g. a bloop hit that falls between two fielders). While they are excellent for generating a high batting average, these batted balls practically never leave the yard–only 10 homers qualified as a Flare/Burner over the past two years.
Under
This batted-ball type is the absolute worst for base hits, with just a .072 batting average produced over the past two seasons. That’s probably not too surprising considering its average launch angle of 45.15 degrees; after all, we’ve known for years that fly balls have the lowest expected batting average of all batted ball types. It should be noted, however, that these aren’t totally useless the way pop-ups are — they have produced a home run 1.11% of the time over the past two seasons. Still, they are arguably the worst batted-ball type of the group.
Topped
Topped balls are almost exclusively comprised of batted balls hit at negative launch angles directly into the ground. A Topped ball could theoretically be hit 120 mph and still result in an easy out due to the neutralizing effect of their launch angle. They never result in home runs, but they are better than Under batted balls for reaching base, producing a .180 average over the past two years. A Topped batted ball likely gets a boost in value from speedsters who can use their sprint speed to beat them out for infield hits.
Weak
A weak batted ball is literally any ball hit at or below 59 mph, regardless of its launch angle. With an average launch angle of -15.6 degrees over the past two years, these seem to share a lot in common with Topped batted balls, in that they’re generally hit on the ground and are likely more beneficial to faster ballplayers who may be able to turn them into hits on occasion.
Ideal Contact Rate
Now that we have a slightly deeper understanding of these batted-ball types, we can start applying them to our analysis of a player’s performance. Based on their results over the past two years, we know that three of the batted ball types presented on Baseball Savant tend to produce above-average outcomes, and the other three tend to produce below-average outcomes. So let’s combine the above-average batted balls — Barrels, Solids, and Flares/Burners — into one statistic, to see which batters have been proficient at making the most of their batted ball events. Let’s call this stat something revolutionary and unique like, I don’t know, Ideal Contact Rate (ICR).
Below are the 100 batters who posted the highest ICRs last year, with breakdowns of their respective batted ball rates. I set the cutoff at 100 batted ball events (BBEs). This chart is sortable, and as a point of reference I’ve included an “Average” player for Barrels, Solids, and Flares/Burners to give you a sense of where each player stacks up in those three categories. Since the average ICR among batters with at least 100 BBEs was 37.8%, all of the players on this chart are above-average in the category.
| Rank | Player | Barrels/BBE | Solids/BBE | Flares/BBE | Ideal Contact |
|---|---|---|---|---|---|
| 1 | Aaron Judge | 20.2% | 13.0% | 21.8% | 55.0% |
| 2 | Joey Gallo | 26.4% | 8.5% | 17.8% | 52.7% |
| 3 | Jake Cave | 12.5% | 4.7% | 34.4% | 51.6% |
| 4 | Yordan Alvarez | 17.2% | 5.4% | 27.1% | 49.8% |
| 5 | Jason Castro | 17.2% | 7.9% | 24.5% | 49.7% |
| 6 | J.D. Martinez | 12.0% | 7.5% | 30.1% | 49.5% |
| 7 | Mike Trout | 18.6% | 7.1% | 23.7% | 49.4% |
| 8 | Nelson Cruz | 19.9% | 8.3% | 20.6% | 48.8% |
| 9 | David Freese | 15.3% | 2.5% | 30.5% | 48.3% |
| 10 | Domingo Santana | 12.5% | 6.2% | 29.4% | 48.1% |
| 11 | Brandon Lowe | 16.3% | 7.1% | 24.5% | 47.8% |
| 12 | Yoan Moncada | 12.2% | 7.2% | 28.3% | 47.6% |
| 13 | Donovan Solano | 4.2% | 6.0% | 37.5% | 47.6% |
| 14 | Bryce Harper | 14.8% | 7.5% | 25.3% | 47.6% |
| 15 | Chris Davis | 10.5% | 8.8% | 28.1% | 47.4% |
| 16 | J.D. Davis | 11.4% | 5.4% | 30.5% | 47.3% |
| 17 | Cody Bellinger | 13.0% | 6.8% | 27.5% | 47.3% |
| 18 | Howie Kendrick | 11.4% | 8.6% | 27.2% | 47.2% |
| 19 | Jorge Soler | 16.8% | 8.2% | 22.1% | 47.1% |
| 20 | Nate Lowe | 10.6% | 9.6% | 26.9% | 47.1% |
| 21 | Matt Olson | 14.5% | 9.0% | 23.7% | 47.1% |
| 22 | Franmil Reyes | 14.8% | 9.0% | 23.2% | 47.0% |
| 23 | Miguel Sano | 21.2% | 6.3% | 18.9% | 46.4% |
| 24 | Juan Soto | 12.3% | 8.7% | 25.5% | 46.4% |
| 25 | Austin Meadows | 12.5% | 6.8% | 27.1% | 46.4% |
| 26 | Max Muncy | 12.3% | 7.9% | 26.0% | 46.2% |
| 27 | Keston Hiura | 13.9% | 7.7% | 24.5% | 46.2% |
| 28 | Shohei Ohtani | 12.2% | 6.5% | 27.3% | 46.0% |
| 29 | Christian Yelich | 15.8% | 6.4% | 23.8% | 46.0% |
| 30 | Justin Turner | 7.8% | 9.3% | 28.8% | 46.0% |
| 31 | Anthony Rendon | 12.0% | 6.6% | 27.4% | 45.9% |
| 32 | Shin-Soo Choo | 8.8% | 9.0% | 28.1% | 45.9% |
| 33 | Mitch Garver | 15.5% | 10.6% | 19.5% | 45.6% |
| 34 | Mookie Betts | 10.3% | 8.5% | 26.7% | 45.5% |
| 35 | Rowdy Tellez | 13.2% | 7.4% | 24.9% | 45.5% |
| 36 | Nicholas Castellanos | 11.2% | 9.3% | 25.1% | 45.5% |
| 37 | David Dahl | 10.3% | 6.3% | 28.8% | 45.4% |
| 38 | Niko Goodrum | 6.3% | 8.7% | 30.3% | 45.3% |
| 39 | Danny Santana | 9.4% | 7.3% | 28.6% | 45.3% |
| 40 | Chance Sisco | 10.4% | 6.6% | 28.3% | 45.3% |
| 41 | Marcell Ozuna | 12.6% | 6.7% | 25.8% | 45.2% |
| 42 | Freddie Freeman | 12.5% | 7.0% | 25.6% | 45.1% |
| 43 | Ronald Acuna Jr. | 15.0% | 9.1% | 21.1% | 45.1% |
| 44 | Ronald Guzman | 9.2% | 6.4% | 29.5% | 45.1% |
| 45 | Cavan Biggio | 9.0% | 6.9% | 29.2% | 45.1% |
| 46 | Ramon Laureano | 9.7% | 7.2% | 28.1% | 45.0% |
| 47 | Andrew Benintendi | 8.1% | 7.6% | 29.3% | 45.0% |
| 48 | Josh Donaldson | 15.7% | 5.1% | 24.2% | 44.9% |
| 49 | Bryan Reynolds | 6.7% | 5.1% | 33.0% | 44.8% |
| 50 | Paul Goldschmidt | 11.3% | 9.0% | 24.4% | 44.7% |
| 51 | James McCann | 9.2% | 5.6% | 29.7% | 44.6% |
| 52 | Mike Ford | 9.6% | 5.2% | 29.6% | 44.3% |
| 53 | Gio Urshela | 7.0% | 8.1% | 29.2% | 44.3% |
| 54 | Carlos Correa | 13.5% | 9.6% | 21.2% | 44.2% |
| 55 | Kole Calhoun | 11.2% | 8.4% | 24.5% | 44.1% |
| 56 | Jose Abreu | 12.8% | 6.1% | 25.2% | 44.1% |
| 57 | Miguel Cabrera | 6.4% | 7.2% | 30.5% | 44.1% |
| 58 | Fernando Tatis Jr. | 13.2% | 7.5% | 23.3% | 44.1% |
| 59 | Austin Riley | 13.7% | 6.0% | 24.4% | 44.0% |
| 60 | Stephen Vogt | 10.4% | 9.3% | 24.4% | 44.0% |
| 61 | Trevor Story | 8.6% | 7.2% | 28.1% | 43.9% |
| 62 | DJ LeMahieu | 7.5% | 6.6% | 29.6% | 43.7% |
| 63 | Justin Smoak | 11.0% | 8.4% | 24.3% | 43.7% |
| 64 | Kyle Seager | 8.4% | 6.8% | 28.5% | 43.7% |
| 65 | Neil Walker | 6.5% | 5.7% | 31.4% | 43.7% |
| 66 | Mike Yastrzemski | 11.2% | 8.6% | 23.9% | 43.7% |
| 67 | Scott Kingery | 8.0% | 9.2% | 26.4% | 43.6% |
| 68 | Ryan McMahon | 9.0% | 7.1% | 27.3% | 43.5% |
| 69 | Eric Thames | 9.3% | 8.9% | 25.2% | 43.4% |
| 70 | Dansby Swanson | 10.1% | 6.0% | 27.1% | 43.3% |
| 71 | Kyle Schwarber | 14.5% | 9.0% | 19.8% | 43.3% |
| 72 | Michael Conforto | 11.9% | 5.2% | 26.2% | 43.2% |
| 73 | Christian Walker | 13.1% | 6.7% | 23.5% | 43.2% |
| 74 | Rafael Devers | 9.0% | 9.6% | 24.5% | 43.1% |
| 75 | Anthony Rizzo | 7.0% | 5.6% | 30.5% | 43.1% |
| 76 | Austin Slater | 10.1% | 6.4% | 26.6% | 43.1% |
| 77 | Eugenio Suarez | 14.0% | 6.1% | 23.0% | 43.1% |
| 78 | Will Smith | 10.7% | 9.1% | 23.1% | 43.0% |
| 79 | Brandon Dixon | 11.2% | 7.7% | 23.9% | 42.9% |
| 80 | Alex Dickerson | 9.0% | 10.5% | 23.3% | 42.9% |
| 81 | Ji-Man Choi | 11.3% | 7.1% | 24.3% | 42.7% |
| 82 | Luke Voit | 13.2% | 7.3% | 22.2% | 42.7% |
| 83 | Jorge Alfaro | 11.5% | 6.8% | 24.4% | 42.7% |
| 84 | Gary Sanchez | 19.1% | 4.4% | 19.1% | 42.6% |
| 85 | Charlie Blackmon | 8.3% | 7.9% | 26.4% | 42.6% |
| 86 | Matt Joyce | 6.5% | 6.5% | 29.7% | 42.6% |
| 87 | Jake Lamb | 8.2% | 11.9% | 22.4% | 42.5% |
| 88 | Tom Murphy | 10.9% | 7.5% | 24.1% | 42.5% |
| 89 | George Springer | 14.3% | 5.9% | 22.2% | 42.4% |
| 90 | Curt Casali | 6.0% | 5.3% | 31.1% | 42.4% |
| 91 | Wil Myers | 11.2% | 8.6% | 22.7% | 42.4% |
| 92 | Logan Forsythe | 5.5% | 7.7% | 29.1% | 42.3% |
| 93 | Lourdes Gurriel Jr. | 11.2% | 9.1% | 22.0% | 42.2% |
| 94 | JaCoby Jones | 10.7% | 6.8% | 24.8% | 42.2% |
| 95 | Mike Tauchman | 6.3% | 8.4% | 27.4% | 42.1% |
| 96 | Victor Reyes | 1.9% | 5.6% | 34.6% | 42.1% |
| 97 | Pete Alonso | 15.8% | 7.0% | 19.2% | 42.0% |
| 98 | Carson Kelly | 8.9% | 8.5% | 24.6% | 41.9% |
| 99 | Kevan Smith | 6.5% | 5.2% | 30.3% | 41.9% |
| 100 | Travis d’Arnaud | 7.7% | 8.5% | 25.7% | 41.9% |
| 101 | Average (min. 100 BBEs) | 7.6% | 5.9% | 24.8% | 38.3% |
Something that strikes me about this chart is how many 2019 breakouts are featured on it. Scott Kingery, Rafael Devers, Fernando Tatis Jr., Cavan Biggio, Gio Urshela, Jorge Soler, Howie Kendrick — the list goes on and on. Of course, you would expect players who performed well to post high Ideal Contact Rates. But if ICR is a stat that stabilizes fairly quickly, it could be an incredibly useful tool for identifying legitimate breakouts early in the year. Depending on how sticky it is, it may also be useful for identifying sleepers for this season–so consider keeping an eye on guys like Domingo Santana, Brandon Lowe, Chance Sisco, and Nate Lowe this year, if they can secure regular playing time. And, also, maybe Chris Davis?
One very important thing to pay attention to is the mix of batted balls that comprise each player’s Ideal Contact Rate. ICR on its own tells us what percentage of a player’s batted balls should produce above-average outcomes, but the exact mix of Barrels, Solids, and Flares/Burners give us a better sense of exactly where that ideal contact will benefit them. Take Donovan Solano, for instance. He ranked 13th in ICR last year, but the bulk of that ICR came from his absurdly high 37.5% Flare/Burner rate. That certainly supports the .330 average he posted last season, given that we know Flares/Burners are great for batting average. But the below-average Barrel and Solid rates he posted indicate the power shouldn’t be expected to show up anytime soon — and it certainly didn’t last year, as he mustered just four home runs. So pay close attention to the mix involved in ICR, and use what we now know about those batted ball types when conducting your analysis.
Combining ICR with Contact Rates
So to this point, we’ve defined all of Savant’s batted ball types, explored their average output over the past two years, combined the good batted ball types into a new statistic called Ideal Contact Rate, and taken a look at the top performers in ICR last season. Not bad for a day’s work.
But wait, there’s more! Call now and I’ll throw in a free Pitcher List beer koozie!
Just kidding. But there is one final thing I’d like to share in relation to ICR, and that’s players who combined high ICRs last year with excellent contact rates. Since ICR only tells us what percentage of a player’s BBEs are likely to have resulted in above-average outcomes, it’s only logical that we try to identify the players who not only had high ICRs, but maximized those ICRs by putting the bat on the baseball at an above-average rate. After all, a 50% ICR doesn’t really help much if you’re only making contact on 60% of your swings.
Below is a scatter plot created by the incredibly talented Nick Kollauf (@Kollauf) showing the top-100 hitters in ICR last year in relation to their contact rates. Hover over any point to reveal the player and their respective numbers:
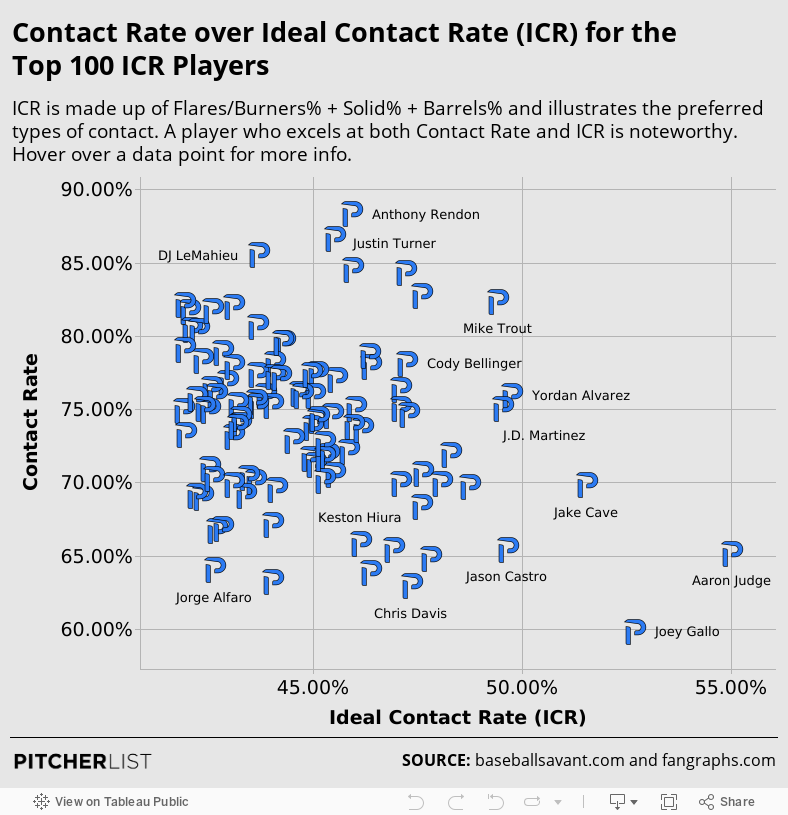
There are some interesting takeaways here. Howie Kendrick was essentially Mookie Betts last year in terms of pairing excellent contact rates with elite quality-of-contact. Domingo Santana showed up in the same realm as Bryce Harper and Nelson Cruz (and might have ascended to star status last year had he not gotten injured mid-season). Full-time at-bats for Jason Castro this year could be incredibly fruitful for those looking for a catching sleeper. And Jake Cave is essentially some kind of flaw in the Matrix; despite posting a barrel rate nearly twice the league average, a Flare/Burner rate in the top-3 among hitters with 100 BBE, and a decent contact rate, he mustered just a .258 average and eight homers over 72 games. Insanely uncharacteristic.
Next Steps
Ideal Contact Rate is a useful tool for looking beyond Barrels to get a sense of which players are making the most of their batted balls. But it still relies on examining the exact mix of Barrels, Solids, and Flares/Burners that comprise it in order to provide specific insights into a player’s performance.
Going forward, I’d like to find a way of properly weighing each of the three batted ball types to further refine it as a statistic. This would help address certain outliers — like Donovan Solano and David Freese — whose ICRs are buoyed almost exclusively by their Flare/Burner rates. Furthermore, finding a way of incorporating contact rate into the stat would help to further contextualize it. After all, it doesn’t really matter how much ideal contact you make if you rarely make contact in the first place. All-in-all though, I think this is a promising start for ICR, and the beginning of a more holistic way of analyzing hitters. And I look forward to helping it evolve over the coming months.
Featured image by Justin Paradis (@freshmeatcomm on Twitter)
