


Three weeks ago, I released a new statistic called Predicted Home Runs (pHR), which I intended to be an objective measure of a player’s predicted home run totals. Mind you, I’m not a statistician by trade, and I received a lot of helpful feedback from readers seeking to use and improve upon it. With a few more weeks of work, Colin Charles, David Fenko, and I have done just that. Many thanks to them both for their contributions to this article.
We have implemented a few substantial changes to this iteration of pHR. First, I tested new inputs and added variables where appropriate. Second, Colin and I accounted for multicollinearity by testing Variance Inflation Factors (VIFs), but more on that below. Third, with Colin and David’s help, pHR is now updating automatically daily on Tableau, which you can access here for all hitters dating back to 2015. Before, we were manually uploading CSVs to Tableau, which drove us collectively insane.
Let’s not put the cart before the horse, however. No one should use pHR without reading on and understanding its advantages and limitations. So that you know exactly what you’re getting, I provide my methods and a discussion of the application of pHR.
Methods
I’ll give a brief overview as I did in the last article. At a high level, I used multiple regressions to determine which metrics best explain the variability in home runs. Regressions tell us the coefficient of determination (R2) between two or more variables, which illustrates how much variance in the sample of one dependent variable (e.g., HRs) is explained by another independent variable (e.g., Brls/PA%). The higher the R2, the greater the independent variable explains changes in the dependent variable (though R2 will never exceed 1).
I chose HR/PA% as the dependent variable. The reason I chose HR/PA% instead of HR totals was to control for varying plate appearances in the sample. If Aaron Judge and Giancarlo Stanton had differing plate appearance totals in a given year, the statistics that they contribute to the regressions should not be weighted equally. Next, I collected a sample of all players with 150 batted-ball events (BBEs) in any single season from 2015-2018. This gave me a nice, large sample of 1,318 entries.
Figuring the R2 between Brls/PA% and HR/PA% might be very high, I began my regressions there. Unsurprisingly, it had the highest correlation with HR/PA% of all of the variables I had at my disposal. Indeed, 76.62% of the variance in players’ HR/PA% was explained by Brls/PA%. Then, I began adding in other independent variables to see what else might explain additional variation in HR/PA%.
What makes this difficult is that, if you just add in more variables, the R2 will continue increasing. No matter what you add, the R2 will always go up. However, it’s important to tell whether an additional independent variable is actually contributing to greater precision in the model, as opposed to the R2 simply increasing by chance.
To that end, for each new variable I added to the regression, I examined the adjusted R2, which adjusts for the number of predictors in the model and, therefore, only increases if the new term improves the model more than would be expected by chance. As a result, where I added a new variable and the R2 increased but the adjusted R2 decreased, I knew the increase was due to chance rather than any unique additional variance explained by the new independent variable.
I also checked the P-value for each new variable. If the P-value was less than 0.05, then we would then reject the null hypothesis that there is no relationship between the independent variable (in the context of the other independent variables) and the dependent variable. Consequently, a P-value under 0.05 indicates that a given independent variable was statistically significant by accounting for unique variance in the HR/PA% sample.
Finally, I checked the VIF for each new variable to control for multicollinearity:
In regression, “multicollinearity” refers to predictors that are correlated with other predictors. Multicollinearity occurs when your model includes multiple factors that are correlated not just to your response variable, but also to each other. In other words, it results when you have factors that are a bit redundant.
Unfortunately, multicollinearity increases the standard errors of the coefficients. Therefore, even if xSLG, for example, helped explain more of the variance in the sample, if it were highly correlated to Brls/PA% (which it is, by the way), then it could throw off the coefficient for Brls/PA% and skew the results the pHR formula spits out for any single player. Indeed, “by overinflating the standard errors, multicollinearity makes some variables statistically insignificant when they should be significant.”
As a result, after adding in a new variable, where the VIF for any single existing variable increased over 2.5—or, in other words, that variable shared approximately ~0.60 R2 with another variable in the formula—then I nixed the less significant variable. At bottom, then, there were three requisite conditions for adding any variable to the formula:
- The adjusted R2 of the relationship between the model and HR/PA% increased.
- The P-values for all of the variables remained under 0.05.
- The VIFs for all of the variables remained under 2.5.
The pHR Formula
After running through that rigmarole, here are the variables that made the cut:
| Metric | P-value | VIF |
| Brls/PA% | 4.5E-298 | 1.76 |
| PA | 2.38E-05 | 1.24 |
| Pulled FB+LD% | 4.07E-71 | 1.15 |
| LD% | 1.8E-28 | 1.05 |
| K% | 1.54E-06 | 1.49 |
| BB% | 0.001687 | 1.15 |
Finally, after devising a model from these variables, Colin tested both the Bayesian Information Criterion (BIC) and the Akaike Information Criterion (AIC)—which penalize models with too many variables—to ensure there was no overfitting. Put differently, he tested these variables against more simplified versions of this model (e.g., just Brls/PA%, PA, and Pulled FB+LD%). Both the AIC and BIC selected all of the variables above as representing the best available model.
The coefficients are weighted such that certain variables matter more than others. Brls/PA% is the most important and weighted accordingly, whereas PA, K%, and BB% fall on the other end of the spectrum. Still, they each explained unique variance in the sample without presenting multicollinearity issues.
You may be wondering why I replaced Pull% and FB% from the old pHR model with Pulled FB+LD%. To obtain Pulled FB+LD%, we conducted Statcast searches (rather than go to Fangraphs because its FB% includes infield fly balls) to see how often players pull fly balls and line drives. The reason is that, when players pull fly balls and line drives, and thereby take advantage of shorter fences down the line, they can outperform their expected power. Accordingly, Pulled FB+LD% explained unique variance in the sample beyond what Brls/PA% provided.
What’s more, Pulled FB+LD% was highly correlated with FB% and Pull% per VIF, so I couldn’t keep all three. Pulled FB+LD% essentially captured what Pull% was contributing to the old model, except more precisely. Certain players have high pull rates with a low Pulled FB+LD% (e.g., J.D. Martinez), whereas others have low pull rates with a high Pulled FB+LD% (e.g., Josh Bell). The old model would overpredict pHRs for Martinez and underpredict them for Bell, whereas Pulled FB+LD% accounts for this discrepancy. Additionally, I removed FB% because Brls/PA% already accounted for elevation. Therefore, Pulled FB+LD% was a better fit in the model in terms of P-value, Adjusted R2 and VIF.
Relatedly, for the sake of complete transparency, here’s a list of all the variables that did not pass our three-pronged test:
| xBA |
| xSLG |
| xwOBA |
| Sprint Speed |
| Age |
| IFH% |
| IFFB% |
| Swing% |
| O-Swing% |
| O-Contact% |
| Z-Swing% |
| Z-Contact% |
| Contact% |
| Swinging Strike% |
| Exit Velocity |
| Hard Hit% |
| Hard% |
| Soft% |
| Brls/BBE% |
| Exit Velocity on FB/LD |
| Launch Angle |
| GB/FB |
| GB% |
| FB% |
| Pull% |
| Cent% |
| Oppo% |
| BABIP |
I’ll reiterate a few more points I made in the last article. First, Exit Velocity on FB/LD, Launch Angle, Hard Hit%, and other power metrics are on this list not because they aren’t correlated with HR/PA%, but because they do not explain unique variance in the HR/PA% sample beyond what the independent variables in the first table already tell us. My guess is that much of what Exit Velocity on FB/LD or Launch Angle illustrates is already accounted for by Brls/PA%. There are also common metrics missing from this list, such as SLG, HR/FB%, and ISO. I never tested them in the model because I did not want to artificially inflate the R2 by including metrics that actually account for home runs.
Ultimately, after discarding all of these stats, the pHR model was complete. The R2 for all of the variables from the first table (e.g., Brls/PA%, PA, Pulled FB+LD%, LD%, K%, and BB%, etc.) and HR/PA% was 0.8284. In other words, predicted HR/PA% based on the model explains 82.84% of the variance in the HR/PA% sample.
Reintroducing pHR
The next step was to take the intercept and coefficients (weights) from the regression and create a formula. With that formula, I was able to plug in players’ actual stats to derive their pHR/PA%, or, put differently, what their HR/PA% should have been given their Brls/PA%, PAs, LD%, etc.
From there, I multiplied each player’s pHR/PA% by his actual PA figure to get a pHR total. I’ve posted each player’s pHR total next to his actual HR total here so that you can make your own evaluations. With David and Colin’s assistance, the Tableau link updates automatically so that each morning you will see accurate pHR totals for current players.
Before diving into some examples, I want to make a few points. First, from 2015-2018, pHR shared a 0.9013 R2 with actual home run totals. Put differently, 90.13% of the variance in players’ home run totals can be explained by pHR.
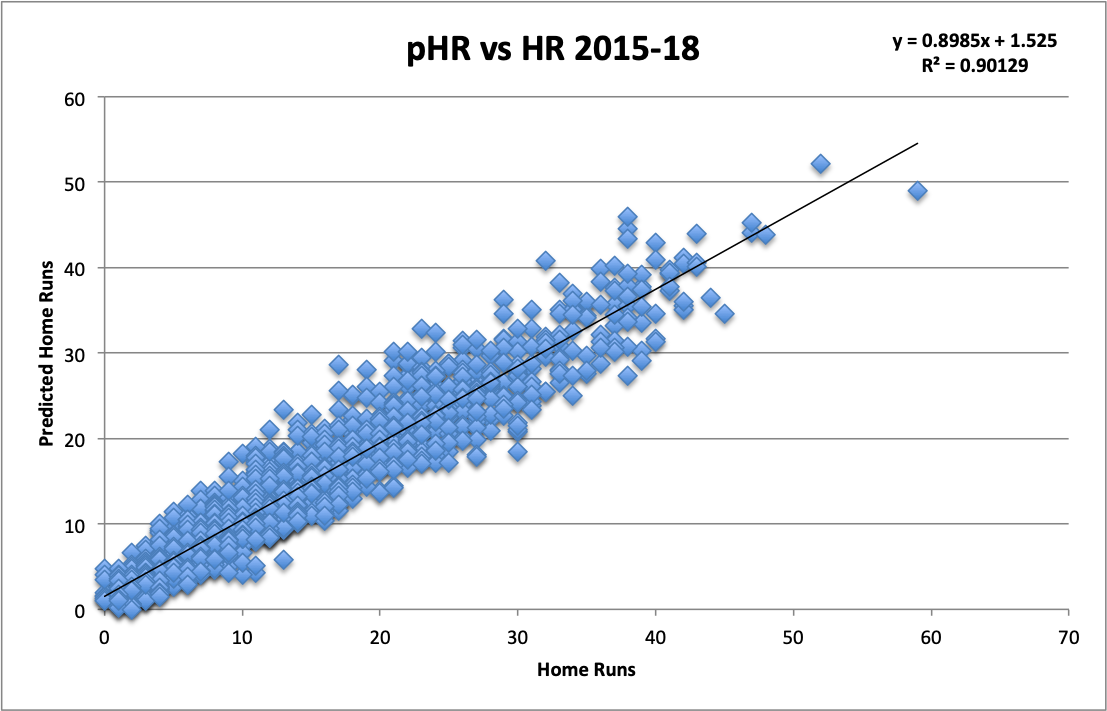
I’ll highlight how pHR explains so much of the variance in home runs over the last few years, without including a single actual home run hit in any of the variables of the model.
This next point is key—pHR will not share the same faults as HR totals because it is not subject to the same flaws as home run totals: flukey variance or luck. It is solely a measure of how many home runs a hitter should have based on what happened to other players with similar Brls/PA%, LD%, PAs, K%, BB%, and Pulled FB+LD% from 2015-2018.
The correlation is not perfect. There will always be luck factors involved. In addition, pHR does not account for home ballpark, which likely explains much of the remaining variance. It would be difficult to derive a proper coefficient for that given how many players switch teams mid-season, which would affect the sample. Thus excluded, the formula likely will overpredict pHRs to a small degree for players with large home ballparks, such as in San Francisco and Detroit, and underpredict pHRs for players with small home ballparks like Yankee Stadium or Great American Ballpark.
Discussion
Let’s start with a peek at the 2019 pHR leaderboard:
| Name | HR | pHR |
| Pete Alonso | 21 | 20.2 |
| Jose Abreu | 16 | 19.1 |
| Mike Trout | 17 | 19 |
| Freddie Freeman | 17 | 18.6 |
| Marcell Ozuna | 17 | 17.7 |
| Josh Bell | 18 | 17.6 |
| Gary Sanchez | 19 | 17.6 |
| Edwin Encarnacion | 18 | 17.4 |
| Cody Bellinger | 20 | 16.7 |
| Renato Nunez | 16 | 16.1 |
A quick trip to the Statcast exit velocity and barrels leaderboard and you’ll find Pete Alonso, Jose Abreu, Mike Trout, Freddie Freeman, and Gary Sanchez all in the top 10 by Brls/PA%, which is the most important variable in the pHR formula. Is it any surprise, then, that they show up as some of the players pHR likes the most? Some of the others are nearby in the top 25, including Marcell Ozuna, Josh Bell, and Renato Nunez. Next, Cody Bellinger and Edwin Encarnacion lead MLB with 61 and 53 pulled fly balls and line drives, respectively. Therefore, they’re able to outperform what Brls/PA% alone would suggest for them and they find themselves on the pHR leaderboard.
Next, the unluckiest players in MLB by pHR:
| Name | HR | pHR | HR-pHR |
| Adalberto Mondesi | 6 | 12.3 | -6.3 |
| Jose Ramirez | 4 | 9.4 | -5.4 |
| Anthony Rendon | 11 | 16 | -5 |
| Kendrys Morales | 2 | 6.8 | -4.8 |
| Mookie Betts | 10 | 14.7 | -4.7 |
Notably, pHR really likes Adalberto Mondesi. My guess is that he will continue to underperform pHR given he plays in the large confines of Kauffman stadium, though not to this degree. His 6.9 Brls/PA% portends better days ahead. Jose Ramirez, however, is a different story. I thought I had him figured out, but this suggests he should be better. In fact, Ramirez ranks 13th in MLB with 41 pulled fly balls and line drives, so he probably should have more homers as pHR illustrates. Though his poor LD% and Brls/PA% have suppressed his pHR total below 10.
Anthony Rendon is 32nd in MLB with 34 pulled fly balls and line drives, and in the top 10 in Brls/PA%. Unsurprisingly, he also finds himself near the top of the pHR leaderboard, just below Nunez, in spite of only having 11 actual home runs. Likewise, Yankees fans are understandably frustrated with Kendrys Morales, but he should have more homers than two. That said, 6.8 pHRs is no incredible feat.
And finally, Mookie Betts provides a great example of the application of pHR. According to pHR, he’s been one of the best power hitters in MLB. Betts is unique in that his Brls/PA%, LD%, and Pulled FB+LD% are good but not elite, though he still has a high pHR total. I believe pHR likes him due to the other variables in the model: K% (13.9% – 21st in MLB), BB% (15.5% – 9th in MLB), and PAs (296 – 2nd in MLB). As a result, Betts has a ton of opportunities to hit home runs.
Lastly, the luckiest players by pHR:
| Name | HR | pHR | HR-pHR |
| Alex Bregman | 18 | 10.8 | 7.2 |
| Christian Yelich | 23 | 15.9 | 7.1 |
| Tommy La Stella | 14 | 7.6 | 6.4 |
| Joc Pederson | 18 | 11.8 | 6.2 |
| Derek Dietrich | 17 | 11.1 | 5.9 |
First, I am by no means suggesting that these are bad hitters. Many of them are excellent contact hitters, runners, and on-base machines. Besides Tommy La Stella, even just by pHR they are all even good power hitters. All I’m providing you is the fact that the inputs in the pHR formula suggest that these hitters have overperformed to date.
Alex Bregman is in the top 10 for pulled fly balls and line drives. That is likely why, even though he finds himself on this list, he has more than 10 pHRs. Yet, pHR still suggests that he has overperformed, and I’m not shocked given his subpar 5.3 Brls/PA% (161st among all players with 50 BBEs). Christian Yelich is actually 20th in Brls/PA%, which is why his pHR is still excellent, it just doesn’t support all 23 of the home runs he has smacked. His LD% and Pulled FB+LD% are also low. Yelich still finds himself in the top 15 in pHR, but it indicates that he should not be the most prolific slugger in the league.
Likewise, Joc Pederson has a respectable pHR total in spite of the large differential between his HRs and pHRs, and the reason is that he has a very good 8.7 Brls/PA%. Derek Dietrich is the most difficult one to explain given his stellar 10.9 Brls/PA%. His pHR total is likely low because he only has 19 pulled fly balls and line drives and an extremely low 15.2 LD%. Still, playing in Great American Ballpark will always afford him some leeway between his HRs and pHRs, and perhaps his pHR total should actually be a bit higher.
I skipped over La Stella because the last iteration of pHR also pegged him as lucky, and I received a lot of pushback for it. Here’s my blunt take. I’ll note at the outset that Alex Fast pointed out how several of La Stella’s homers have just cleared the right-field wall of Angel Stadium of Anaheim, which is likely because the club lowered the wall in the 2017-2018 offseason. His Brls/PA% is a meager 5.2%, good for 165th-best in baseball. And he does not make up for his lack of power by pulling fly balls and line drives, given he only has 30 such hits this season (64th in the league). No, my guess is that La Stella went hot for a stretch and took advantage of the lowered right-field wall, but that he does not have the same Pulled FB+LD% approach as someone like Bregman or the raw power of Pederson/Dietrich, so he likely can’t keep it up.
Conclusion
pHR is new and improved. There are no multicollinearity concerns skewing results for specific players. In addition, by factoring in Pulled FB+LD%, pHR no longer underestimates those hitters who employ this approach to overperform our expectations.
Moreover, discerning how to run a script automatically has removed all doubt that pHR will accurately capture up-to-date results for current players. I recommend giving it a look. I also highly recommend adding pHR to your arsenal. Use it to evaluate players’ power capabilities, and check your work by looking at the pHR inputs for each player you’re evaluating.
No longer do you have to look at a player’s rank on the Statcast leaderboard or his FB% and Pull% on Fangraphs to guess how many home runs he should have. We’ve done all of that work for you. Now, just use pHR.
Featured Image by Justin Paradis (@freshmeatcomm on Twitter)
