


With each passing year advanced stats are making their way into more and more fantasy players’ toolkits. We are deep into a new era of information—one that continues to grow and evolve each year. One of the biggest leaps forward occurred in 2008 with the introduction of PITCHf/x, which allowed anyone with a computer to download and analyze pitch information. In 2015, we were spoiled yet again with the introduction of Statcast, which tracked pitching, hitting, sprint, and fielding information. As great as these systems are, none of this would matter except for the glorious fact that the data was made publicly available.
Don’t let the name fool you, “advanced” stats are a basic part of our game. We’ve come a long way since guys like Bill James started publishing works like The Bill James Baseball Abstract. Fantasy owners, from rookies to the oldest vets, rely heavily upon statistical analysis to make projections, decipher player performance, and much, much more. Nowadays, thanks to that series of tubes we call the internet, we have a plethora of data available to us at all times to tell us anything we want to know, from how hard a player hits a ball, to how much that ball spun on its way to the bat, to whether that ball should have landed in a glove, and everything in between. To succeed in today’s stat-filled fantasy landscape, players need to understand of how these metrics can be used to their advantage. This article will attempt to talk about the most common and useful stats, while pointing out their strengths, shortcomings, and alternatives. I urge all readers to open our glossary in a separate tab for reference—stat discussions can quickly turn into an alphabet soup that can be tough to keep track of if you aren’t used to the acronyms.
One quick disclaimer: There is no such thing as a truly predictive stat! Even the fanciest of stats can only tell us what has already happened, or in the case of expected stats, what probably should have happened. Because statistics are, by their nature, rooted in the past, they cannot tell us whether a player will develop a new skill or pitch, or whether they’re going to be injured, or whether opposing teams will find a flaw in their game. We also cannot predict luck—though we can generally identify luck if someone has it for long enough. This is important because believing that a single stat is giving you the whole story on a player’s performance is one of, if not the biggest mistakes you can make!
In this piece we will explore three groups of stats that you’re sure to run into while researching—performance-related stats, Statcast-derived stats, and adjusted stats. We’ll also throw in a few of our favorites from each category.
Performance-Related Stats
This is easily the most straightforward category of the three. This category includes measurements (like runs and stolen bases), rate/percentage stats (like strikeout rate and ground-ball rate), and averages (like BABIP and OBP). They always show us something that actually happened, and they aren’t tweaked or adjusted based on outside factors like ballpark dimensions. They are pure, straightforward numbers. On one hand, the simplicity of this type of stat is beautiful—there’s usually not some complex formula or spreadsheet that you need to plug these stats into to understand how they were calculated. Ground-ball rate, for example, is how often a player hits the ball on the ground. On-base percentage is how often a player gets on base. Stats like these don’t really require much explanation. Once you know what a performance-related stat measures, understanding it is easy. Of course, the downside to these stats stems from that very simplicity—on their own, they can’t tell us enough information to make good decisions. They must be used together with other pieces of data to tell an accurate story.
Whenever you use performance-related stats, you must always be wary of context. As Homer Simpson so eloquently stated, “Facts are meaningless. You can use facts to prove anything that’s even remotely true. Facts schmacts.” It’s easy to curate stats and make any player seem like a superstar. For example, what if I told you of a guy who, in his 146 second-half plate appearances, had a .295 batting average, a .411 OBP, a nearly one-to-one strikeout-to-walk ratio, and the league’s highest line-drive rate (among players with at least 100 second-half plate appearances)? Are you interested? Well, don’t be. It was just Matt Joyce. If you don’t know who that is, don’t look it up. The fact you have no idea who he is speaks volumes to his fantasy relevance this offseason.
On that note, always be skeptical of “Player A versus Player B” comparisons, as they’re often cherry-picked nuggets of data that lack the context you need to make an informed decision. That type of comparison usually relies upon performance-related stats. Those stats I mentioned about Joyce compared favorably to his teammates Josh Donaldson and Freddie Freeman, even though Joyce is many tiers below those two in virtually every other aspect of the game.
It’s imperative to treat performance-related stats as starting points instead of endpoints, even though fantasy baseball ultimately uses these types of stats as the scoring. Seeing that Jon Berti stole four bases in a single game makes it seem like he’s an elite base-stealing threat. If you dig into the matchups of that game, the context of the season, and how Berti got on base in the first place (not that I want to take anything away from him—it’s a great feat to steal four bases in a game), you might get a little more perspective on those four steals and get a better feel for how much weight to put into his stolen base totals.
With all of that out of the way, let’s look at some of the better performance-related stats available to us.
wOBA
Hands down my favorite baseball stat is wOBA (weighted on-base average). If you are looking for some background on wOBA, you can look here and here. They should give you a pretty good start. wOBA is a stat that gives proper weight to how a player reaches base, and notice that I used the word proper there. Other stats that have a similar principle to wOBA are SLG, and OPS. SLG is calculated as the total number of bases per at bat and OPS is SLG plus on-base percentage. So, what’s the difference between wOBA and these other metrics? The way the weights are attributed in the formulas.
When SLG is calculated it assumes a double is worth twice as much as a single, and a home run is worth four times as much as a single. It seems a bit arbitrary to assign a weight based on how many bases you touch doesn’t it? In reality, wOBA does a much better job at giving each offensive stat its due worth, and in the wOBA realm a double is worth roughly 1.4 times that of a single and a home run is worth roughly 2.4 times more than a single.
If you are unfamiliar with how to interpret wOBA, just treat it the same way you would OBP, as wOBA was designed to be placed on the same scale as OBP. If you see a wOBA of 0.380, that’s pretty good, a wOBA of 0.330 is roughly average, and anything below 0.300 is fairly pedestrian. Below is a table showing some examples of where players finished the 2019. And yes, your eyes are not deceiving you, that is in fact MVP vote-getting Kevin Pillar (who tied Max Scherzer in the 2019 NL MVP points) in the 0.290-0.310 bucket.
| wOBA Range | Name |
|---|---|
| < 0.290 | Orlando Arcia, Khris Davis |
| 0.290 – 0.309 | Kevin Pillar, Starlin Castro |
| 0.310 – 0.329 | Willy Adames, Domingo Santana |
| 0.330 – 0.349 | J.T. Realmuto, Rhys Hoskins |
| 0.350 – 0.369 | Danny Santana, Bryce Harper |
| 0.370 – 0.389 | Yoan Moncada, Freddie Freeman |
| 0.390 – 0.409 | Juan Soto, George Springer |
| 0.410+ | Christian Yelich, Mike Trout |
Using a simplified example, we can see how a power hitter and a more contact-oriented player can achieve the same final wOBA, but it’s up to you to decide which one (if any) is superior to the other!
| uBB | HBP | 1B | 2B | 3B | HR | AB | SF | wOBA | |
| Player A | 70 | 3 | 80 | 40 | 0 | 40 | 600 | 9 | 0.372 |
| Player B | 70 | 3 | 124 | 34 | 5 | 20 | 600 | 9 | 0.372 |
It’s interesting to see how a contact-oriented hitter can produce the same value as a power hitter, and the way you judge the superior player is based on the needs of your team.
SwStrk%
One of my favorite indicators for both hitters and pitchers is SwStr% (swinging-strike percentage). It’s one of those stats that can be looked at as a whole, or you can break it down by pitch type and really get down to a player’s strengths or weaknesses. Before we go on, let’s just quickly make a distinction between SwStr% and Whiff%. SwStr% is based on swings and misses divided by total pitches, while Whiff% is swings and misses divided by the number of swings. If you are focusing on pitchers, a general guideline I use myself for SPs is anything north of a 14% and 17+% for relievers is considered good. If you decide to dive deeper and go pitch by pitch, you’ll have to keep in mind that you cannot compare each pitch type equally. For example, if you were to compare the SwStr% of a four-seam fastball and a slider, a 14% value for a four-seamer would be considered elite, but the same value for a slider would be well below average. For hitters, you can use SwStr% as a measure of a batter’s contact ability. The best hitters in MLB will likely have SwStr%’s below 7%, and the free swingers will be hovering above 14%.
Statcast-Derived Stats
Statcast is an amazing tool. We, the general public, have never had access to this kind of data before. From the comfort of your own computer, you can see exactly how hard guys are hitting the ball, the precise angle at which it leaves the bat, and even the expected outcome from that type of batted ball. On the pitching side, we can also see much the ball spins on its way to the plate, how hard batters are hitting the ball against them, and even how much their various pitches break horizontally and vertically compared to other pitchers with similar velocity on that pitch! For example, you might watch a Chaz Roe frisbee slider or an absolute laser off the bat of Joey Gallo and think, “Whoa, that’s a crazy,” and you’d be right. The cool thing nowadays is that Statcast can numerically explain just how crazy it is.
Statcast is also useful in how it categorizes various events. One of the most popular categories of events is a barrel, which is a ball hit with ideal exit velocity and launch angle. It’s not just hit hard or hit in the air; it’s hit hard (at least 98 mph) and at an angle that generally leads to the best outcomes. More information about about barrels can be found here, but in short “The barrel classification is assigned to batted-ball events that have led to a minimum .500 batting average and 1.500 slugging percentage.” Many of Statcast’s metrics use league averages to provide proper context for expected outcomes or measurements. Below is a useful graphic for visualizing how barrels are defined.
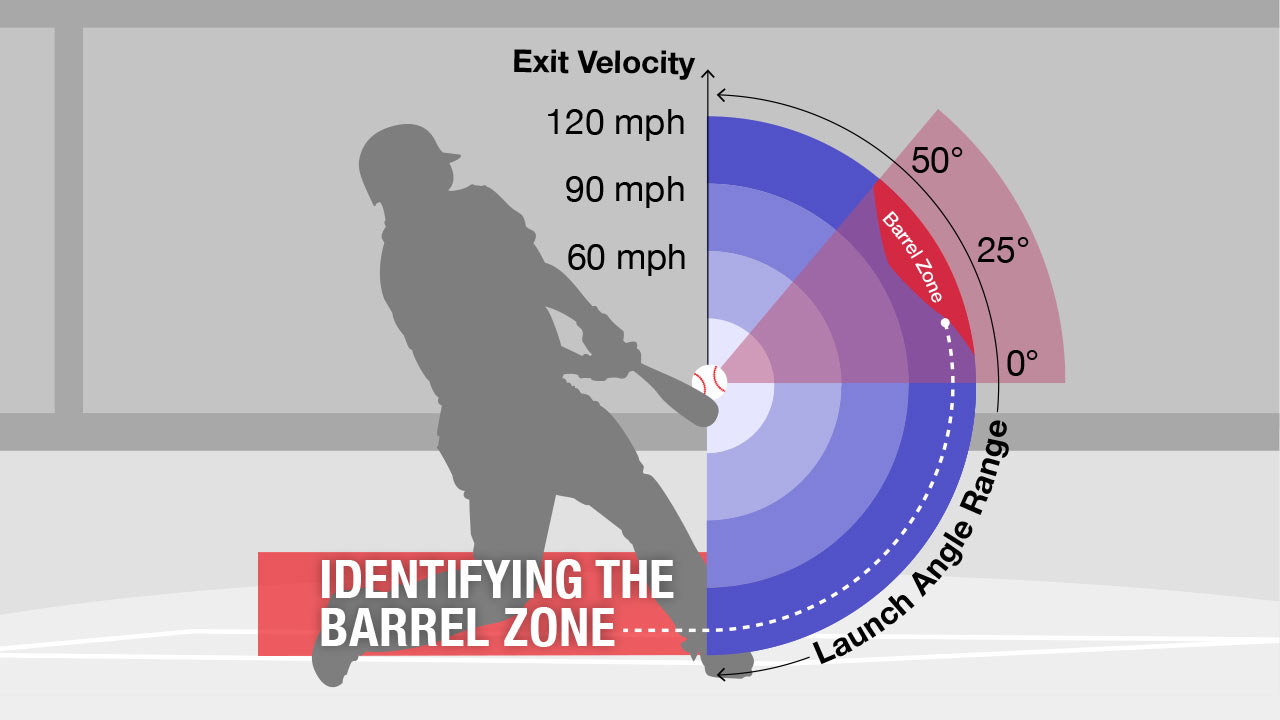
via MLB.com
Finally, I’d be remiss if I did not take a moment to discuss expected stats. Expected stats are an attempt to take all factors of luck out of what actually happened in a particular moment. For example, on August 25, 2019, in the bottom of the 10th inning, Nick Castellanos pulverized a 2-1 fastball at 94.8 mph from Daniel Hudson. It was a towering fly ball that traveled 413 feet at a blistering 106.5 mph. Based on the exit velocity and launch angle, it had a 73% chance of being a hit (or in other words, a .730 expected batting average, also known as xBA). Unfortunately for Castellanos, the ball stayed in the field of play at Wrigley, landing comfortably in the outfielder’s glove. In the same game, Howie Kendrick pounded a hard ground ball into the dirt that traveled just 10 feet before it found a glove. It had an xBA of .290, considerably lower than Castellanos’ blast, and yet Kendrick found his way to a base and created no outs. Luck is a fickle mistress in baseball, and expected stats give us a way to measure how well a player has done while taking the weirdness of random outcomes out of the equation. I’d caution you to not overly rely on expected stats. They’re incredibly useful, but they mostly just measure quality of contact. They aren’t predictive, they can just identify guys who might have recently opened an umbrella indoors.
With that explanation out of the way, let’s dive into some specific stats and how we can use them.
Barrel%
There are two common statistics that potentially use the term Barrel%; the first is barrels per plate appearance (Brls/PA), and the second is barrels per batted-ball event or balls in play (Brls/BBE). Another reason to keep a high value on barreled balls is that roughly 60% of barrels went for homers in 2019 (per Mike Petriello). For fantasy purposes, a player who has a high Barrel% is likely to be an impact player for your team and should consistently provide high value hits. Each measure has its own advantages, and as I’m sure you’ve deciphered, Brls/BBE only considers at bats that end in a batted-ball event and ignores walks and strikeouts. Although it does give you a pretty good indication of players who crush the ball whenever they make contact, it may also favor players who have less ability to consistently put balls in play. The main reason I prefer to use Brls/PA as my measure of Barrel% is because it accounts for each time a player makes a plate appearance, and not just when they put a ball into play.
xwOBA
Expected Weighted On-Base Average is basically what you probably expect. It’s a statistic that gives you an estimate for how a player should be performing based on similarly batted balls. If you want to analyze a player and determine if their hot start is legit or merely a mirage this is where you should begin. It’s calculated using a combination of exit velocity and launch angle, and for poorly hit balls, sprint speed is also considered. So, is this the be all, end all for Statcast-derived stats? Well not exactly, one thing that is not considered in the formula for xwOBA is batted-ball direction. And while I have no proof to back this up, I’m sure those Statcast gurus will implement batted-ball direction into the formula at some point.
So why do I bring up why batted-ball direction is important? Well it begins with one of the most polarizing players who gets discussed in the Pitcher List Discord channel, Alex Bregman. If you were to look at Bregman’s spray chart you’d see that he is a heavy pull hitter. All but three of his 2019 home runs were hit to his pull side, and it is because of this batted-ball profile why he has been able to outperform his xwOBA the last two years. So, this is just a reminder to keep a player’s batted-ball profile in mind when analyzing their wOBA/xwOBA, as just because a player’s xwOBA is lower than their actual wOBA it could be sustainable.
LD/FB exit velocity
Why fly balls and line drives you ask? Well let’s look at a table showing the league average wOBA values by batted-ball type for the Statcast era:
| GB | LD | FB | PU | |
| 2015 | 0.227 | 0.714 | 0.314 | 0.020 |
| 2016 | 0.227 | 0.715 | 0.367 | 0.021 |
| 2017 | 0.226 | 0.661 | 0.456 | 0.022 |
| 2018 | 0.225 | 0.649 | 0.445 | 0.020 |
| 2019 | 0.219 | 0.646 | 0.496 | 0.020 |
You should be able to see that the most valuable hits are fly balls (FBs) and line drives (LDs), and the other two generally produce poor results. Because of the big difference in value that the different batted-ball types produce, I don’t like to use average exit velocity when analyzing a player. There is another aspect to using FB/LD exit velocity, and that is keeping an eye on a player’s GB%. Depending on what site you use, the batted-ball breakdown might not include LD%, or PU%, but there will likely always be FB% and GB%. If you are looking at a player’s profile and you see a player with a high GB%, it would be a lot tougher for that player to put enough balls in the air to produce fantasy value (excluding SBs).
Adjusted Stats
The adjusted stats are probably the easiest to interpret, as most of the work is already done for you! There are two reasons why I love adjusted stats; (1) They are easily comparable, and (2) they are incredibly powerful. The most common and well-known example is probably wRC+, and it’s likely almost every time you read an article analyzing a player it will quote their wRC+. The beauty of many of these advanced stats is that they are designed on a scale using 100 as average and that every point above and below 100 is equal to 1 percentage point better or worse than league average. If you look at the FanGraphs glossary entry for wRC+ you can see the following:
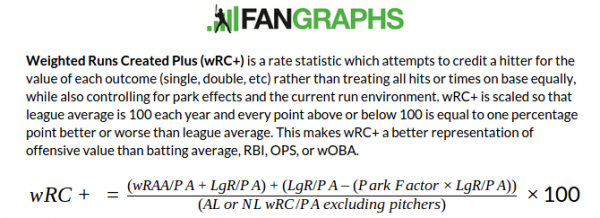
You can see that there is a lot going on in the background to come out with the wRC+ value. For the casual fan, manually calculating this would quickly become a burden. But if you are curious enough and you do some digging, you would find that wOBA is a fundamental base for calculating wRC+. The adjusted stats will often also account for park or league factors, which allow us to compare players who are playing in different environments to come up with an objective assessment between many players. As an example, we can compare the offensive output between two of the top players in the AL MVP race in 2019: Mike Trout, and Bregman. Trout was rocking a 180 wRC+, and Bregman’s was 168 wRC+, which we interpret as Trout’s offense was 12% better than Bregman’s, which over a season is a significant margin.
Conclusion
Well there you have it, a quick primer of the world of advanced stats. That wasn’t so bad now was it? At the very least, you should now recognize that these so-called “advanced stats” don’t require you to have a fancy degree in advanced mathematics, just some curiosity. There are stats for everything, and just when you think you’ve discovered your favorite stat, you’ll likely find that a new one has emerged that makes your favorite stat seem obsolete. The more you use, struggle with, and embrace stats, the better you’ll feel about your baseball opinions, fantasy-related or not. The beauty of our modern world is that you don’t need to know a lick of mathematics to use or appreciate these stats—those number-loving eggheads have done all the work for you!
Good luck in your leagues this year, the staff at Pitcher List are pulling for you!
Featured Image by Justin Paradis (@freshmeatcomm on Twitter)
