


Last May, Pitcher List’s Dave Cherman wrote an article that serves as a must-read for anyone wishing to understand the basics of hitter plate discipline metrics. Among the many interesting tidbits and conclusions that Dave uncovered, the most germane was that a hitter’s contact rate is the best statistical predictor of his strikeout rate.
Changes in contact rate and its reciprocal whiff rate (whiffs / swings) explain roughly 83% of the deviations in strikeout rate for hitters. As a result, analysts focus on short-term movements in whiff rate as indicative of current or future changes in strikeout rate. Moreover, they focus on the overall level of a player’s strikeout rate in relation to his whiff rate, forecasting a regression a to the latter if the strikeout rate is too high or too low.
This type of analysis works most of the time. However, as Dave astutely pointed out, the relationship between contact and strikeouts isn’t perfect. A large swath of players stray from the norm, either over or underperforming the whiff-predicted strikeout rate. This article will explore these players and what drives these deviations.
Background
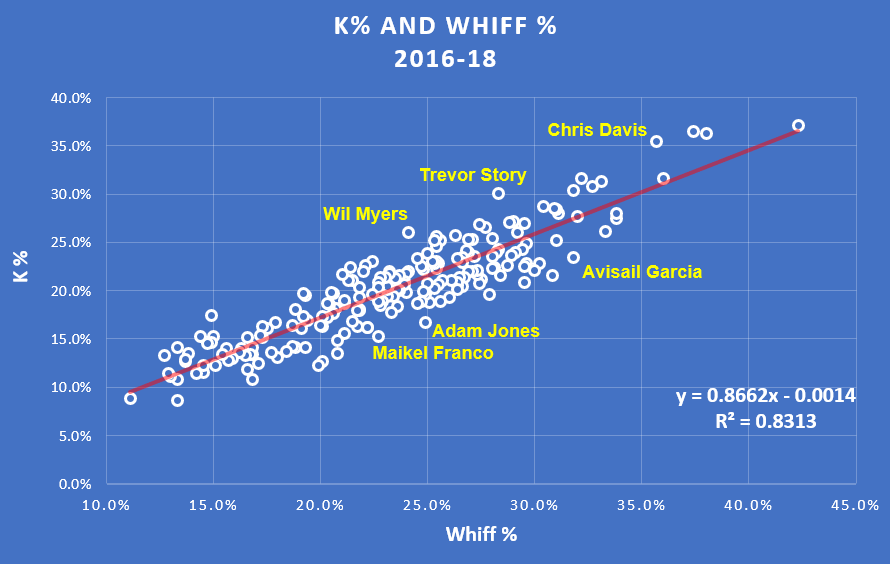
To reiterate Dave’s findings: Contact rate, or its reciprocal whiff rate, is the top dog when it comes to predicting strikeout rate. In a sample of 204 hitters that eclipsed 1,000 plate appearances and 2,000 swings from 2016 to 2018, the R2 coefficient between whiff rate and strikeout rate was a robust 0.83 (values closer to 1.00 indicate a strong relationship). That line of best fit has a slope of about 0.87, which means that for a 1.00% increase in whiff rate, strikeout rate is expected to increase by about 0.87%.
Committing this to memory is important. Often analysts will reference movements in swinging strike rate or outside swing rate as indications that a hitter’s underlying plate discipline has changed. While these metrics have value, and perhaps are better at explaining a stat like walk rate, they are inferior when it comes to predicting strikeout rate. For instance, the R2 for swinging strike rate and strikeout rate is 0.62, indicating a correlation significantly lower than that of whiff rate, while there is no discernible relationship between outside swing rate and strikeout rate.
But while whiff rate is a strong precursor to strikeout rate, its predictive power doesn’t hold for all players. Notice the dots located either significantly above or below the trend line in the graph. Those featured above, highlighted by Wil Myers, Trevor Story, and Chris Davis, are players who strike out more than their whiff rate would suggest. The ones below, earmarked by Maikel Franco, Adam Jones, and Avisail Garcia, strike out less than expected (Note that predicted strikeout rate was determined by plugging the player’s whiff rate as the x variable in the y = 0.8662x – 0.0014 formula found in the graph above).
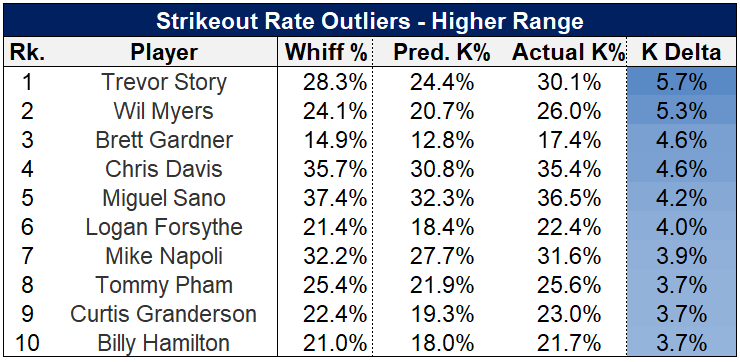
Both Story and Myers are interesting cases, as their actual strikeout rates are more than 5.0% higher than their predicted levels. Other names in the elevated strikeout outlier range include Brett Gardner, Miguel Sano, Logan Forsythe, and Tommy Pham.
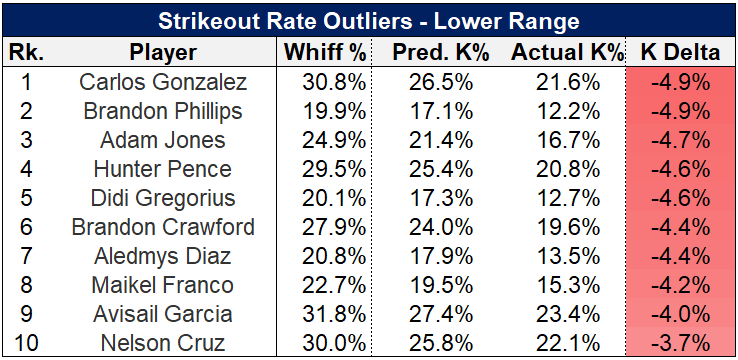
Franco, Jones, and Garcia are joined by Carlos Gonzalez, Brandon Phillips, Hunter Pence, Didi Gregorius, and Nelson Cruz as players capable of outperforming their whiff tendencies, often by 4.0% to 5.0%. For perspective, cutting strikeout rate by 4.5% adds an additional 30 balls in play or walk opportunities for a hitter per season.
Swing Away, Avisail
The first step in evaluating why these differences exist is to start simple: Examine a player’s swing rate, which is calculated as swings divided by total pitches.
Dave showed in his article that swing rate doesn’t exhibit a relationship with strikeout rate on the whole. But it does have a significant effect on why certain players over or underperform their expected strikeout rate. The graph below compares the relationship between swing rate and K Delta, which is the difference between a player’s whiff-predicted strikeout rate and their actual strikeout rate.
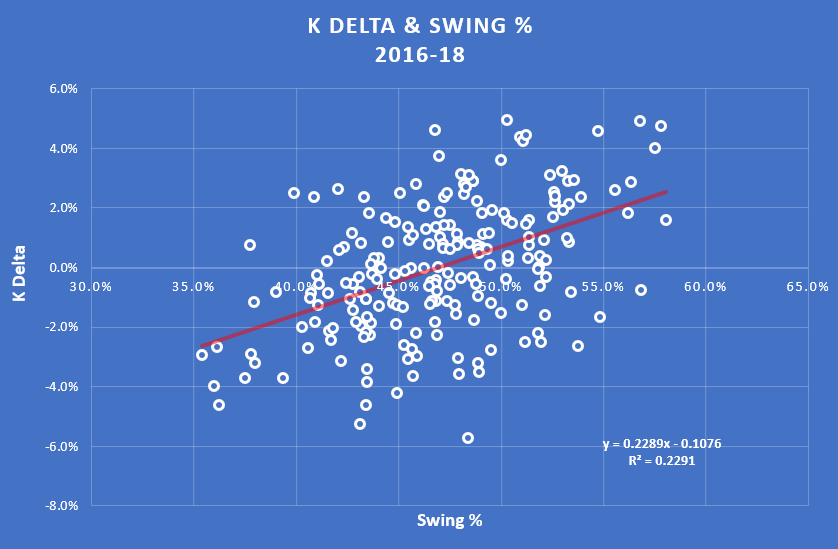
The R2 of 0.23 shows that swing rate explains an appreciable portion of the variance in K Delta, with the impact being extremely relevant in the outlier cases presented above.
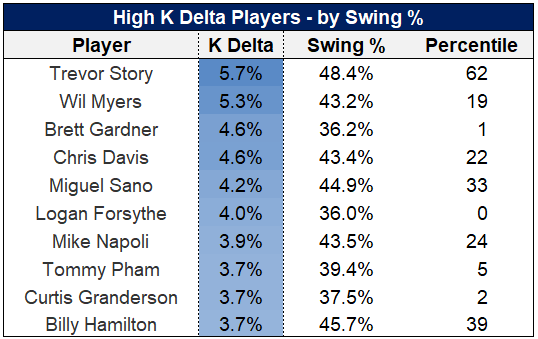
Of the 10 highest K Delta players, four exhibited a swing rate in the fifth percentile or lower, while nine were in the 39th percentile or lower. Trevor Story is the only player that exhibited a swing rate above that level, coming in the 62nd percentile. The average swing rate for the group was 41.8%—well below the MLB average of 47.0%.
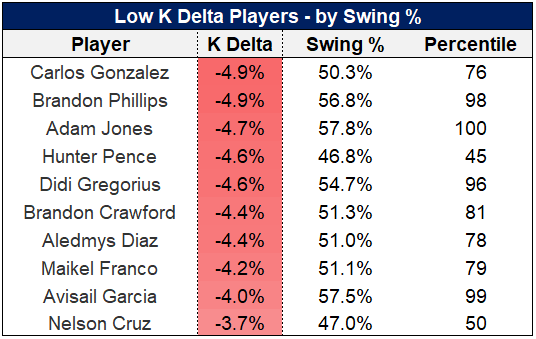
A similar relationship is present among the lowest K Delta players. Four rank in the 96th percentile or higher in swing rate. Eight eclipse the 76th percentile. The only two hold outs, who both possess roughly average swing rate levels, are Pence and Cruz. The average swing rate for the group was 52.4%.
Players that swing more possess two distinct advantages in avoiding strikeouts. First, they put more balls in play earlier in counts, which avoids the prospect of two strikes and subsequently strikeouts. Second, they are less apt to take a called third strike.
This doesn’t necessarily mean swinging more is better. It simply means that, for a given whiff rate, a higher swing rate results in fewer strikeouts. While that is a good result, it could be counteracted by a variety of factors, included lower batted ball quality. This will be explored in a future post.
Whiff Diff
Swing rate is important. But there is still another primary variable that determines strikeout rate: “whiff diff.”
Whiff diff is a moniker I coined for the difference in a player’s whiff rate in different count states, particularly between 0-0 and two-strike counts. The underlying theory is that certain players might apply a more aggressive swing approach earlier in counts, leading to elevated overall whiff rates, but improve their contact abilities with two strikes, which is the imperative state for earning or avoiding strikeouts.
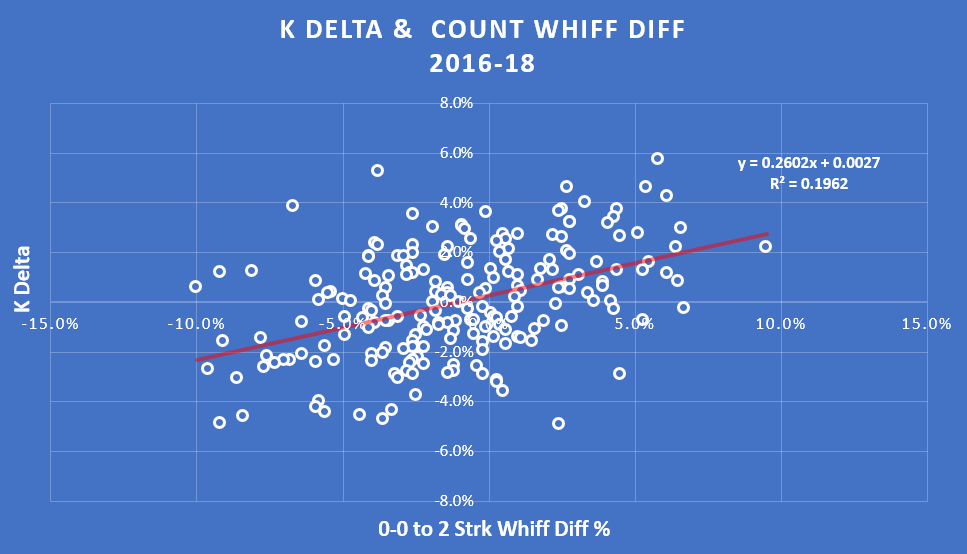
Sure enough, this seems to be the case, with whiff diff between 0-0 and two-strike counts explaining 20% of the variation in K Delta.
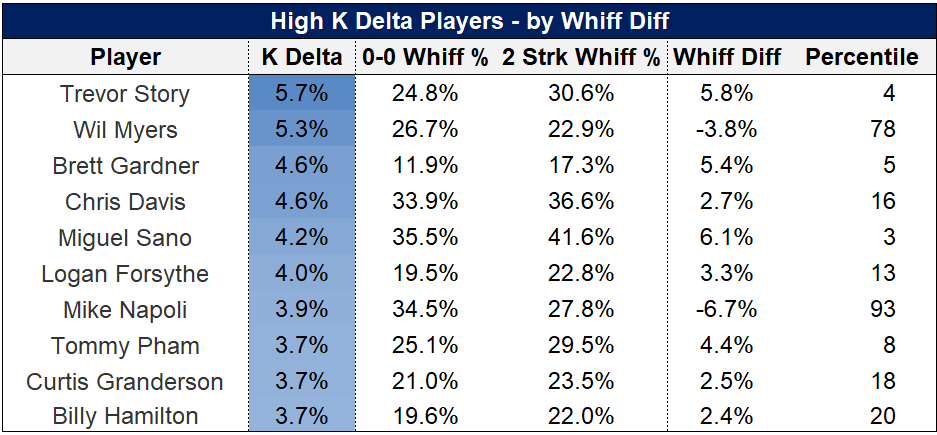
Story’s whiff diff rate of 5.8% is one of the highest in baseball, ranking in the lowly fourth percentile. This means that Story’s ability to make contact deteriorates significantly with two strikes: a trait that is likely driving his league-leading K Delta.
Four of the top 10 in K Delta rank in the eighth percentile or lower in whiff diff, with eight of the 10 ranking in the 20th or lower.
Now we’re starting to paint a real picture of why most of these players exceed their strikeout rate. If they swing less, and thus put fewer balls in play earlier in counts and take more called third strikes, while also whiffing more with two strikes, then their strikeout rates will be higher than expected.
Myers and particularly Napoli are the whiff diff outliers; however, note that both of these players possessed swing rates in the 24th percentile or lower.
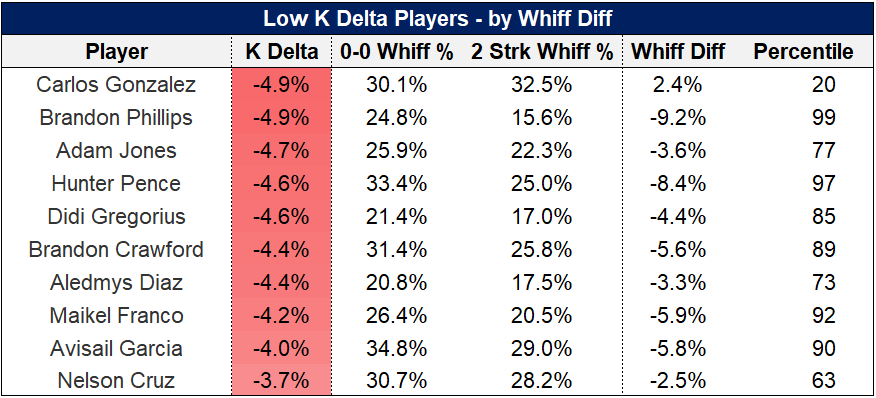
Six of the highest K Delta players scored in the 85th percentile in whiff diff, while only one player ranked below the 63rd percentile. This means that these players significantly improved their whiff rate when the count reached two strikes.
The case of Brandon Phillips is particularly interesting, whose whiff rate declined from 24.8% in 0-0 counts to 15.6% with two strikes, a massive 9.2% drop. Pence exhibits a similar decrease, moving from 33.4% to 25.0%.
The exact mechanisms behind this phenomenon are unclear. Are these players actually better with two strikes than other players, or is their early count approach just overtly aggressive and their two-strike approach more reflective of their baseline skill? These are questions that will be explored in a subsequent article.
Recent Applications
The above analysis utilized data from 2016-18 with a minimum threshold of 1,000 plate appearances and 2,000 swings. While that type of robust data set is necessary for establishing a strong theoretical foundation, it also excluded many players who have become relevant fantasy assets over the last year. As a result, let’s survey some interesting names based on their performance from the start of 2018.
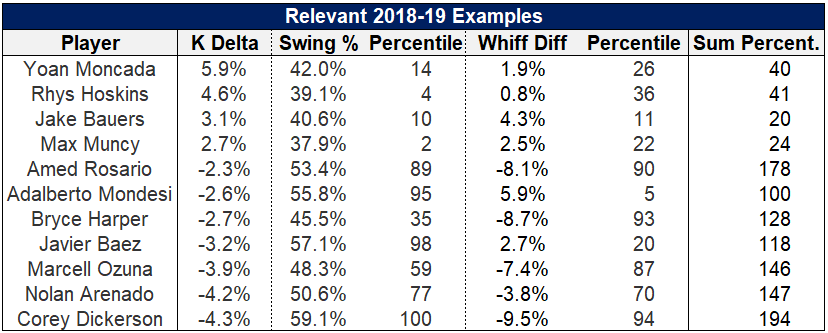
Yoan Moncada, who was absent from the 2016-18 data set because he didn’t hit the plate appearance threshold, is near the top of the league in K Delta since the beginning of 2018. Moncada’s 14th percentile swing rate along with 26th percentile whiff diff is the perfect elixir for more strikeouts than anticipated.
Phillies slugger Rhys Hoskins, along with Dodgers first baseman Max Muncy, are in a similar boat, with microscopic swing rates that reduce their early-count balls in play and drive the count to two strikes, thereby resulting in increased strikeouts relative to whiffs.
Jake Bauers, despite a sluggish start to his MLB career, is a favorite of many in the analytics community. While his reduced whiff rate could be interpreted as a sign of growth at the plate, but perhaps expectations should be tempered given his low swing rate and elevated whiff diff.
Mets shortstop Amed Rosario owns one of the highest summed percentiles of swing rate and whiff diff in baseball at 178, indicating he has the plate approach to consistently outperform his whiff rate.
Adalberto Mondesi is an interesting case, combining a sky-high swing rate with one of the highest whiff diff marks. Thus far he has managed to stay afloat with a strikeout rate in the 27% range, but I wouldn’t be surprised to see it tick up if he can’t improve his two-strike approach. Javier Baez is cut from the same cloth, swinging at nearly everything and aiming for hard contact early in the count.
Bryce Harper, as I noted in my article on the relationship between whiffs and barrels, is trading swing-and-miss for hard contact over the last several seasons. Fortunately, he is taking that aggressive approach earlier in counts, with a -8.7% whiff diff that settles in the 93rd percentile.
The contact breakout that Corey Dickerson experienced in 2018 is further supported by his 100th percentile swing rate and 94th percentile whiff diff.
Conclusions
Whiff rate is the primary driver behind strikeout rate. However, whiff rate should be viewed in conjunction with a player’s swing rate and whiff diff metrics to gain a more accurate picture of their baseline strikeout rate. Understanding these stats is particularly important for younger players whose major league strikeout rate isn’t firmly set in stone. Moreover, they are useful in understanding if short-term volatility in whiff rate or strikeout rate is related to a real underlying change in approach.
Featured Image by Justin Paradis (@FreshMeatComm on Twitter)
