


Joey Gallo was really good in 2019. He seemingly broke out and was emerging as a legit star right up until he broke a hamate bone, had surgery, and missed the second half of the year. But in 2020, like so much else in this unique year, Joey Gallo was bad. Other than his cups of coffee in 2016 and 2017, his 2020 was his worst year by average, on-base, slugging, ISO, and HR (even after pro-rating for the shorter season). He went from being 44% better than a league-average hitter (144 wRC+) to 23% worse (77 wRC+).
With Gallo, everything comes back to the three true outcomes. In that breakout 2019, 63.3% of Gallo’s plate appearances ended in a strikeout (38.4%), walk (17.5%) or home run (7.4%). No one else with over 250 PA was close – Miguel Sano was second at 56.4%.
In 2020, he was still near the top (5th) in three true outcome rate, but his rate of three true outcomes fell to 52.2%. The problem was how it fell – he struck out slightly less (35%), but he walked and homered a lot less (12.8% and 4.4%, respectively). The walk rate mostly appears to be a return to form – his career walk rate coming into 2019 was 13.4%; compared to that, 2020 looks like the outlier, not 2020. So Figuring out what went wrong for Gallo in 2020 (and what could go right in 2021) starts with strikeouts and home runs.
Strikeouts
Yes, Gallo did strike out less in 2020, but not a ton less, and he was still 4th in MLB in K% among qualified hitters. Strikeouts are, more or less, made up of things a batter can control (how often they swing, what they swing at, and whether they make contact) and things a batter can’t control (where pitches are thrown). We’ll come back to the latter, but at first glance, there are some good things in the former.
In 2020, Gallo posted a career-low chase rate, swinging at only 22.7% of pitches outside the zone. For context, in 2018, Gallo swung at 32.2% of pitches outside the zone, tied for the 78th best rate out of 140 qualified hitters. He dropped that rate to 24.2% in 2019, and in 2020 his 22.7% was 15th best out of 143 qualified hitters. He didn’t have a chasing problem, per se, but he went from just outside the top half to one of the most patient hitters in the game.
He also increased his contact% in 2020, posting a career-high 63.5%, mostly because he chased less and because he made more contact when he did chase (his o-contact% increased from 35.8% to 42.1%, while his z-contact% took a non-problematic drop from 73.1% to 72.3%). Not surprisingly, if you chase less and make more contact, you are going to swing through fewer pitches and, sure enough, Gallo posted a career-best 15.8% swinging-strike rate. In fact, Gallo has posted a career-best swinging-strike rate every year of his career:
| Year | Swinging-Strike Rate |
| 2015 | 22.6% |
| 2016 | 22.1% |
| 2017 | 19.2% |
| 2018 | 18.4% |
| 2019 | 16.2% |
| 2020 | 15.8% |
The bad news is 15.8% was still the 13th highest rate in baseball. In 2015, 2016, 2017, and 2018, his swinging-strike rate was higher than any qualified hitter in baseball. In 2019, only four qualified hitters posted a higher one. He went from outlier-bad to just normal-bad, and that is progress. Remember, outlier bad Gallo put up 119 and 108 wRC+ in 2017 and 2018.
If Gallo made such obvious and meaningful improvements in the areas he can control, why didn’t his K-rate drop more? Pitchers came in the zone a lot more often. From 2017-2019, among 234 hitters with 1,000+ PA, Gallo faced the lowest zone% in all of baseball at 37.7%. But in 2020, his zone% increased to 44.4%, almost 7 points higher than his 2017-2019 run. He had the ninth highest zone% in all of baseball.
Alex Fast has popularized the stat CSW for pitchers (Called Strikes + Whiffs), and when we look at a hitters swinging-strike rate, we are capturing the “Whiffs” portion of that, but not the “Called Strikes.” Gallo’s 2020 plate discipline looks less promising with this lens:
| Year | 2017-19 | 2020 |
| Zone% | 37.7% | 44.4% |
| Z-Swing% | 72.3% | 69.8% |
| Called Strikes | 10.4% | 13.4% |
| Whiffs | 18.3% | 15.8% |
| CSW | 28.7% | 29.2% |
That really helps to tell the story of Gallo’s year. He chased less, he swung through fewer pitches, but he saw a lot more pitches in the zone. He was more passive against those pitches, and he paid for it.
Why Pitchers Challenged Gallo
As noted above, Gallo’s zone percent was way up in 2020, and his first strike percentage increased as well. He was behind more often and seeing more strikes and fewer balls in general. If Gallo suffered in part because pitchers challenged him more, it’s natural to wonder why pitchers got more aggressive with him.
There seem to be two possible explanations. I looked at all qualified hitters from 2018-2020 and compared zone% to a number of other stats and the stats with the strongest correlation to zone% were those that measure patience and those that measure power.
| Stat | Correlation to Zone% |
| FB% | .517 |
| SwStrk% | -.414 |
| HR/FB | -.414 |
| Barrel% | -.411 |
| MaxEV | -.390 |
| Contact% | .389 |
| ISO | -.366 |
| O-Swing% | -.348 |
| Z-Swing | -.313 |
| HardHit% | -.312 |
There are a couple of outliers up there, but they are easily explained. Fastball% is, in some ways, measuring the same thing as zone% – how often does a pitcher just straight-up challenge a hitter. Based on the same data, pitchers throw the most fastballs to players with low barrel rates, low HR/FB rates, and low contact rates.
Contact rate, in the meantime, tends to correlate with low power. Players with low contact rates tend to also have low HR/FB rates, low max EV, few barrels, and few hard-hit balls.
None of this is surprising – pitchers stay outside the zone to two types of hitters: ones who scare them with their ability to destroy baseballs and ones who are likely to chase. Looking at the bottom ten hitters in zone% from 2017-2019, you see free swingers like Javier Baez (44.9% chase rate) and Salvador Perez (48.2% chase rate) and boppers – Giancarlo Stanton, Aaron Judge, Gary Sanchez, and even some guys who are not Yankees like Bryce Harper and Nelson Cruz. Gallo is well known for a) prodigious power and b) a swing with a hole in it, so pitchers historically working around him isn’t shocking.
But in 2020, Gallo reduced his whiff and chase rates to a career-low. He became less likely to chase, which basically forced pitchers to come in the zone more, and they did.
This should be a good thing for Gallo. Take one bat with otherworldly power, add more hittable pitches, mix well, and boom! More home runs! Except, Gallo’s power dried up.
Where Did the Power Go
He looks just plain weak compared to his 2019 breakout, but even if we smooth that out with his 2017-19 data, 2020 looks bad.
| Stat | 2017-19 | 2020 |
| HR/PA | 0.073 | 0.044 |
| HR/FB% | 30.3% | 16.7% |
| ISO | .316 | .197 |
So Joey Gallo, feared power hitter, became more patient and the power just… vanished.
One possible explanation is that he left the power in Globe Life Park when the team moved to Globe Life Field. The Park was a well-known launching pad, while the Field appears to suppress power. In fact, by at least one measure (ESPN’s 2020 Park Factors), it was the least HR-friendly park in baseball.
But we’re talking about 30 games. For something like park factors, that is probably somewhere between 10% and 15% of the sample we need to have any confidence. This is something to watch – if Globe Life Field continues to play like it’s predecessor’s evil twin, that might be cause for concern.
In addition, Gallo’s power didn’t just dry up at home. The drop was more precipitous at home, but it’s clearly there on the road, too. His 2020 HR/FB rate at home was 15.6% vs. 30.8% for his career; on the road, he was at 17.9% vs. 25.7% for his career. His home ISO was .202 vs. .322 for his career; on the road, he dropped from .260 for his career to .192 in 2020. The bigger drop at home might be something, but it’s not everything.
Maybe Gallo just got unlucky? Short season, small samples, maybe he mashed and ran into some stiff winds, unlucky placement, etc.? Let’s go back to that table showing his lost power vs. 2017-19 and add a few rows.
| Stat | 2017-19 | 2020 |
| HR/PA | 0.073 | 0.044 |
| HR/FB% | 30.3% | 16.7% |
| ISO | .316 | .197 |
| Avg EV | 94 | 91.2 |
| Max EV | 117.5 | 113.5 |
| Barrel% | 22.4% | 14.0% |
| Hard Hit% | 51.3% | 43.9% |
He wasn’t just unlucky – he hit the ball a lot less hard.
It’s important, though, to note that “less hard” and “not hard” are not the same. Gallo posted a 75th percentile hard-hit rate, 85th percentile average exit velocity, and 90th percentile barrel rate. It’s pretty telling that what looks like a much weaker Gallo is still a batted ball profile most hitters would kill for.
The problem is, with the 5th percentile whiff rate and 3rd percentile strikeout rate (yes, even with his 2020 improvements in those areas, he is still among the worst in the game), Gallo needs truly elite power to be effective.
So what caused Joey Gallo to go from JOEY GALLO to Joey Gallo? Every player eventually succumbs to age, but having just turned 27 after the season, it seems unlikely that is the culprit.
Gallo did have two injury/illness-related issues this year that could contribute. In early July, as players were getting into “Summer Camp,” Gallo was one of the players with a confirmed positive COVID test. Within about a week, though, he had also had two negative tests and was unsure if he actually caught the virus or had a false positive. He says he was asymptomatic. That said, we know that COVID has a tendency to drain energy and other players felt the effects all season. It’s certainly possible that Gallo was just working at a lower energy level from the get-go.
In early August, Gallo took a day off due to a sore right wrist that had started bothering him earlier that week. This was particularly concerning, given that his 2019 was cut short due to surgery on that same wrist, though the Rangers said the 2020 soreness and 2019 surgery were unrelated. Gallo only missed three games all year, so whatever soreness he felt didn’t keep him out of the lineup, but perhaps he was playing through pain? Or even just weakness?
Neither of those explanations are clear smoking guns, but they are both realistic explanations for a well-known power hitter suddenly seeing power dry up.
And there is further evidence that Gallo might have either run out of energy or struggled with wrist discomfort. Check out this graph of rolling 20-game stats.
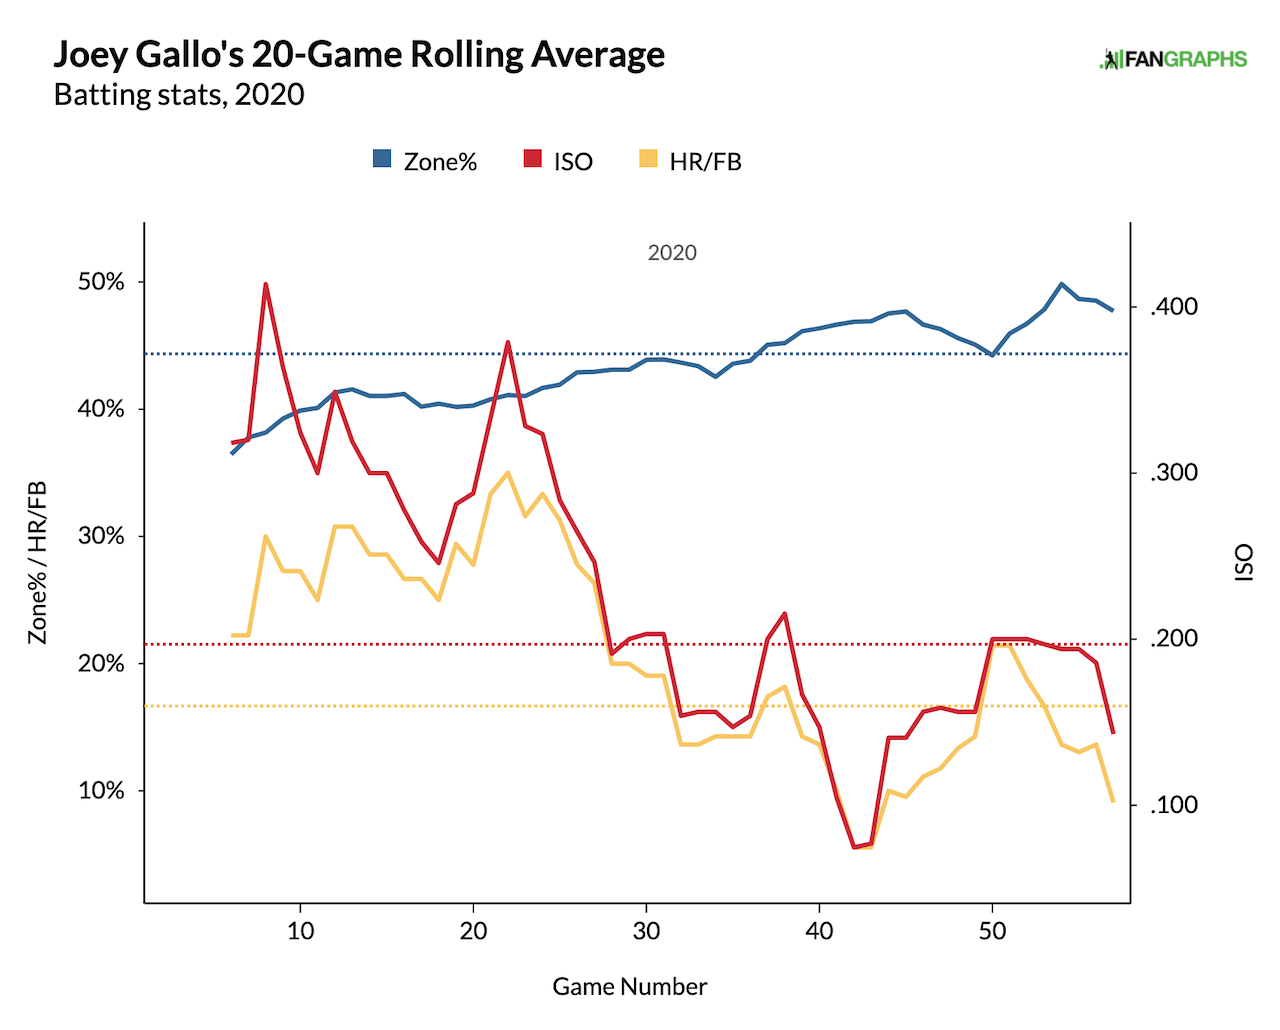
Data and image from FanGraphs
Gallo started the season with his ISO up over .300 and HR/FB rate around that 30% mark we had seen from him before. On 8/2, his ISO peaked and started a downward slide. His HR/FB rate peaked a bit later (8/19), but the downward trend really started on 8/8. So on 8/7, Gallo took a day off based on wrist soreness that started a few days earlier. A few days earlier, his ISO started to drop, and at that same time, his HR/FB rate started to drop. From the chart below, you can see his hard-hit percentage tailed off around the same time, though it came back late in the year.
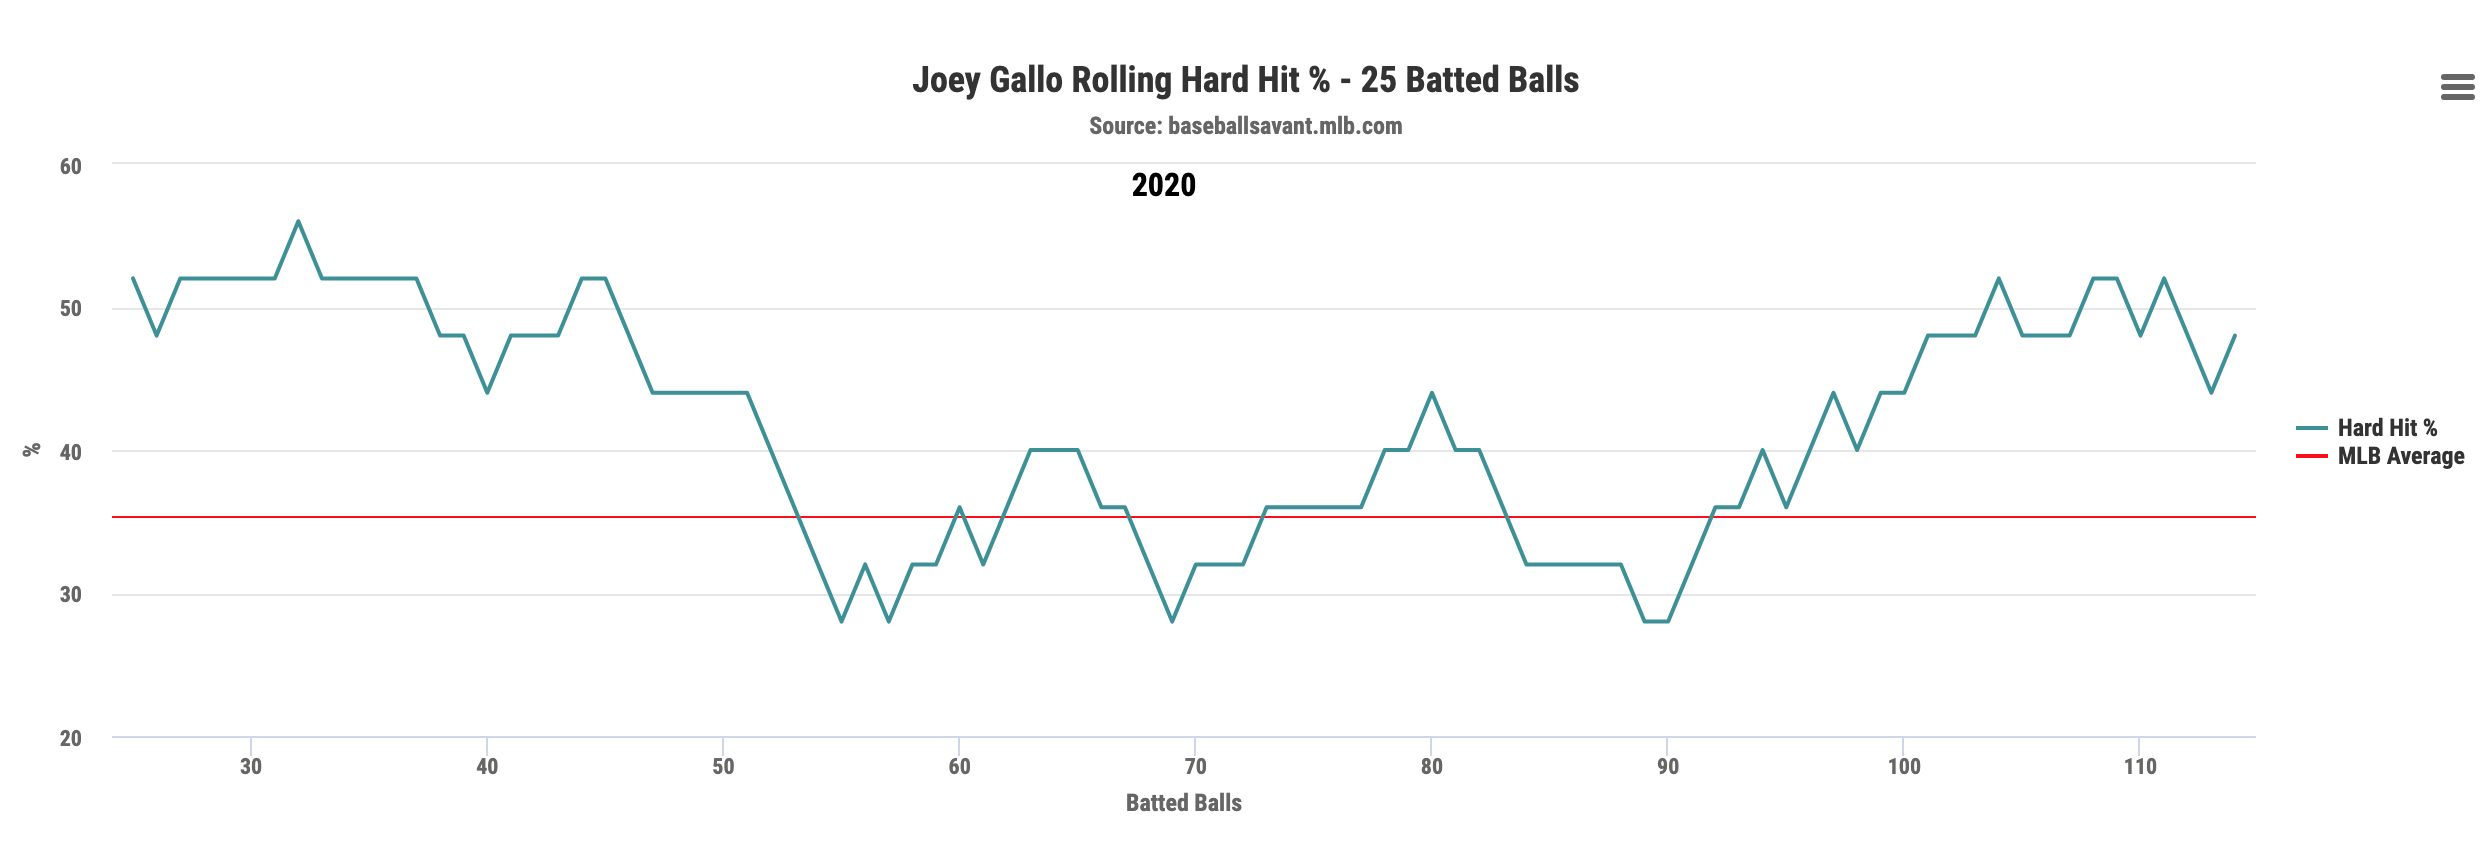
Data and image from Baseball Savant
If you go back to the first graph, you can see there is a line for zone percent, as well—that was left on there because you can actually see pitchers adjusting to him. He started the year with sub-40%, as we had seen in the past. In early August, his power starts to fade and the number of pitches in the zone starts to rise, and by the end of the year, he’s getting close to 50% of pitches in the zone.
So the stadium could be an issue, but we don’t really have enough data to be sure; medical issues might be part of the problem, but we only have circumstantial evidence of that. But what if his improved plate discipline is actually to blame for the decrease in power?
His improved plate discipline really started in 2019, so here are heat maps comparing Gallo’s swing percentage from 2015-2018 to 2019-2020:
Data from FanGraphs; GIF created at imgflip.com
You can see some pretty clear differences. First of all, almost every zone shows a lower swing percentage. If you look middle-middle, you can see the four middle zones went from 82%, 84%, 80%, 78% to 78%, 77%, 76%, 76%. Maybe not a huge shift, but he’s clearly being more patient, even on those pitches.
On pitches up, he is being much more patient across the board. Same with pitches off the plate in both directions. Pitches down and in, he is being more patient, while pitches down and away he is still chasing—think about a curveball that dives away from him, like this one:
Those pitches have always been a problem for Gallo and he doesn’t seem to be laying off those as much as other pitches. The problem is, the other pitches he is laying off may not be as valuable to lay off:
Data from FanGraphs, GIF created with imgflip.com
You can see there that his SLG on a per pitch basis is really bad on those pitches down and away, while his patience on pitches down and in has improved his performance. But the pitches up that he is laying off? The pitches away that he is laying off? Those middle-middle pitches? He was performing better when he attacked those, thanks to his power. When he could lift those pitches up or extend his arms on pitches away, he was hitting them hard. So it might be that his increased selectivity is having a downward impact on his power because of which pitches he is laying off (and which he isn’t).
Check out this pitch, up and a bit and over the plate 2018.
In 2015-18, he was swinging at about 70% of pitches in this spot; in 2019 and 2020, he was swinging at about a third of them. You can argue that isn’t a good pitch to swing at, given how high it is, but check out those two middle-up zones in the slugging heat map GIF above – he was much better in this zone when he was taking cuts, probably because he’s a big strong dude who can mash balls like that one! That said, check out these heat maps, which compare ISO on balls in play, rather than per pitch:
Data and images from FanGraphs; GIF created at imgflip.com
Even when he makes contact, that contact is (as we saw from the Statcast data) less impressive. So the newfound-patience might not be negatively impacting his power output, but—like the park and like the health—it is not the only issue.
What Do We Do With All of This?
What this all suggests to me is that there are two things at play and they are only semi-related:
- Gallo has drastically improved his plate discipline year of year, throughout his career. He is forcing pitchers to come into the zone more, he is striking out less, and this should, in general, be a good thing. We saw this be a good thing in 2019. Changes like that start to stabilize relatively quickly and the changes he made in 127 2019-20 games vs. the previous years are legit.
- Gallo had a massive power outage in 2020, which might be related to item #1, but not significantly. More likely, his new park isn’t as power-friendly as his old one, and a combination of injuries and health-related issues sapped his power. Plus, we are talking about 226 PA over 57 games, which is not a huge sample. This mostly feels temporary. His hard-hit rate was already starting to climb back up, there are a number of explanations (wrist, COVID, short-season sample size) to explain why his power would disappear, and none of them are causes for long-term concern. Things aren’t all rosy—the stadium issue might be real and it is entirely possible he has over-corrected on his plate discipline—but I find it hard to believe Gallo just stopped being one of the most powerful hitters in the game based on this year of all years.
I don’t expect he’ll improve on, or even return to, what he did in 2019, but if you combine his 2019 and 2020, you get 127 games, 32 HR, and a 115 wRC+. That is pretty much in-line with what he did in 2017-2018, and I suspect that is a relatively conservative estimate of what he’ll do in 2021.
However, if he can continue to adjust his approach, there is potential for a lot more.
That said, it seems like I might be alone in expecting Gallo to return to form. In 2019, Gallo’s ADP per NFBC was 97; in 2020, it was 86. In early NFBC drafts, his 2021 ADP is 169. If I told you before 2019 that we were going to see a new Gallo, with much better plate discipline, chasing less, whiffing less, striking out less, and that those changes would stick through 2020, you would be buying aggressively, particularly in keeper and dynasty leagues. Instead, his price has plummeted based on a 57 game sample in which his power dried up but all those plate discipline gains stayed. This feels like a major overcorrection based on a small sample size season in which nothing was normal, possibly including Gallo’s health.
In keeper/ottoneu/dynasty leagues, I am buying Gallo. In redraft or leagues where he is tossed back into the pool, I am jumping that 169 ADP by a lot. Per NFBC, there is a run of OF going from 112-116 (Kyle Lewis, Byron Buxton, Eddie Rosario, and Tommy Pham, with Matt Chapman in between them). I would rather have Gallo than any of those OF, and if it’s an OBP league, you can bump him up even further.
Photo by John Cordes/Icon Sportswire | Adapted by Justin Redler (@reldernitsuj on Twitter)
