


It’s October 3rd, 2021. Oakland is on the last day of the regular season, facing the Houston Astros at Minute Maid Park. The Athletics are first in their division, thanks in part to their usual “One for All, and All for One” approach, typical of small-market teams and the longtime blueprint for the A’s, even after Billy Beane’s departure.
But there is something different this year because one player has contributed so much. Matt Olson and his MVP-caliber season have carried the team on his shoulders and doesn’t seem to be stopping soon.
Fast Rewind to the End of 2020
Olson has just finished what, by most accounts, could be called a bittersweet year. The COVID-19 sprint-season saw him end as the A’s leader in HRs (14) and RBI (42) and near the top in runs scored (28) and slugging (.424). At the same time, he had the worst batting average of the team’s qualified hitters (his .195 average was also sixth-worst in all MLB), was near the bottom of the Oakland roster in OBP (.310), and had the most strikeouts (77); bittersweet indeed.
All in all, his final line for the season was .195/.310/.424, good for a 103 wRC+ with a .316 wOBA and a 0.8 WAR.
In his short tenure as the A’s regular first baseman, Olson hasn’t shown that he is a great contact hitter, batting just .259, .247, and .267 in the previous three seasons (2017-2019) and has always been on the high side of strikeouts with 60 in 2017 (59 games), 163 in 2018 (162 games), and 138 in 2019 (127 games). In his 60 games in 2020, he struck out 77 times, which projects to more than 200 in a “normal” season.
| Season | AB | HR | AVG | K% | BB% | BABIP | wOBA | wRC+ | fWAR |
|---|---|---|---|---|---|---|---|---|---|
| 2017 | 189 | 24 | 0.259 | 27.8% | 10.2% | 0.238 | 0.411 | 164 | 2.1 |
| 2018 | 580 | 29 | 0.247 | 24.7% | 10.6% | 0.292 | 0.340 | 118 | 3.5 |
| 2019 | 483 | 36 | 0.267 | 25.2% | 9.3% | 0.300 | 0.368 | 134 | 3.9 |
| 2020 | 210 | 14 | 0.195 | 31.4% | 13.9% | 0.227 | 0.316 | 103 | 0.8 |
| Career | 1483 | 103 | 0.245 | 26.1% | 10.8% | 0.277 | 0.353 | 126 | 10.1 |
As you can see in the table, Olson had a career year in 2019, with very respectable HR, wOBA, wRC+, and fWAR numbers. This is why his dive in 2020 raises so many eyebrows.
His lack of contact, reflected in his batting average and in his 31.4 K%, ranked him ninth-worst overall for qualified MLB hitters. However, I’m not worried at all about his strikeout rate, to be honest. We will circle back to that later because it shouldn’t distract us from what Olson’s core ability is.
| Season | Hard-Hit% | Barrel% | Max EV | Avg EV | Avg LA | StdDev of LA (°) | DHH% | Q |
|---|---|---|---|---|---|---|---|---|
| 2017 | 50% | 14% | 111.0 | 92.3 | 14.90 | 31.6 | 22.2 | 0.703 |
| 2018 | 52% | 12% | 113.3 | 93.3 | 16.90 | 30.1 | 21.5 | 0.715 |
| 2019 | 49% | 14% | 111.9 | 92.8 | 17.30 | 29.3 | 25.1 | 0.856 |
| 2020 | 46% | 13% | 112.5 | 92.3 | 19.70 | 28.8 | 27.1 | 0.940 |
As you can see above, Olson’s hard-hit rate (HH%) has dropped to its lowest of the last four seasons while his maximum and average exit velocities (EV) have remained stable. The latter was in the top 9% for the league in 2020, according to Statcast.
The problem of trying to heavily value HH% is that, because of its static nature of treating every batted ball event (BBE) separately from its launch angle (LA), it under-represents balls hit at wider angles (higher than 50°, lower than -30°) that require a huge amount of power to reach their final EV. On the other hand, HH% over-represents those balls hit at the best possible angles (around 20-30°), which maximizes said power usage.
This is where DHH% fills in the gaps. Dynamic Hard-Hit rate is the creation of Connor Kurcon. Basically, it takes a different approach on how we should classify what accounts as a hard-hit ball, knowing that the threshold should not really be linear (greater than 95 mph EV), as is defined. Instead, the threshold should vary (hence the dynamic part) following a parabolic shape depending on the LA at which the ball was hit.
The following graph is helpful to portray how the categorization of a hard hit ball according to DHH% works. In blue is the maximum EV for every BBE for every launch angle in 2020. The theoretical threshold for the hard-hit balls is in orange. Every single BBE over the orange line is considered a hard hit. The Y-axis is in miles per hour, the X-axis in degrees.
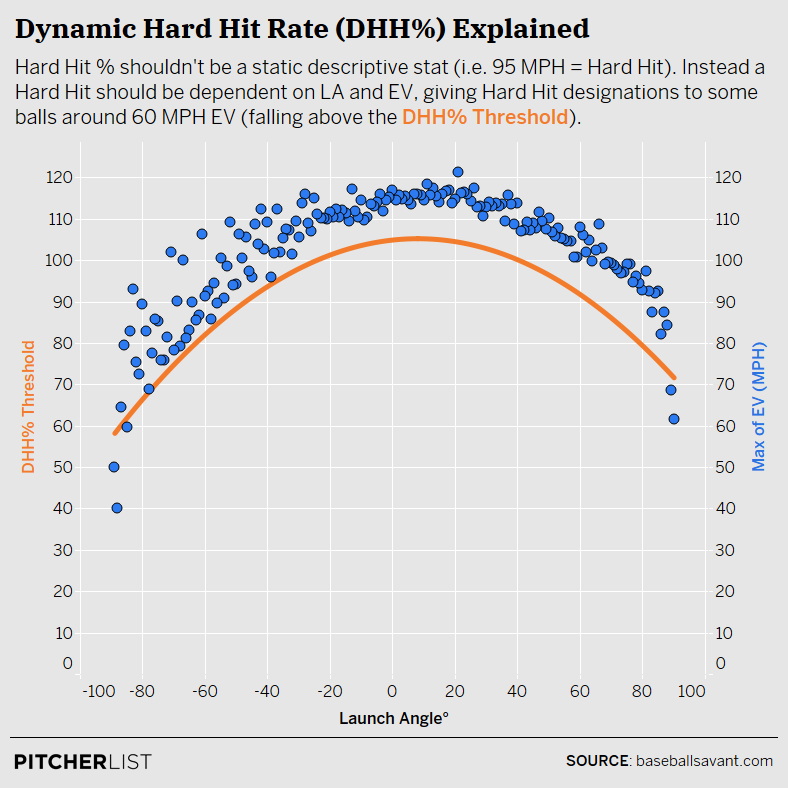
Data Visualization by @Kollauf on Twitter
So what’s the benefit of using DHH% instead of HH%, besides getting a better representation of the batter’s power (or lack of)? Well, as Connor demonstrated in his article, it correlates really nicely to the hitter’s wOBAcon for the following season. In fact, DHH% is consistently better than HH% and xwOBAcon at predicting the following year’s wOBAcon.
In Olson’s case, we can see that his DHH% has been trending upwards season after season. That’s pretty much consistent with what you would naturally expect from a power batter entering his prime years (he is going to be just 27 in 2021). This consistent rise in DHH% is encouraging, and there are few things that aid BBE success more than hitting the ball hard. In that regard, only three players with at least 110 BBEs had a higher DHH% than Olson’s 27.1% in 2020: Joey Gallo (34.2%), Teoscar Hernández (29.69%), and Marcell Ozuna (28.4%).
This by itself is excellent news for Olson, but it still isn’t the whole story, as usually happens in baseball. Gallo, for instance, has led the league in DHH% since 2017 but has never produced a season with a higher fWAR than Olson’s 3.9 in 2019.
There are a few reasons for Gallo’s lack of a truly memorable season for the Rangers, but the most notable is Gallo’s atrocious lifetime K%. He has never had a season with a K-rate under 35, and his career average is 37.6. He is usually near the MLB-worst in that category.
But wait, didn’t we establish earlier that Olson is just out of a terrible season, the worst in his short career, in terms of K%? Absolutely, but we’ll still look at it a little later; before that, let’s work through the other reasons I’m highly confident about his future performance:
| Season | LD% | GB% | FB% | Avg LA | StdDev of LA (°) | DHH% | Q |
|---|---|---|---|---|---|---|---|
| 2017 | 16% | 38% | 46% | 14.90 | 31.6 | 22.2 | 0.703 |
| 2018 | 21% | 36% | 43% | 16.90 | 30.1 | 21.5 | 0.715 |
| 2019 | 24% | 31% | 45% | 17.30 | 29.3 | 25.1 | 0.856 |
| 2020 | 21% | 35% | 44% | 19.70 | 28.8 | 27.1 | 0.940 |
Alex Chamberlain introduced the concept of Launch Angle Tightness, Sd(LA), which is calculated as the standard deviation of all launch angles a batter had for his batted-ball events and explains how narrow or wide bat control the hitter has in terms of the variance of his LAs. Simply put, how often is the batter close to his average launch angle.
If you want to take this explanation a little further, think of it as, in terms of launch angle, the capability the batter has to routinely repeat his swing as close to the same path as possible. If he does it as near as possible to an appropriate LA and hardness of hit, his chances of success dramatically improve. These are consistently good swings along a similar, successful bat path.
Alex found that Sd(LA) is correlated to BABIP and that a smaller value is typical of great batters. Through 2020, you would find Joey Votto, Freddie Freeman, and Miguel Cabrera among all-time leaders. That makes sense when you consider it as a representation of consistency while swinging.
How Does This Affect Olson?
Olson doesn’t have the tightest Sd(LA), for sure, but he has gradually reduced it year after year, from 31.6° in 2017 to 28.8° this season. That shows that Olson is on a path to better bat control (by means of a consistent LA) and, as important as that, he’s been raising his average LA from 14.90° to 19.70° in that same period. He reaches a sweeter spot with more regularity, helping him to longer distances on his line drives and fly balls, meaning more extra-base hits (including homers, of course).
Reducing LA tightness is, as we’ve just seen, very important, but increasing DHH% is also key. Hitting for power helps on multiple levels, as hitting the ball hard is a skill that frequently rewards the batter. Discerning which percentage of the BBEs are really hard-hit allows for a better batter evaluation.
Keeping all this in mind, and, as we want the highest DHH% and the “tightest” (lowest) possible launch angle standard deviation, I used this relationship as an easy way to find out players with potential. This prompted me to devise and use a very simple formula called Q (for Quotient). This expression states:
Q=DHH%/Sd(LA)
Q encapsulates the possible benefits of its two variables into one stat. In preliminary analyses (which have been graciously supported by PL data magicians Colin Charles and Jeff Nicholas), I’ve found a slightly higher correlation between Q and next year’s wOBAcon than with DHH% by itself, which is not a surprise as they are proportional. However, the use of Sd(LA) adds another important layer of influence.
Let’s put Q into practice to find out the top 15 batters by its measure this year (110 BBE, minimum):
| Player | BBE | StdDev of LA (°) | DHH% | Q |
|---|---|---|---|---|
| Teoscar Hernández | 128 | 24.13 | 29.69 | 1.230 |
| Joey Gallo | 114 | 31.47 | 34.21 | 1.087 |
| Mike Trout | 147 | 25.32 | 26.53 | 1.048 |
| Fernando Tatís Jr. | 164 | 25.53 | 26.22 | 1.027 |
| Marcell Ozuna | 169 | 27.97 | 28.40 | 1.016 |
| Matt Olson | 133 | 28.78 | 27.07 | 0.940 |
| Miguel Cabrera | 155 | 25.41 | 23.87 | 0.939 |
| Brandon Lowe | 137 | 26.96 | 24.82 | 0.921 |
| Corey Seager | 177 | 24.91 | 22.60 | 0.907 |
| Bryce Harper | 150 | 27.55 | 24.67 | 0.895 |
| Juan Soto | 126 | 28.63 | 25.40 | 0.887 |
| Rafael Devers | 165 | 27.46 | 23.64 | 0.861 |
| Franmil Reyes | 147 | 25.60 | 21.77 | 0.850 |
| José Abreu | 182 | 25.21 | 21.43 | 0.850 |
| Travis Shaw | 114 | 25.13 | 20.18 | 0.803 |
This is a very good list of players who, for the most part, are undoubtedly great performers and probably should do well in terms of wOBAcon next year, statistically speaking.
A note of caution: it is very important that, as with any estimator, Q shouldn’t be interpreted without context; context is how we understand that Gallo’s stratospheric K% or Travis Shaw’s volatile DHH% (from 11.59% in 2018 to 24.56% in 2020) should make us not overestimate their Q numbers. Context is also where Olson checks all the right boxes this year: a constantly rising DHH%, constantly decreasing launch angle tightness, an increasingly better average LA, and a great GB/LD/FB profile.
Now that we have laid down the relevancy of Q, for added context let’s look at the 2019 Q Leaderboard:
| Player | BBE | StdDev of LA (°) | DHH% | Q |
|---|---|---|---|---|
| Joey Gallo | 127 | 29.90 | 39.37 | 1.317 |
| Aaron Judge | 233 | 25.70 | 27.90 | 1.085 |
| Miguel Sanó | 222 | 29.20 | 31.08 | 1.064 |
| Mike Trout | 349 | 25.60 | 27.22 | 1.063 |
| Nelson Cruz | 326 | 28.80 | 27.30 | 0.948 |
| Jorge Soler | 413 | 27.50 | 25.18 | 0.916 |
| Matt Olson | 339 | 29.30 | 25.07 | 0.856 |
| Franmil Reyes | 345 | 30.30 | 25.22 | 0.832 |
| Keston Hiura | 200 | 27.90 | 23.00 | 0.824 |
| Ronald Acuña Jr. | 439 | 26.90 | 21.87 | 0.813 |
| Pete Alonso | 412 | 28.40 | 22.82 | 0.803 |
| Kyle Schwarber | 377 | 29.00 | 23.08 | 0.796 |
| Matt Chapman | 431 | 32.00 | 25.06 | 0.783 |
| Bryce Harper | 399 | 27.70 | 21.55 | 0.778 |
| Christian Yelich | 371 | 29.10 | 22.37 | 0.769 |
Although this sprint-season broke a lot of projections and expectations, if we take a look at these 2019 results, we can see that the list provides a good who’s who summary of the 2020 season. To smooth out some of the small sample size problems of 2020, here is a table with the 2019 and 2020 seasons combined:
| Name | BBE | IsfDHH | AvgSD(LA) | DHH% | Q |
|---|---|---|---|---|---|
| Miguel Sanó | 318 | 111 | 27.378 | 34.91 | 1.27496 |
| Joey Gallo | 241 | 89 | 30.685 | 36.93 | 1.20350 |
| Mike Trout | 496 | 134 | 25.461 | 27.02 | 1.06110 |
| Aaron Judge | 302 | 77 | 24.653 | 25.50 | 1.03423 |
| Jorge Soler | 503 | 131 | 28.151 | 26.04 | 0.92514 |
| Nelson Cruz | 453 | 117 | 28.300 | 25.83 | 0.91263 |
| Ronald Acuña Jr. | 539 | 131 | 27.145 | 24.30 | 0.89535 |
| Matt Olson | 472 | 121 | 29.040 | 25.64 | 0.88276 |
| Franmil Reyes | 492 | 119 | 27.952 | 24.19 | 0.86532 |
| Matt Chapman | 520 | 139 | 31.061 | 26.73 | 0.86058 |
| Yordan Álvarez | 226 | 53 | 28.062 | 23.45 | 0.83571 |
| Bryce Harper | 549 | 123 | 27.624 | 22.40 | 0.81106 |
| Gary Sánchez | 357 | 88 | 30.407 | 24.65 | 0.81066 |
| Christian Yelich | 495 | 108 | 27.107 | 21.82 | 0.80488 |
Something you have surely already realized from these leaderboards is that you won’t find the next Tony Gwynn among them. Nevertheless, as an example, this last group had an average close to five in fWAR and 132 in wRC+ during the period, and that’s after taking Trout and Yelich out of the calculation.
Now, going back to Olson’s K% increase during this season… Why shouldn’t we be worried about him becoming the new Joey Gallo or, worse, Chris Davis? Here is where I’ll refer again to context, this time related to one of the implications of the shortened season. A 60-game sample might be fogging the reality about this increased propensity to strikeout. To illustrate how could the diminished number of games impacted this part of Olson’s game, let’s take a look at his K% rolling average for the 2017-2019 span:
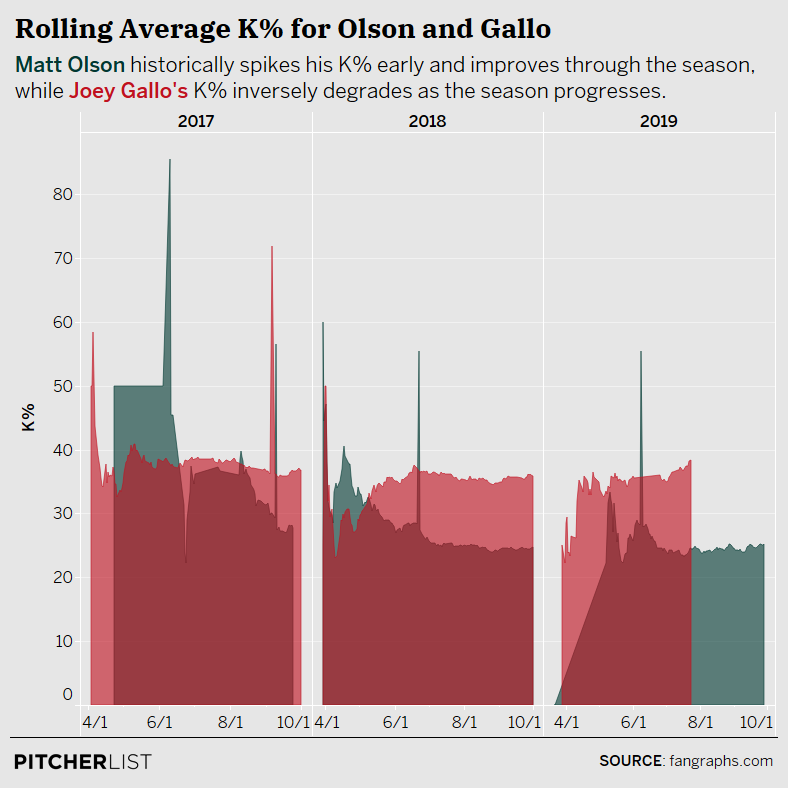
Data Visualization by @Kollauf on Twitter
From this graph, I’m willing to bet that Olson needs an “adjustment” period of time (a matter of stabilization, actually) to lower his K% through the season, as we can see those recurrent peaks at the beginning of every previous one; a period of time he didn’t have this year.
This behavior could have tons of possible explanations that I won’t try to explain, but a pattern is pretty clear from the graphed data: Olson most probably would have finished this year closer to the career K% average of approximately 25 he had previous to this season if he would have had the chance to play a regular pre-COVID schedule. Backed with this info, I’m expecting him to have a way better strikeout percentage next year.
As a comparison, there is also the same data for Gallo in the graph (in red); brushing out the small initial overrepresentation, we can see that, usually, Gallo goes from bad to consistently worse in K% every year. All that power remains useless if you can’t hit the ball, and worse, his Sd(LA) has gradually increased year after year.
Back to the Future
It was no surprise that Olson won the Gold Glove for 2021: he led all first basemen in Runs Prevented and Outs Above Average during 2019 and 2020, too. Others were impressed by his great power production, taking multiple steps forward after a down year in 2020. However, what impressed the most was finishing with a .280/.360/.595 slash line, 47 HR, and a 175 wRC+. With those numbers, it’s expected that Matt Olson will be a finalist for–and probably win–the American League MVP Award for the 2021 season.
Fortunately, taking advantage of the appropriate analysis provided by immensely useful stats like DHH%, Sd(LA), and their relationship, Q, helped us foresee such an improved offensive season. Contextualizing Olson’s ever-increasing Q in terms of him getting more hard-hit balls year after year with his gradually improving bat control provided us with very important information to properly assess his potential. This is why, to get good answers, we need to start with great Qs.
Photo by Merson/Wikimedia Commons | Adapted by Jacob Roy (jmrgraphics3 on IG)
