


Last week I wrote an article that touched on catcher framing and its contribution to pitcher success. For the unacquainted, framing is the catcher’s ability to adjust his glove after catching the pitch in order to give the impression that it landed in or on the edge of the strike zone, with the goal being to deceive the umpire into calling a strike. I want to involve a pitcher’s command and/or control to see how these factors can play off of each other. I will define and discuss framing as well as both command and control (there is a difference), see how much (if any) context these metrics require as well as if they create any level of mutual exclusivity.
Part 1: Framing
Two measurements have been created which allow us to appraise framing ability. The two we will look at are Called Strikes Above Average (CSAA) and Framing Runs (FR). This piece from Baseball Prospectus can give you all the gory math details on how the metrics were developed. CSAA is based on historical location data and basically asks how many strikes above average the catcher makes or breaks (by framing) for the pitcher. One thing about CSAA is that the spreads are minuscule as you can see when looking at Chart 1. While the metric is helpful, we can see it does little to create meaningful differentiation. Framing Runs are basically how many runs a catcher saved his team with his framing skills. Framing runs don’t create perfect correlation to CSAA but it’s pretty darn close.
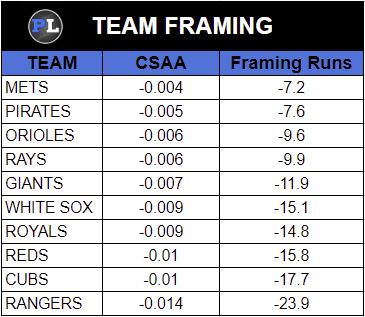
Chart 1, 2018’s worst framing teams
Chart 1 will tell you that the Texas Rangers were not good at framing. I want to take a second to point out that when I say ‘not good at framing’ or the antithesis, you must understand that we don’t know the extent to which framing is taught or practiced. I’m going to go on the presumption that teams have catchers that at least try to frame.
How about the ‘worst’ framing catchers of 2018? Chart 2 shows the bottom five and are based upon a cutoff of 5,000 framing chances. That amount covered roughly two-thirds of eligible catchers and provided a very good sample size.
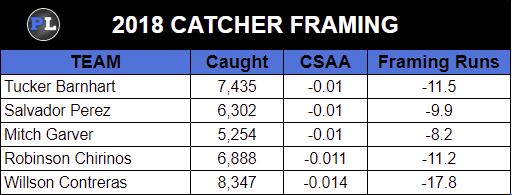
Chart 2, 2018 Individual framing
We see more of the minute deviations I mentioned before when looking at CSAA. However, there are sizable gaps between the top three catchers for CSAA and the rest of the list- Austin Hedges (.016), Yasmani Grandal (.015), and Jorge Alfaro (.013). FR again provides a clearer picture than CSAA alone. In that respect, we see Willson Contreras is the worst, preceded by Tucker Barnhart and Robinson Chirinos. It almost renders their CSAA numbers irrelevant but, like with other stats, using them in conjunction help create a better narrative.
We’ve been talking about the bad stuff. Let’s take a second to get some visual information to see how ‘effective’ framing is done by using Alfaro as an example.
These two pitches could have honestly gone either way. When done well, catcher framing can help a pitcher out a lot and there are also abilities which pitchers possess which can make the catcher’s job a lot easier.
Part 2: Command/Control
Pitchers have the lion’s share of responsibility to create a strike and are contingent upon command and control. Control is considered the pitcher’s ability to keep pitches in the strike zone (as needed), regardless of location. Command is the interpretation of how well a pitcher locates his pitches based upon his intent. And that’s a caveat when attempting to analyze command because intent creates a shortcoming. Since we can never really know for sure what a pitcher was trying to do, I’ll tell you how we can at least get close.
The first bit of data we will use is Command Score (CMD) and builds off of the pitcher version of CSAA. The thought with CMD is that we can plot where certain types of pitches are thrown and attempt to ’score’ them by how close they come to their intended target. Confused? OK, think about it this way. A pitcher tends to place his cutter in the top right corner of the strike zone. Sometimes he gets strikes, other times its a ball. Using heatmaps or other plotting tools, we can narrow it down to his most consistent spot. Then, measure all other cutters in that location in terms of how close it came to hitting that spot each time. This can be expanded upon by comparing other pitchers who tend to throw the same pitch to the same area. The pitcher will then be ‘rewarded’ for hitting the spot because we can reasonably say that he intended for the pitch to land there, independent of what the result was or expected.
We also have the assistance of another metric known as Called Strike Probability (CS Prob). This is somewhat like CMD but encompasses any pitch and its dependent on collected data that says how likely that spot draws a called strike.
When thinking of the best command/control pitchers, observing how often they can hit the edges of the strike zone tends to be considered a qualification. Chart 3 gives us ten pitchers who worked the edge of the zone the most in 2018. Also included is their overall ratio of called strikes on the edges relative to all of the pitches they threw.
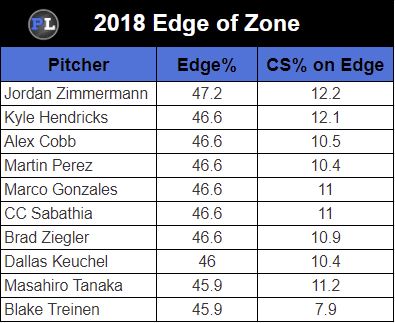
Chart 3, Highest edge rate
Just for context, Bartolo Colon had the highest called strike rate for pitches on the edge with 12.8%. The only pitchers on this list to make the top-10 for highest edge CS% was Jordan Zimmermann, who ranked 7th, and Kyle Hendricks who tied for 8th. For an interesting tangent, note that Colon played for the Rangers in 2018 and was mainly caught by Chirinos (see Chart 2). That should speak volumes to the ability of Colon to both command and control the strike zone, right? How about Hendricks, who was caught by the worst framer (Contreras) and pitched for the second-worst framing club? Does this make them elite edge pitchers or elite in command and/or control?
Well, with CMD, we can get a better answer. The top-10 CMD pitchers (min 75 IP) of 2018 are shown in Chart 4 below. Of the pitchers that qualified, CMD score average was 49. I decided to include FIP just to see if there is any correlation with CMD score.
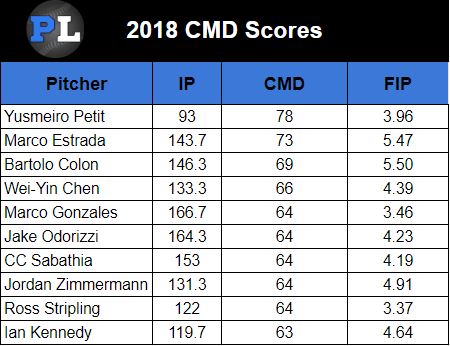
Chart 4, CMD scores
So Colon ranked third in CMD and Hendricks just missed the list (62 CMD). Though we have exceptions. just because you have strong command, it doesn’t mean you’re going to perform well. So why is that? In this case, Colon’s locations might be more high risk than say Ross Stripling’s which created some damaging situations for him.
Let’s go back to Edge% for a second because now I want to see who held the worst edge CS-rates in 2018.
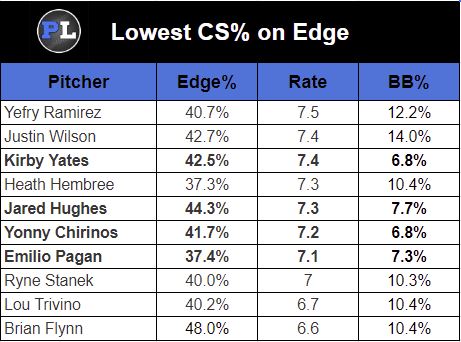
Chart 5, Lowest called strike rate on edge
This time I included BB% because I wondered if it would be a factor in helping us determine if this low edge called-strike rate indicates a lack of command/control. But, like with FIP in Chart 4, there is little correlation. What’s more, there are even several (bolded) pitchers who have a below-average walk rate.
A couple of interesting things show up in Chart 5. The first is the San Diego Padres‘ Kirby Yates, who threw to one of the best framing catchers in baseball (Hedges), was tied for lowest walk rate, but had a well-below average edge CS%. There are also two Tampa Bay Rays relievers present (Yonny Chirinos and Emilio Pagan) who threw to an average framer in Wilson Ramos. What’s happening here? In these examples, the answer is that those three pitchers saw most of the pitches they placed on the edge of the zone fall in areas where there is a low CS Prob.
Part 3: Subject Study
So at this point, we know just because you hit the edge of the zone consistently it doesn’t mean you possess great command and/or control. Or that great CMD scores translate to success. OR that a catcher’s framing skills ultimately dictate a pitcher’s success. When you look back at Chart 4, the pitchers with better than average FIPs have catchers that are (at worse) average pitch framers when we involve CSAA and FR. These advanced metrics alone don’t completely unwind the sheet but they can be profound intimations when used the right way. In doing so, we can safely assume that good framing and good command/control can create success. How about the other way around?
In 2018, Cincinnati Reds reliever Jared Hughes was (mostly) caught by Barnhart, the 5th worst framer (see Chart 2). Hughes also finds himself in the same company as our three aforementioned pitchers in Chart 5. Last year Hughes had a below average CMD score (47) which ranked him 114th. What’s in question is how the catcher can impact CMD if they are able to frame. Does the burden of CMD score lay directly on the pitcher?
Let’s have a look at where Hughes’ edge pitches are located (we’ll come back to this).
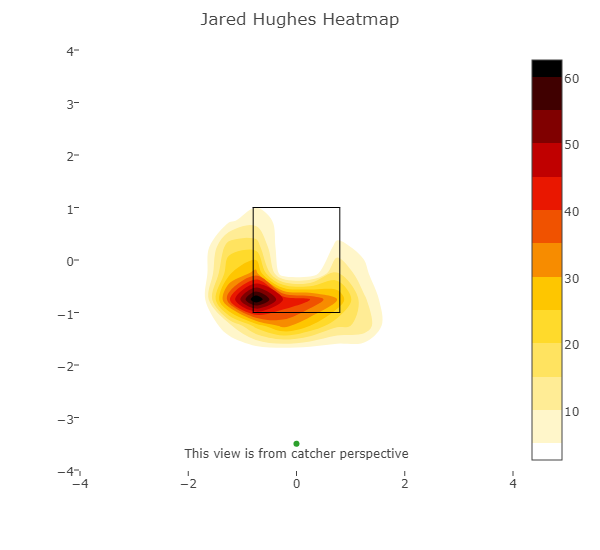
Chart 6
179 of Hughes’ 502 edge pitches were taken by the hitter (36%). Chart 7 outlines what happened when the pitches were taken and what the result should have been. Don’t worry, this will make sense in a minute.
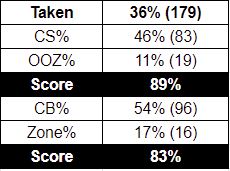
Chart 7, Taken outcomes
What I’ve shown in Chart 7 is that of the 179 pitches taken, 46% were called strikes and 54% were called balls. Of the called strike pitches, just 11% actually landed out of the strike zone while 17% of called balls should have been called strikes (89% of called strikes were correct, 83% of balls were correct). Knowing that Barnhart isn’t a good framer, we know that human error is at fault here. And even if you reassign the errant calls, it has an insignificant effect on the outcome; 55% balls and 45% strikes.
Even after the ratios balanced themselves back out, we have no idea how many of those ‘actual’ balls a good framing catcher could have pulled in for strikes. We could venture to guess that if Barnhart was elite, those two final ratios would at the very least flip. Notice where Hughes’ edge pitches are concentrated in Chart 8. There is a strong concentration of pitches that land a bit outside of the zone. Would a good pitch framer have created more strikes here? Without knowing what actually happened to those pitches (taken? swung at?), it’s too difficult to say.
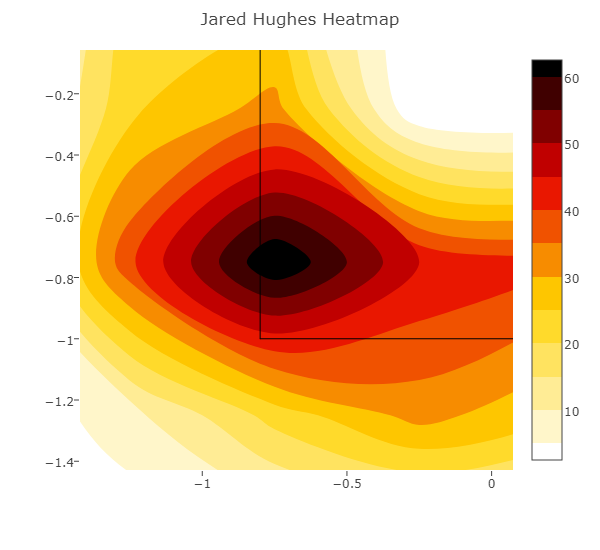
Chart 8
We know Hughes has a low walk rate though that doesn’t absolve any perceived wrongdoings by his catcher. Hughes’ groundball rate is much higher than the league average (61% career), and coupled with a low K-rate, a lot of his pitches are put in play. His BABIP last season was .252, and despite a hard-hit rate of 36%, he generated a lot of bad contact. For CS Prob, Hughes ranked 265th (42%) but his (Pitch Info) Zone% in 2018 was 36%, which means that he got six extra strikes due to the strike zone being a dynamic form (umpire, batter handedness, etc).
Pulling in everything we discussed and basing our example off of it, we have two separate entities that don’t necessarily rely on each other. Having control (ie- keeping pitches in the strike zone) doesn’t require intervention from the catcher. The way we are measuring command does but to a very small extent. We define command as the ability to place your pitches where you intend to but we aren’t sure how much framing plays a factor in it. Framing does matter when the two C’s are lacking. There is only so much a catcher can do to influence a ball or strike so we can look to CMD to see how easy or hard a pitcher has made it for the catcher to frame when he needs to. So command and control works with framing in ways that are totally dependent on the abilities of all parties involved. A pitcher with strong command/control makes a catcher’s framing insufficiencies mostly irrelevant, while a catcher with strong framing abilities has the potential to make a mediocre pitcher at least a little better.
(Photo by Jay Anderson/Icon Sportswire)
