


The longer you study baseball, the more you come to appreciate the variety of factors that can influence a pitcher’s performance. This list includes measures of the pitcher’s innate ability, the opposing batter’s skill, home-field advantage, park factors, various measures of luck, and more. Even the pitcher’s breakfast probably has some degree of impact, although data in this area is currently lacking. One area where data is no longer lacking, however, is in regards to the catcher’s defense.
To study the potential relationship between catcher defense and pitching performance, let’s focus in on two specific defensive metrics: Defensive Runs Above Average (Def) and Catcher Framing (FRM). Those who have dug into how WAR is calculated may already be familiar with Def, which equals fielding runs above average added to a positional adjustment. For catchers, this fielding runs above average incorporates the ability to throw out runners and prevent them from attempting steals in the first place (using Stolen Base Runs Saved from DRS) and the ability to block pitches. A Def value of zero corresponds to average defensive ability.
Catch framing represents a catcher’s ability to receive a ball out of the zone in such a way that the umpire is more likely to call it a strike. Data for Catcher Framing was added to FanGraphs this past spring. FRM, which represents the number of runs a catcher saves due to framing, is calculated by comparing actual strike calls to predicted strike probabilities and converting the extra strikes to runs at a rate of about 0.135 saved runs per additional called strike. In 2019, values for FRM ranged from 20.7 (Austin Hedges) to -13.1 (Elias Diaz). As a side note, I would be remiss not to mention Baseball Savant’s fantastic data on pitch framing.
One important assumption that we’ll be making is that Def and FRM are representative of the catcher’s overall skill. This may seem like an obvious and strange thing to mention, but it’s important to note considering that Def and FRM are both run-value statistics, meaning they combine the quality of performance with the amount played. If somebody is the best catcher in the universe, but only caught for an inning, that player is going to have a Def at or very near to zero. The analysis that follows will restrict the catcher pool to those with a set number of innings fielded to help overcome this limitation.
Now that we understand how these defensive metrics work, let’s dive into 2019’s data and see whether they had any effect on fantasy pitching performance.
Analysis
If Def and FRM are truly impactful fantasy-wise, then we’d expect a pitcher’s ERA and WHIP to be lower with the better defensive catcher and a pitcher’s K/9 to be higher with the better framing catcher. First, let’s take a look at which teams had the biggest gap in defensive ability between their two primary catchers (min. 250 innings fielded at catcher).
| Team | Def Difference |
|---|---|
| Padres | 28.0 |
| Phillies | 24.9 |
| Giants | 21.9 |
| Pirates | 20.0 |
| Mariners | 19.6 |
| Red Sox | 16.3 |
| Brewers | 15.1 |
| Indians | 14.7 |
Now let’s take a look at the starting pitcher-catcher pair-specific stats within these teams (min. 20 innings pitched together). The better defensive catcher and his final 2019 stats are highlighted in green.
| Pitcher | Catcher | IP | ERA | WHIP | K/9 | Def (full season) | FRM (full season) |
|---|---|---|---|---|---|---|---|
| Aaron Nola | J.T. Realmuto | 170.2 | 4.01 | 1.32 | 10.02 | 27.8 | 8.0 |
| Aaron Nola | Andrew Knapp | 31.2 | 3.13 | 0.95 | 11.08 | 2.9 | 0.3 |
| Cal Quantrill | Austin Hedges | 41.0 | 7.02 | 1.41 | 8.56 | 27.6 | 20.7 |
| Cal Quantrill | Francisco Mejia | 37.2 | 3.58 | 1.12 | 6.45 | -0.4 | -4.3 |
| Chase Anderson | Yasmani Grandal | 81.1 | 3.32 | 1.23 | 8.19 | 23.4 | 17.0 |
| Chase Anderson | Manny Pina | 47.2 | 5.66 | 1.30 | 6.99 | 8.3 | 6.3 |
| Chris Paddack | Austin Hedges | 95.0 | 2.65 | 0.88 | 10.23 | 27.6 | 20.7 |
| Chris Paddack | Francisco Mejia | 45.2 | 4.73 | 1.18 | 8.87 | -0.4 | -4.3 |
| Chris Sale | Christian Vazquez | 31.0 | 6.68 | 1.52 | 9.00 | 22.2 | 12.4 |
| Chris Sale | Sandy Leon | 116.1 | 3.79 | 0.97 | 14.47 | 5.9 | 2.9 |
| Dereck Rodriguez | Buster Posey | 44.1 | 5.89 | 1.35 | 6.29 | 18.8 | 9.6 |
| Dereck Rodriguez | Stephen Vogt | 24.0 | 4.50 | 1.58 | 6.38 | -3.1 | -4.0 |
| Dinelson Lamet | Austin Hedges | 30.0 | 3.60 | 1.27 | 13.50 | 27.6 | 20.7 |
| Dinelson Lamet | Francisco Mejia | 32.0 | 4.78 | 1.28 | 13.78 | -0.4 | -4.3 |
| Eric Lauer | Austin Hedges | 55.1 | 3.74 | 1.27 | 6.34 | 27.6 | 20.7 |
| Eric Lauer | Francisco Mejia | 66.2 | 4.86 | 1.44 | 8.78 | -0.4 | -4.3 |
| Jeff Samardzija | Buster Posey | 120.2 | 3.43 | 1.05 | 7.23 | 18.8 | 9.6 |
| Jeff Samardzija | Stephen Vogt | 44.1 | 4.26 | 1.17 | 6.90 | -3.1 | -4.0 |
| Joe Musgrove | Jacob Stallings | 80.2 | 4.35 | 1.19 | 9.15 | 12.0 | 6.0 |
| Joe Musgrove | Elias Diaz | 50.0 | 4.14 | 1.16 | 7.92 | -8.0 | -13.1 |
| Jordan Lyles | Yasmani Grandal | 42.0 | 2.79 | 1.12 | 7.29 | 23.4 | 17.0 |
| Jordan Lyles | Elias Diaz | 50.1 | 6.80 | 1.63 | 10.55 | -8.0 | -13.1 |
| Madison Bumgarner | Buster Posey | 177.2 | 3.80 | 1.10 | 9.02 | 18.8 | 9.6 |
| Madison Bumgarner | Stephen Vogt | 24.0 | 4.50 | 1.25 | 6.75 | -3.1 | -4.0 |
| Marco Gonzales | Tom Murphy | 66.1 | 4.34 | 1.40 | 6.51 | 13.1 | 4.1 |
| Marco Gonzales | Omar Narvaez | 124.1 | 3.84 | 1.27 | 6.59 | -6.5 | -10.4 |
| Mike Clevinger | Roberto Perez | 101.0 | 2.67 | 1.11 | 12.30 | 20.1 | 9.6 |
| Mike Clevinger | Kevin Plawecki | 25.0 | 2.88 | 0.84 | 11.16 | 5.4 | 3.8 |
| Nick Margevicius | Austin Hedges | 22.2 | 8.74 | 2.07 | 5.56 | 27.6 | 20.7 |
| Nick Margevicius | Francisco Mejia | 25.2 | 3.86 | 1.09 | 6.66 | -0.4 | -4.3 |
| Rick Porcello | Christian Vazquez | 80.1 | 6.05 | 1.57 | 7.51 | 22.2 | 12.4 |
| Rick Porcello | Sandy Leon | 89.1 | 4.63 | 1.16 | 7.15 | 5.9 | 2.9 |
| Shane Bieber | Roberto Perez | 120.0 | 3.38 | 1.14 | 11.10 | 20.1 | 9.6 |
| Shane Bieber | Kevin Plawecki | 92.1 | 3.12 | 0.94 | 10.62 | 5.4 | 3.8 |
| Shaun Anderson | Buster Posey | 37.1 | 4.82 | 1.66 | 5.54 | 18.8 | 9.6 |
| Shaun Anderson | Stephen Vogt | 40.1 | 6.02 | 1.51 | 6.02 | -3.1 | -4.0 |
| Trevor Williams | Jacob Stallings | 66.0 | 4.23 | 1.24 | 6.55 | 12.0 | 6.0 |
| Trevor Williams | Elias Diaz | 47.2 | 8.87 | 1.87 | 7.55 | -8.0 | -13.1 |
| Tyler Beede | Buster Posey | 47.1 | 5.70 | 1.61 | 6.66 | 18.8 | 9.6 |
| Tyler Beede | Stephen Vogt | 57.0 | 4.42 | 1.32 | 9.32 | -3.1 | -4.0 |
| Vince Velasquez | J.T. Realmuto | 84.2 | 4.89 | 1.32 | 9.57 | 27.8 | 8.0 |
| Vince Velasquez | Andrew Knapp | 22.1 | 5.24 | 1.43 | 10.08 | 2.9 | 0.3 |
| Yusei Kikuchi | Tom Murphy | 66.1 | 5.70 | 1.48 | 6.38 | 13.1 | 4.1 |
| Yusei Kikuchi | Omar Narvaez | 95.1 | 5.29 | 1.54 | 6.51 | -6.5 | -10.4 |
| Zach Davies | Yasmani Grandal | 107.0 | 3.62 | 1.23 | 6.06 | 23.4 | 17.0 |
| Zach Davies | Manny Pina | 52.2 | 3.42 | 1.41 | 5.13 | 8.3 | 6.3 |
| Zach Eflin | J.T. Realmuto | 111.1 | 4.61 | 1.45 | 7.11 | 27.8 | 8.0 |
| Zach Eflin | Andrew Knapp | 38.2 | 3.26 | 1.16 | 6.52 | 2.9 | 0.3 |
| Zach Plesac | Roberto Perez | 63.0 | 2.43 | 1.10 | 6.86 | 20.1 | 9.6 |
| Zach Plesac | Kevin Plawecki | 52.2 | 5.47 | 1.39 | 6.84 | 5.4 | 3.8 |
These results don’t seem to suggest any real pattern on whether the better catcher is positively impacting the pitcher’s performance. Maybe we’ll see more of a trend if we examine all the starting pitcher-catcher pairs. Let’s take a look at all 344 starting pitcher-catcher pairs from 2019 via some scatter plots with a LOESS smooth curve fit to show our trends of interest.
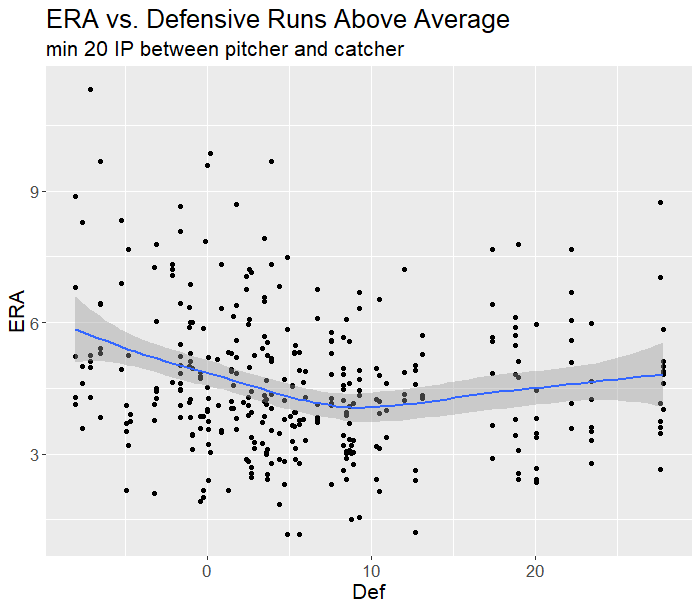
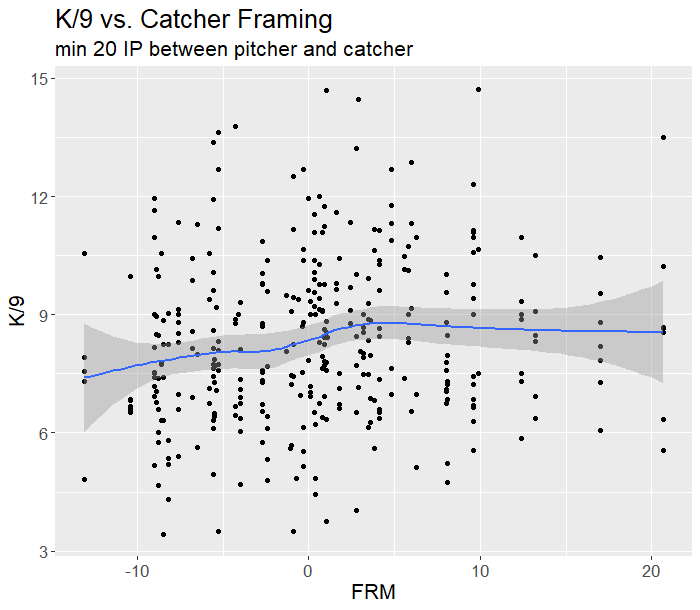
To some extent these plots show the trends we expect, a negative ERA-Def correlation and a positive K/9-FRM correlation. Those versed in statistics may appreciate that the modest 20 innings pitched restriction may not be large enough to balance out all the external factors that could also be affecting ERA or K/9. For example, one pitcher-catcher pair may have faced much tougher opponents than another pair. Consequently, we may not be truly isolating the relationships we’re interested in (Def and ERA, FRM and K/9) because these external factors are not balanced between all the pitcher-catcher pairs.
To overcome these limitations we can create simple linear models that adjust for these potential external factors:
ERA ~ Def + Home-field + BABIP + HR/FB + LOB% + Park factors + Opponent team wOBA
K/9 ~ FRM + Home-field + Swinging strike % + Fastball velocity + Opponent team K%
In our first model, ERA is regressed on Defensive Runs Above Average, home field, the HOTEL (BABIP, HR/FB, LOB%), park factors, and the opposing team’s season wOBA on the date of the matchup. While there are certainly other variables that could have been included here, this seems to cover the most important influences. I subsequently removed home-field and opponent team wOBA as they were both statistically very poor predictors. After fitting this model we find that Def is a statistically significant predictor of ERA and that a one-unit increase in Def is associated with a 0.01 unit decrease in ERA. While this result may seem pretty minuscule, keep in mind that four teams had a difference of 20 or more Def between their catchers. Hedges and Francisco Mejia differed by 28 Def, meaning that a pitcher’s final catcher-specific ERA would be expected be about 0.28 less with Hedges than Mejia.
In the second model, K/9 is regressed on Catcher Framing, home field, swinging strike percentage, fastball velocity, and the opposing team’s season K/9 on the date of the matchup. I subsequently removed home field and opponent team K rate as they were both statistically very poor predictors. After fitting this model we find that FRM is a statistically significant predictor of K/9 and that a one-unit increase in FRM is associated with a 0.025 unit increase in K/9. To once again frame this in perspective, a pitcher’s final catcher-specific K/9 would be expected be about 0.63 more with Hedges than Mejia.
Before we start incorporating this information into our strategy for 2020, let’s take a quick look and be sure that a catcher’s defense and framing is something that we can expect to remain relatively consistent year to year. The following plots show the performance of the 19 catchers who fielded 500 innings in each of 2017, 2018, and 2019.
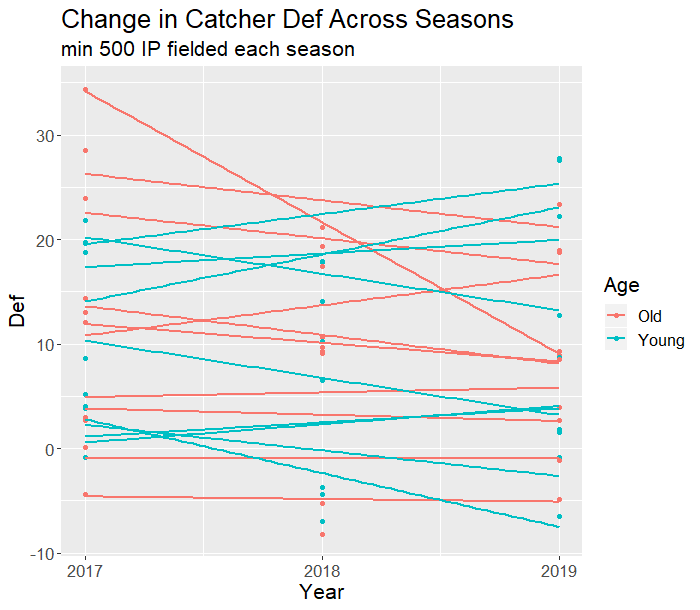
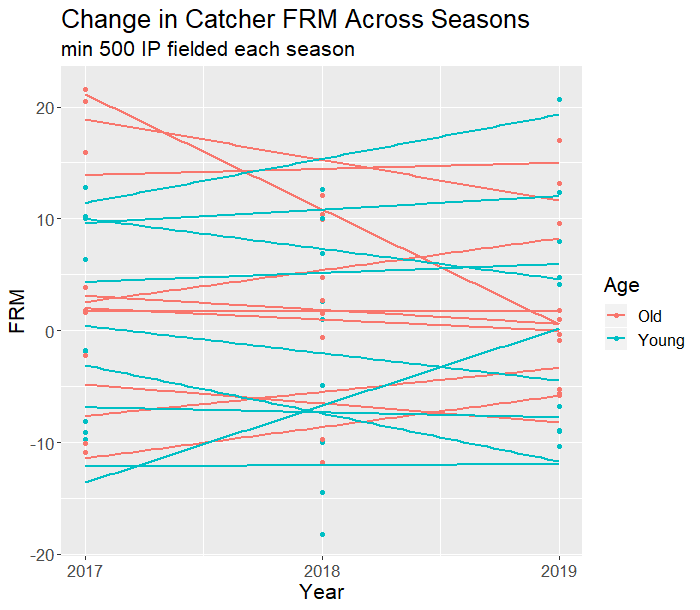
Overall, it seems that a catcher’s defense and framing for 2020 can probably be expected to remain consistent with the past performance. Although there are some slight rises and falls, the catchers generally stay within the top/middle/bottom of the pack. Grouping by age (old corresponds to starting the 2017 season over the age of 28) doesn’t seem to show any apparent differences.
So how exactly will we be using this knowledge for the 2020 season? Most likely, this kind of “micro-level” knowledge is not going to be a top consideration during the draft, but could be quite useful when considering streamers for those in daily leagues. Imagine the scenario where you’re on the fence about whether to stream Vince Velasquez (as seems to happen every year). Knowing that Andrew Knapp is behind the plate instead of J.T. Realmuto may give you the necessary push to consider going with a different pitcher instead of Velasquez.
Notes for 2020
Upon seeing the title of this article, some may have been reminded of the 2019 stories surrounding Yu Darvish and Noah Syndergaard regarding their catcher preferences. Darvish found his groove when he started pitching to Victor Caratini and Syndergaard reportedly urged the Mets to not pitch to Wilson Ramos. In both cases, each pitcher was attempting to stay away from the team’s worst defensive catcher; Willson Contreras had a -0.9 Def and -8.9 FRM with the Cubs and Wilson Ramos had a 0.1 Def and -7.6 FRM with the Mets. By the end of the year, both pitchers seemed to be matched with their preferred catcher, but this could be a situation to monitor for 2020 as Contreras and Ramos could earn more playing time through their batting.
Speaking of the aforementioned Mets catcher situation, one pitcher now avoiding that crew is Zack Wheeler, who was signed by the Phillies this offseason. Like Aaron Nola, Wheeler should be expected to get >80% of his starts with Realmuto and his league-leading Def. A couple of other important offseason moves to consider includes Yasmani Grandal heading to the White Sox and Omar Narvaez filling his spot in Milwaukee. The White Sox are now sure to enter the leaderboard for teams with the biggest difference in defense between catchers, pairing one of the best catchers in Grandal (23.4 Def, 17.0 FRM) with the below-average James McCann (1.8 Def, -9.0 FRM). Owners of Lucas Giolito and crew will want to keep an eye on who is behind the plate, especially with Grandal likely to get reps at 1B or DH. The Brewers, on the other hand, are inheriting one of 2019’s worst defensive catchers in Narvaez (-6.5 Def, -10.4 FRM). This massive swing from Grandal to Narvaez may hinder any potential breakouts from Brandon Woodruff or Adrian Houser.
On a non-fantasy aside, going through this analysis helped me appreciate the catching machine that is Hedges. While Hedges was a very good framer for 2017 and 2018, his skill took a big step forward in 2019, where his framing was truly in a league of its own. According to Baseball Savant, Hedges saved 20 runs due to extra strikes, which was seven more runs than the next closest catcher. Entering 2020 at age 27, it will be exciting to see if Hedges can improve even further in his catch framing. Let’s hope that the lurking robot umpires aren’t introduced any time soon to eradicate this entertaining aspect of the game.
