


One of the biggest trades at the trade deadline of the 2020 season was the San Diego Padres‘ seven-player trade with the Seattle Mariners. The trade was headlined by utility-man-turned-catcher Austin Nola. The 30-year-old was one of baseball’s hottest players while he was in Seattle and made him easy trade bait for a rebuilding team. Nola had a 147 wRC+ and a 1.3 fWAR in 110 plate appearances before he was traded. Once he went to San Diego, however, his production fell. He had a sub 100 wRC+ but still produced 0.4 fWAR in 99 plate appearances. For San Diego and fantasy owners alike, the question remains: who will Austin Nola be moving forward? More likely than not: a defensive catcher with some above-average offensive potential who could become one of the more valuable players in all of baseball that has a team with Fernando Tatis Jr. and Manny Machado.
Defense Matters Behind the Plate
Being a strong defender at the catching spot is important. It’s the most difficult position to play and involved in every single pitch of the game.
There are three main facets of catcher defense: framing, blocking, and stolen base prevention. Framing is the most important part of catching as it happens the most often during a game for a catcher. Fans tend to think that blocking is the most important aspect of catching and while it can give fans a negative result to the game and the eye, bad framing will hurt teams more in the long run. Think about it like this: if a catcher has a chance to frame 35 pitches a game but only block 5 pitches a game, the framing is more likely to be valuable because 35 is greater than 5. Math!
To see this, we are going to look at 2019 data on catchers because 2020 data isn’t available yet on Baseball Prospectus. In 2019, there were 123 qualified catchers according to Baseball Prospectus. 118 of them were between -5 to 5 EPAA (Errant Pitches Above Average, aka Blocking) runs. If we applied that same standard to CSAA (Called Strikes Above Average, aka Framing) runs, 89 catchers fell within the range of -5 to 5 runs.
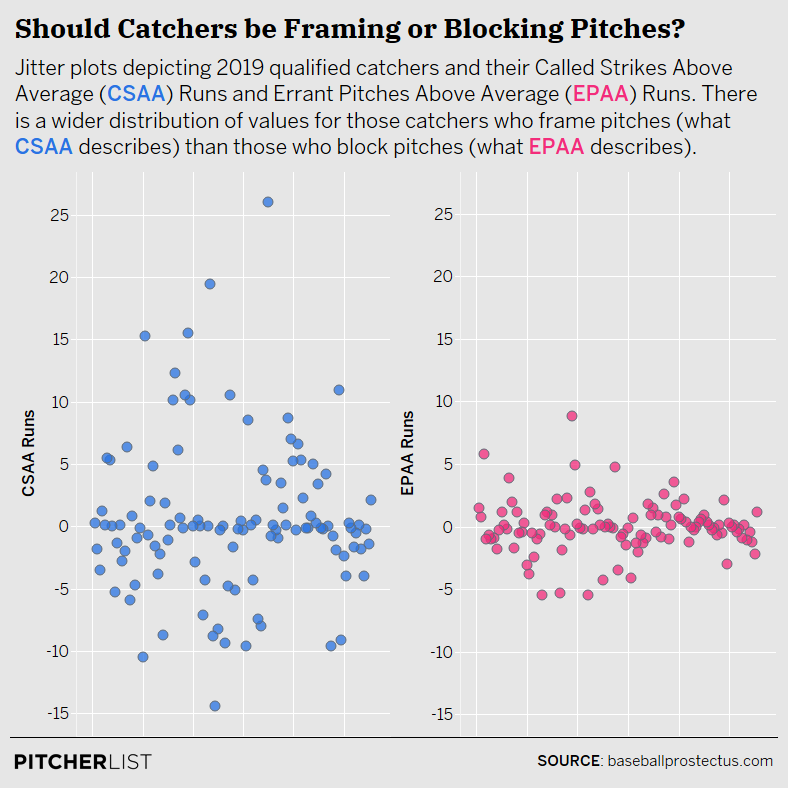
Data Visualization by @Kollauf on Twitter
If we limit our sample to catchers with 4,000 CSAA chances (most full-time starting catchers), 11 of the 33 of the catchers fall within the range. For blocking, if we limit it to catchers with at least 2,500 EPAA chances, 30 of the 35 catchers fall within the range. The opportunity to create value defensively is with framing, not blocking—despite what most fans might believe.
There are different framing statistics across different websites. They have different methods of calculation and thus can see different values. Fangraphs and Prospectus use their framing stats to help create their WAR model for catchers.
By every metric, Austin Nola was a well-above-average framer in the 2020 season. According to Baseball Prospectus, Nola was third in all of baseball by CSAA runs. By Fangraphs, Nola was tied for seventh in framing and by Baseball Savant, he was tied for sixth in framing.
| Source | Value | Rank |
|---|---|---|
| Baseball Savant | 2 runs | 6th |
| Baseball Prospectus | 4.0 runs | 3rd |
| Fangraphs | 2.3 runs | 7th |
Nola excels at getting the low pitch called a strike. His success comes from his ability to keep his glove under the ball longer and bring it back into the zone. This is common amongst elite framers, though some of them have different ways of approaching it. Take a look at how Austin Nola receives pitches here.
https://gfycat.com/skeletalpettyeyas
Let’s compare it to how another elite defensive catcher receives the ball: in this case, we will use JT Realmuto. Realmuto has a unique style similar to the one knee method employed by Nola, but his glove placement is much lower.
https://gfycat.com/giantbrownharlequinbug
As you can see, the two are fairly similar. This approach has become popular and has shown success. We can look at Mitch Garver as someone who went from a below-average framer in 2018 to an average one in 2019 using this new method. Summed up, Nola is going to bring a lot of value on the defensive side of the ball. Yes, defensive statistics can be subject to a small sample size, which Fangraphs explains here. That can prompt some questions on how good Nola’s defense truly is, but he’s got the right form with the proper technique to keep his strong showing in 2020 going for years to come.
There is no information available on Austin Nola’s blocking or throwing numbers yet, so we cannot evaluate his overall defensive potential at catcher. Even without that information, we can tell Nola has the skillset to be an elite framer, which is worth a lot on its own. There’s a reason Austin Hedges, Roberto Pérez, and Kyle Higashioka get playing time as subpar hitters. Those players create enough value behind the plate to outweigh their offensive inefficiencies. It’s lucky, then, that Austin Nola has the offensive skillset to make him much more than those players.
A Break-Out Bat
Any offense you can get out of the catcher spot is welcomed by any team. The average offensive catcher wRC+ since 2017 is around 87. When looking for batters to potentially break-out or maintain a hot stretch, there a few skills one can look for: plate discipline, quality of contact, and whiff potential. BB% and hard-hit rate both ended up correlating with over 50% value to wRC+. Both also ended up being statistically significant in explaining variation in wRC+ and wOBA. (Shout-out to Jack Cecil and Christian Mack for the help on the correlation statistics!)
| Player | BB% | wRC+ Rank |
|---|---|---|
| Mike Trout | 18.5 | 1st |
| Juan Soto | 16.9 | 3rd |
| Joey Votto | 16.4 | 27th |
| Bryce Harper | 16.4 | 15th |
| Aaron Judge | 15.9 | 2nd |
The top 3 hitters by wRC+ since 2017 also happen to be in the top five in walk rate. It’s not a coincidence. Players who can control the strike zone better will get on base more and see better pitches. For Nola, he had an 8.6 BB% in 267 PAs in 2019 that rose to a 9.8 BB% in 184 PAs in 2020. He stayed right around the average walk rate in both seasons, but Nola’s chase rate fell by almost six points from 22% to 16.3%. Nola was drawing a few more walks on a rate basis in 2020 because he was laying off pitches more. When he did swing outside of the strike zone, he made contact much more as his chase contact% rose by nearly seven points from 56.9 to 63.2.
Those are good signs for Nola moving forward. If he continues to raise his walk rate while cutting his chase rate, he will get on base more. Couple that with an improving hard-hit rate, and Nola shows a lot of promise.
Additionally, batters who can hit the ball hard more consistently are going to see more success. Take a look at another chart with the top five players in hard-hit rate in 2020 with their respective wRC+ ranking minimum of 180 PAs.
| Player | Hard-Hit Rate | wRC+ Rank |
|---|---|---|
| Fernando Tatis Jr. | 62.2 | 20th |
| Travis d’Arnaud | 57.8 | 28th |
| Miguel Sano | 57.3 | 107th |
| Ronald Acuña Jr. | 57.0 | 11th |
| Corey Seager | 55.9 | 17th |
Four of the top 30 hitters in baseball and Miguel Sanó. Sanó has consistently been an outlier in hard-hit rate to production, a different article for a different time. Still, it follows logically that if you hit the ball hard consistently, you’ll have better results. For Austin Nola, his hard-hit rate went from an average rate of 35.6 to a well-above-average rate of 43.4. Nola was ninth among catchers in hard-hit rate in 2020.
Hard-hit rate can be misleading, as evidenced by Miguel Sanó being top-five in hard-hit rate consistently. But Nola also more than doubled his barrel rate from 3.4 to 7.8 in only 48 fewer batted ball events than 2019. In Barrels/BBE, Nola ranked 10th among all catchers, just in front of Yasmani Grandal. Since 2017, Grandal has led all catchers in wRC+ so for Nola to be comparable to him in quality of contact statistic is encouraging.
An improved hard-hit rate and barrel rate for Nola led to an improvement in both xwOBACON and xwOBA.
Nola saw a 40-point increase in his xwOBA from 2019, a dramatic improvement that was fueled by his better quality of contact and plate discipline. Nola ranked fifth among qualified catchers in xwOBA in 2020. While a .343 xwOBA is only 74th percentile among all hitters, to get that kind of production out of the catching position is immensely valuable. San Diego has struggled with offensive production at the catcher position since Yasmani Grandal left. Even in 2020 with Austin Nola taking the bulk of the plate appearances after the trade, Padres catchers had a 61 wRC+ and 0.0 fWAR. Nola has a big chance to improve that.
A common thought amongst baseball fans is that strikeouts are bad, and while they are a suboptimal result, they don’t say how good a hitter is. Austin Nola had a 23.6 K% in 2019, which is .60 above the average K% for MLB and .50 above the average K% for catchers. In 2020, he cut the K% by five points to 18.5. A large part of that is the decrease in swings outside of the strike zone, but another large part of the improvement is the improvement in swings and misses. Austin Nola had a whiff rate of 20.3%, which put him in the 81st percentile among all MLB players, and tops among catchers.
Limiting swings and misses can help identify players who project to be better depending on the type of hitter they are. Nola is not a power hitter like Aaron Judge where the strikeouts are outweighed by his ability to hit 40 home runs a year and get on base 40% of the time. Making sure Nola limits the swings and misses, along with his improved plate discipline, will help him succeed.
The San Diego Padres are a team on the rise. Tatis Jr, Machado, Dinelson Lamet, Jake Cronenworth, and others have provided a spark for a team and a franchise that has so desperately needed it. Austin Nola is not the flashiest piece of the team, though on a team with Fernando Tatis Jr., that’s impossible. Still, he is a solid piece to help them win. If Austin Nola can get 500 plate appearances in 2021, he could prove to be San Diego’s third star.
Image information: Nola: Photo by Brian Rothmuller/Icon Sportswire. Machado: Photo by Icon Sportswire. Tatis Jr: Photo by Brian Rothmuller/Icon Sportswire. Feature Graphic Designed by James Peterson (Follow @jhp_design714 on Instagram & Twitter)
