


One of the most time-consuming things in the world is the process of ranking any category of players for (fantasy) baseball purposes, whether it be pitchers (starters or relievers), batters, prospects, whichever you need/want to rank.
That’s why I present you an easy way of tiering players by a stat or category through the useful concept of Standard Deviation; uses of this simple statistical notion for fantasy baseball go well beyond this simple application, so this article also provides a practical introduction to it which will be useful for your future analyses.
To Rank Is a Tedious Task
Furthermore, most of the time it can be very subjective and that makes the process even more difficult; you probably will not rank the same set of players and data equally in two different opportunities.
One way to do rankings is, as an example, to use one base stat and simply sort the list from better to worse, according to said stat. Then, you can set fixed intervals among this list, and that way you can separate the members into tiers.
Let’s see an example of how this works for a list of 25 qualified pitchers and their SwStr% (percentage of pitches that ended in swing and miss) for the 2021 season, through the 5th of May:
I’ve highlighted Ian Anderson, as his SwStr% of 12.7% was very close to the average for the league at that moment in 2021. Knowing this, then every pitcher with a higher SwStr% than Anderson is “above” average and lower is “below”, so we could divide the scale into equal intervals from Anderson and up, and also from Anderson and down; the ranked list, with this simple method, would now look like this:
I’ve color-coded each tier for easier viewing and included Anderson in the following upper one, tier fourth, but he could go in the opposite way, in the fifth tier.
On the surface, this might look like a good way to rank these pitchers in tiers, according to their SwStr%, but there is a big issue with it: the number of divisions was arbitrarily selected, in this case equally divided in four upper and four lower tiers with a bigger one between them, but then we could’ve divided in five, six or any other number of upper and lower tiers. Or simply choose any other different ranges.
The appropriate way of doing this would be to analyze the effect of SwStr% on the dependent variable that we define as the success indicator (SIERA, FIP, etc.), and then to test the percentile influence of it and segment accordingly. But that takes a lot of time, which sometimes we don’t have or don’t want to spend on this.
So, what can we do to find a balance to tackle this situation? Let’s talk about a classic distribution.
The Normal Distribution
I’ll leave the math-y, deeper explanations to others, but in a nutshell, the normal distribution, also known as the Gaussian distribution, is a probability distribution that is symmetric about the mean, showing that data near the mean are more frequent in occurrence than data far from the mean.
In graph form, the normal distribution will appear as a bell curve. (Strictly speaking, it is not correct to talk about “the normal distribution” since there are many normal distributions, but let’s roll with it).
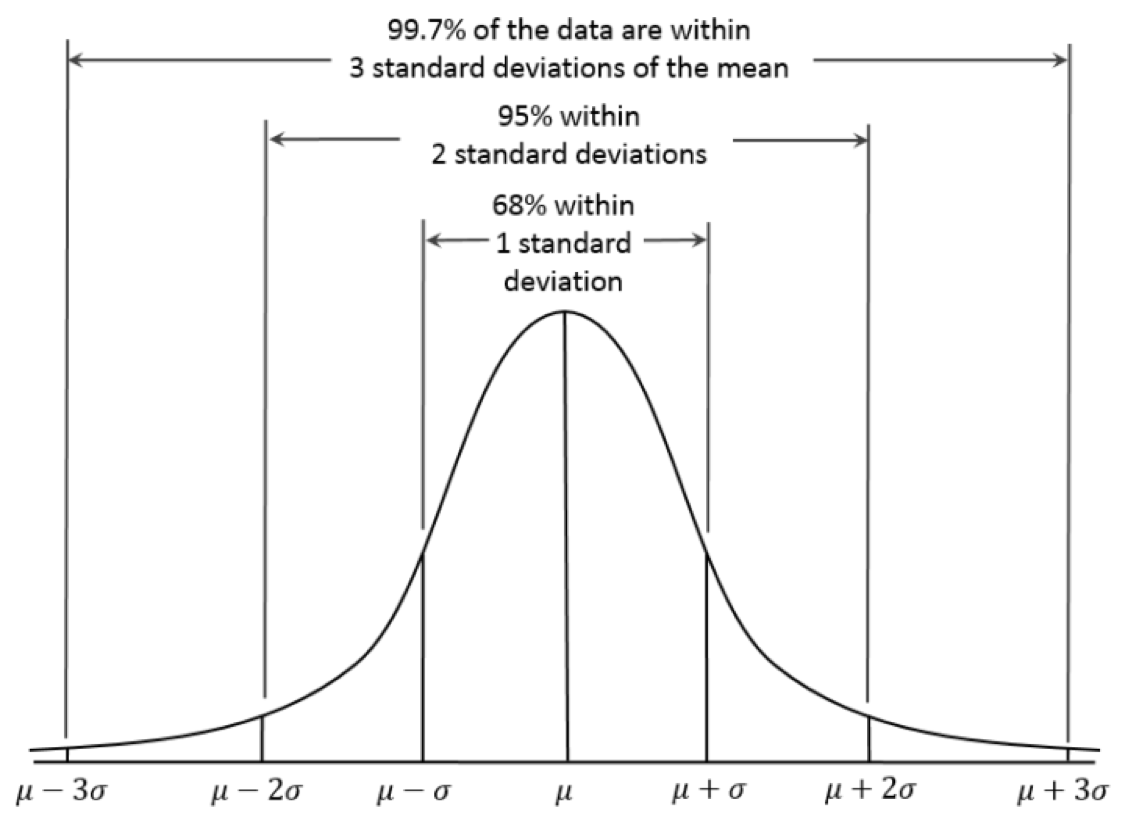
A standard deviation is a measure of how dispersed the data is in relation to the mean. Low standard deviation means data are clustered around the mean, and high standard deviation indicates data are more spread out. There is a nice explanation about it here if you want to read more.
In simpler terms, and in a more relatable way, a lot of the quantifiable things in the world fall close to average, and the extremes (“better” or “worse” than said average) are fewer and farther from it. For example, for every Josh Hader’s 40.2 and Shelby Miller’s 14.1 CSW% there were way more Liam Hendriks’ 27.8%; way, way more. The CSW% distribution for all pitchers through May 5, 2021 looked like this:
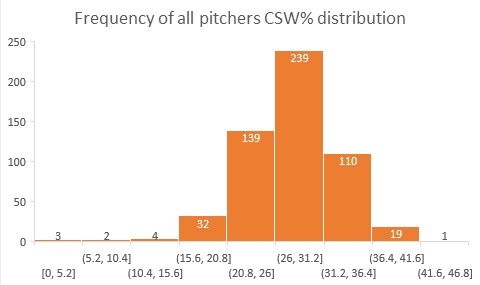
Unsurprisingly, this graph resembles the bell-shaped curve of the normal distribution.
Every bar group, in “bins”, has a number of pitchers whose CSW% is within a standard deviation for that group, so as an example, for a CSW% between 26 and 31.2% there are currently 239 pitchers, but on the high and low spectrum (higher than 41.6 or lower than 10.4) there are very few.
This is the kind of distribution that we can use for an initial rank.
Using this method, let’s rank again our previous list in tiers:
So instead of starting with a full list which we have to dissect into tiers, we can have it divided with a logical criterion, and then we can tweak it to our liking.
To make things easier for you, I have created a simple Google Spreadsheet where you can paste any list of names or items you have with its associate stat, and it will rank it in tiers of one or half standard deviation, as you wish.
Paste the list in the designated area in the “Input” tab, and get the result in the “Summary” tab, that’s it. This is the link: http://bit.ly/sd-x-ranker. You can also download it and use it locally on your computer.
This tool does not create a perfect normal distribution but provides a good and fast approximation, I hope you find it useful.
Featured Image by Jacob Roy (@jmrgraphics3 on IG)
