


The Los Angeles Dodgers come into the 2021 season set to defend their title and look as loaded and ready to go as ever. There is no shortage of quality players out there in Hollywood, so much so that a player such as AJ Pollock may end up hitting in the bottom third of the batting order after what was a great season last year.
Following what was a disappointing first season in Los Angeles in 2019, Pollock had something of a resurgence at the plate last season. He didn’t have to be the brightest star on the team, and maybe that had something to do with it, but in the shortened season, Pollock had his second-best year by wRC+ with a 132 mark.
That number even topped his superb 2015 season with Arizona that officially put him on the map for good, in which he posted nearly seven WAR. His .566 slugging percentage is likely inflated some, but it was an encouraging sign for Pollock, especially after a weak 2019 debut with the team. Of course, that was a shortened season, and while it is all well and good to look back and see what he did last year, we mostly care about whether he has a sustainable profile or not and if that can translate to a fresh season.
When looking at Pollock’s Statcast data, not much looks all that different upon first glance from 2019 to 2020 that would suggest that he took such a big step forward at the plate. It’s not a case such as Marcell Ozuna, where all one has to do is look at all the red in his Statcast profile and see that as the reason why he was so good. Pollock’s profile isn’t bad at all, but it certainly doesn’t scream elite hitter:
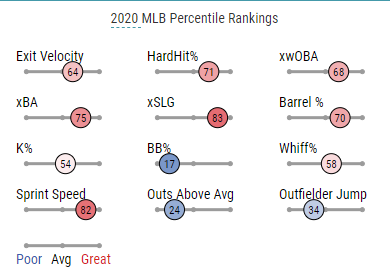
Not much immediately stands out, and again, there isn’t much on the surface that looks all that different in 2020 when compared to 2019. Was he hitting the ball harder? Well, his average exit velocity last season at 89.6 miles-per-hour is right in line with where it’s been for pretty much the entirety of the Statcast era (since 2015). Maybe Pollock has fully gone and embraced the launch angle revolution? That doesn’t look to be it, as his average launch angle has been around 13 degrees the last three seasons, including last season. His barrel rate did improve in 2020, up to 10.5%, but that itself is right in line with where it was in 2018.
In terms of batted-balls distribution, Pollock didn’t all of a sudden pull the ball more, which can often explain why a hitter is suddenly hitting for more power. Pollock is already primarily a pull hitter after all, and he never hit for this much power with a similar profile in the past, so pulling the ball alone doesn’t look to provide much of an explanation.
So while not much looks all that different, Pollock would then maybe be expected to see his performance fall back down a bit, right? Maybe back to his 2019 or 2018 level? Maybe that happens, but also, maybe not. Pollock’s overall Statcast profile doesn’t seem like one that is screaming for regression.
Despite not much being different in terms of the most-frequently cited Statcast metrics, Statcast was, in general, quite a fan of Pollock’s last season as he set new career-bests in three of Statcast’s expected metrics: xSLG (.499), xwOBA (.346, and that’s without getting many favors from his walk rate), and xwOBACON (.423). So, Pollock must have been doing something right and making some improvements that were perhaps a little more subtle, and those differences just don’t immediately jump off the page and require some digging.
Let’s do just that, then. First off, despite a launch angle that’s been in the same neighborhood of 13 degrees the last few seasons, Pollock did actually get more balls in the air last season. Pollock had been trending in the right direction in terms of Air% the few years, but he experienced a decline in 2019 before rebounding big time in 2020:
| Season | AVG LA | FB% | LD% | Air% |
|---|---|---|---|---|
| 2017 | 8.5 | 18.4 | 29.4 | 47.8 |
| 2018 | 13.5 | 29.0 | 22.7 | 51.7 |
| 2019 | 13.7 | 26.1 | 23.1 | 49.2 |
| 2020 | 13.0 | 24.8 | 30.7 | 55.5 |
As for how that stacks up to the rest of the league, 55.7% is well above the league average of around 50%, and in line with other hitters such as Bryce Harper, Francisco Lindor, and Ronald Acuna Jr. This is ultimately a good place to be, especially compared to where he was previously in his career.
These improvements also show up in both sweet spot rate and launch angle tightness. Put simply, these two measures try to measure how efficiently a hitter hits the ball, meaning in the more optimal launch angle groupings. In terms of sweet spot rate, Pollock set a new career-high in 2020, and just like Air%, it was a sharp improvement from where it was the season prior:
| Season | Sweet Spot% |
|---|---|
| 2017 | 35.0 |
| 2018 | 31.5 |
| 2019 | 29.8 |
| 2020 | 37.9 |
Again adding context to how this compares to the rest of the league, Pollock graded out above the league-average here, just as he did in overall Air%. In terms of launch angle tightness (essentially just standard deviation of launch angle, a primer can be found here), Pollock’s 26.7-degree mark ranked quite well and again towards the top of the league. Keeping with what has now developed into a theme, it was much improved over 2019 (remember, lower is better when it comes to launch angle tightness):
| Season | LA Tightness |
|---|---|
| 2017 | 28.6 |
| 2018 | 26.1 |
| 2019 | 28.7 |
| 2020 | 26.7 |
The full sum of things then is that by sweet spot rate, Pollock was hitting the ball more in the better launch angle ranges, and by launch angle tightness, he was doing a better job of maintaining his launch angle, which at 13 degrees, is already in a good spot. All of this is a way to say that Pollock was simply hitting the ball more optimally than in years past, which played a factor in his big 2020 season.
It doesn’t end there, though. To make things even more optimal, Pollock also cut out a lot more of his weaker contact. This shows up when looking at his rate of hard contact as compared to soft contact. While Pollock isn’t one of the game’s hard-hitters, what really dragged him down and affected him more in 2019 was that he was making a lot more soft contact. To get a better view, let’s take his hard contact rate and subtract it from his soft contact rate from the past four seasons, and we’ll see just how much of a turnaround 2020 was compared to 2019:
| Season | Hard% | Soft% | Net Hard% |
|---|---|---|---|
| 2017 | 35.0 | 19.8 | 15.2 |
| 2018 | 44.5 | 11.2 | 33.3 |
| 2019 | 43.7 | 17.2 | 26.5 |
| 2020 | 41.8 | 11.1 | 30.7 |
While Pollock didn’t quite match his 2018 high last year, he did make a considerable improvement in cutting down on soft contact last year, and that 11.1% rate of soft contact is right in line with his 2018 mark. For some more additional context, Pollock’s 2020 Net Hard rate was nearly double the league-average and was inside the top-30 best in 2020, so clearly, Pollock was doing something right in this department last year.
Combine that with the points discussed earlier in that Pollock was hitting more balls in the air and more optimally, and we get a pretty good explanation as to how Pollock had such a successful season at the plate last year. More balls in the air, with less soft contact, at the more optimal launch angle intervals, seems like a good formula to success, and Pollock was a good example of that formula in action last year.
There was one more area, though, in Pollock’s game that subtlety changed last year, and that change has to do with approach. Pollock isn’t some sort of plate-discipline guru, and make no mistake—he didn’t transform into one last season, as his walk rate was a career-low 5.7%.
However, despite that profile, Pollock hasn’t been the typical over-aggressive, swing-at-everything type of hitter that one may picture with such a low walk rate. His swing, zone-swing, and chase rates have all been right around league average and actually slightly above league-average for the last few seasons, and that was the case in 2020 as well. It appears, though, that Pollock made one slight adjustment when it came to plate discipline last year, and that has to do with how often he jumped at the first pitch.
His first-pitch swing rate jumped nearly ten percent up to 37.1%, which was by far the highest rate of his career, and he had one of the top-40 highest first-pitch swing rates in the game last year. It makes sense why Pollock adopted this approach last season when taking a look at the heatmaps. Here is how pitchers were approaching Pollock when he first got into the box to start his at-bats last season:
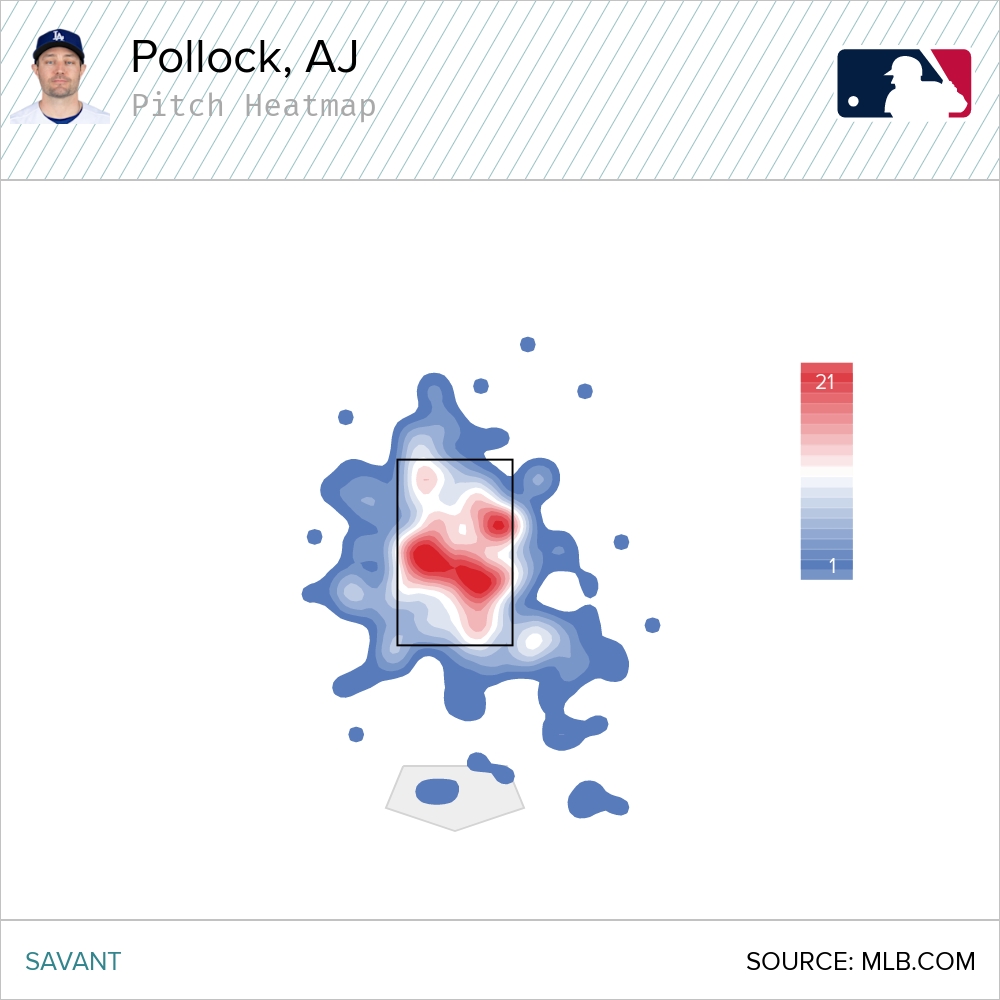
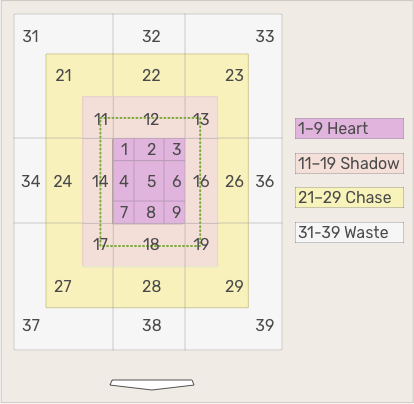
If that looks like a lot of red in the juicy part of the strike zone, that’s because it is. We can even contextualize this by adding in some numbers. Out of Pollock’s 210 plate appearances last season, he saw 76 first pitches that were in the heart of the zone, as defined by Statcast. That was the third-highest rate of first pitches in the heart of the strike zone, and Pollock made pitchers pay for it, as he slugged 1.048 and had a .577 wOBA on contact on those pitches, both among the best in the game.
So, while not much appeared to change for Pollock in terms of plate discipline last season, one subtle change did make a big difference to his overall results. Pollock got a lot more pitches in the heart of the zone to start his at-bats, and he decided to jump on them. As discussed earlier, he was hitting the ball more efficiently in general, which also appeared to be the case on first-pitches, as he did quite a good amount of damage to them.
To wrap up, while Pollock’s overall Statcast profile from last season wasn’t maybe the most impressive or one that maybe didn’t line up all that well with his actual performance, or one that didn’t look all that different from his underwhelming 2019 season, there were some areas of Pollock’s game that did change and improve. They were perhaps a bit more subtle, but those subtle changes did make quite the impact.
Pollock got more balls in the air and was able to get the ball in play more efficiently. Looking at sweet spot rate and launch angle tightness will show this, as Pollock was able to get the ball into the better launch angle intervals more often and maintain his already strong average launch angle better than most hitters.
Additionally, while Pollock didn’t see a jump in his hard-hit rate, he still was able to limit how much weak contact he was making, and making less weak contact is still important. Finally, Pollock also managed to take advantage of the favorable first-pitches that pitchers were leaving him, as he got a super-high rate of them in the heart of the zone, and Pollock jumped on them and crushed them.
While Pollock isn’t the biggest star on a stacked Dodgers team, when looking forward to 2021, he should still be a solid, quality, above-average Major League hitter for the team this year. The adjustments he made in the shortened year should be areas to track in the months ahead because if he has a repeat of 2020, it may have something to do with his subtle yet improved profile from last year carrying forward into this one.
Photo by Ric Tapia/Icon Sportswire | Adapted by Justin Paradis (@JustParaDesigns on Twitter)
