


I spent a lot of time messing around on Alex Chamberlain’s pitch leaderboard because it has things you can’t find anywhere else. Alex (@DolphHauldhagen) is usually a few steps ahead of the rest of us when it comes to doing useful and interesting things with Statcast data.
Among his many creations is the concept of “Launch Angle Tightness,” of which you can find a couple of thorough explanations here. It’s a pretty simple idea that has easy corollaries in conventional baseball wisdom. By taking the standard deviation of the launch angle on all of a hitter’s batted balls, we can get a tiny bit of a sense of a batter’s “hit” tool, and at the very least get a good idea at how consistent their contact is.
We can make that assumption partially because of some other interesting research from Alex demonstrating that hitters are mostly responsible for a batted ball’s exit velocity—that is, whether or not a ball is hit hard is usually a function of how good of a swing the hitter can get off, no matter what else is happening with the pitch. Launch angle, on the other hand, is a different story. The launch angle of a batted ball is much more in the hands of the pitcher. This is because the range of launch angles that are possible to achieve on a batted ball is in some part a function of pitch type and location. It matches up with classic baseball logic quite well. A hitter can technically make contact with the ball in a million different ways, but ultimately, it’s really hard to hit a grounder on a pitch at your face, and it’s really hard to get under a ball at your shoes.
That being the case, it’s fair to say that hitters who are able to consistently generate the same launch angles probably have pretty good bat control. As Alex’s initial article points out, is it surprising that Joey Votto has (or had) the smallest sd(LA) of the Statcast era? Alex also suggested that changes to sd(LA) might be a bellwether for other changes in performance. So while I was doing research on a certain player, and trying to find a new angle on his improvements from 2020 to 2021, I had a bit of a hunch. I went and looked at the biggest decreases in sd(LA) among all players with at least 50 batted balls in both seasons – that is, hitters who have become much more consistent in the kinds of swings they’re putting on the ball – and for possibly the first time ever, I was completely unsurprised at what I found.
Moncada is such a transcendent talent and has already spent so much time in the spotlight in his young career that it’s hard to describe anything he does as quiet (please, watch his music video if you doubt me), but having the most improved sd(LA) in the big leagues is pretty quiet, as far as accomplishments go. Publicly, at least. That leaderboard gets a bit more interesting when you realize that Moncada is quietly lapping the field at third base in overall value, and once you notice that the biggest improvers in sd(LA) also seem to be showing up near the top of the WAR leaderboards, too.
That’s pretty cool, but there’s a lot of nuances that I’m skipping over. Moncada, Semien, and Mullins are all elite or near-elite fielders, which inflates their value quite a bit. And although lower sd(LA) is better and desirable as a rule – hitting the ball consistently in one way or another is usually a good indicator of skill – Chamberlain also points out that there’s some evidence that it reflects the power/contact tradeoff that hitters have been balancing since time immemorial. Hitting the ball at more consistent launch angles didn’t stop JaCoby Jones and his .250 slugging from getting designated for assignment this week.
In theory, it seems that the real sweet spot for trying to pin down whether a hitter is really feeling it would be to find out who has tightened up their launch angle without sacrificing power to do it. Carlos Marcano (@camarcano) recently did some interesting work to that effect exploring what happens when you combine sd(LA) with Connor Kurcon’s Dynamic Hard Hit rate. Plotting those changes in sd(LA) against changes in Hard Hit rate (HH%; the percentage of balls in play hit at 95+ MPH), we see where Moncada stands head and shoulders above the rest, along with a few other slumpers and breakouts.

(h/t Jeremy Siegel (@JerSiegs) for the graphic)
The funny thing, though? Moncada has seemingly lost a ton of power. I threw slugging in that third base chart up there because, well, it’s kind of weird that Moncada is leading all third basemen in fWAR with a slugging percentage 50 points lower than Joey Wendle! In fact, nobody who hits the ball as well as he does has produced as little power as Moncada, and it’s not even close.
2021 xwOBAcon leaders (min. 200 PA)
A. Judge (.597, 13 HR)
R. Acuña (.537, 17 HR)
S. Ohtani (.515, 15 HR)
M. Muncy (.511, 13 HR)
R. Devers (.507, 14 HR)
N. Castellanos (.498, 12 HR)
Y. Moncada (.493, 4 HR)gonna be scary days in the AL when Moncada’s HR luck turns around ?
— Zach (@pinetarkeyboard) June 2, 2021
Randy Holt at Beyond the Box Score recently took a good hard look at Moncada’s sudden power outage, mostly concluding that the pitches he’s swinging at and type of contact he’s making is more conducive to line drive, gap-to-gap power, rather than the 30-homer pop he showed in 2019. The two-month returns on Moncada’s batted ball profile seem to support this.
Whether it’ll continue like this is another story. If there’s one single rule one should know about batted ball profiles like the one above, it’s that line drive rates and straightaway rates are really inconsistent. Big fluctuations in LD% and Straight% are the norm, even though Moncada’s have been unusually consistent year to year. So it’s worth noting that while he is hitting a lot of hard line drives that aren’t leaving the park, it’s hard to say how long that kind of profile will stick around, and what it might be reflective of.
The main question is where those extra line drives are coming from, and where they’ll go once if/when they disappear again. Moncada is hitting the ball on the ground with a touch less frequency than usual, but his GB% and FB% are essentially unchanged from his typical levels. He’s pulling it a little less, but the fact that it’s mostly gone into his Straight% (and the distinction between the two is often nebulous) tells me there’s probably not much there.
All of those new line drives are coming at the expense of popups, of which he’s hit hardly any in 2021 (1.5%) after ranking in the bottom-15% of the league last season at 10.8%. That’s great, but it also begs the question of whether Moncada’s production is sustainable if some of those popups start to come back. Some of them almost certainly will; only ten qualified players last season had a popup rate of 1.5% or better. Is this something to be concerned about, especially since his power output has been so meager to begin with?
…
Back to launch angle tightness! This is where sd(LA) can give us some interesting insights. Better launch angle tightness and a lowered popup rate are going to go hand in hand naturally because popups have some of the most extreme launch angles of any batted ball. Unless there’s a drastic swing change that leads to a lot of balls hit straight into the ground, getting rid of popups is always going to narrow the band of launch angles that a hitter is working within, and lower the standard deviation.
So some of this is tautological, rather than cause-and-effect. But over the course of 150 batted balls, those eight-to-ten popups that are no longer popups shouldn’t be enough to make for the largest sd(LA) improvement in baseball. That improvement isn’t happening in a vacuum. It’s happening as Moncada gets farther removed from the battle with Covid-19 that helped derail his 2020 season (more on that in a minute); it’s happening as his out-of-zone swing rate has plummeted, and as his walk rate has climbed into the league’s top ten while bringing his strikeouts back to 2019 levels. It’s clear just from watching him play: he’s seeing pitches better, being more decisive in his approach, and consistently putting good swings on the ball.
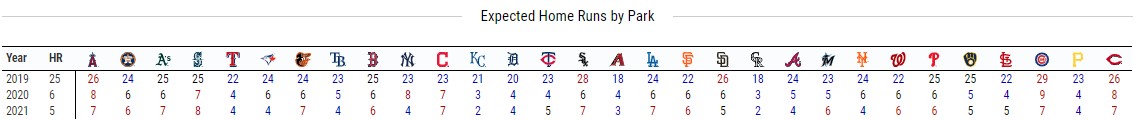
All that is to say that the increase in line drives and decrease in popups doesn’t seem to be totally random. Even if they regress somewhat, it still leaves his production in a pretty solid place. It’s impossible to say if or when the power will show up, but until pitchers figure out new ways to attack him—and they certainly will—it seems like Moncada’s underlying improvements will keep him in a good position to generate power sooner or later. He overperformed his likely true power numbers in 2019, but Statcast thinks his stadium luck has been much more unfriendly this season. Even if his game power winds up being a little bit less than he hinted at two years ago, he’s probably due for a short porch homer or two sometime this year.
…
If like myself, you periodically (much more than periodically, in my case) dip your toes into the rabbit-hole-on-DMT that is White Sox Twitter™, you might be familiar with the roller coaster that has been Yoán Moncada’s career on the South Side. Let’s finish by taking stock of where we were two months ago.
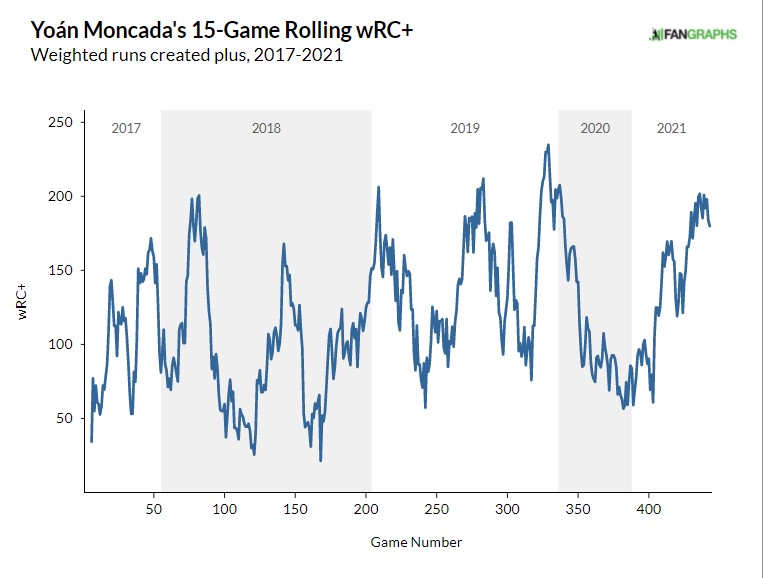
Expectations are high when one is the centerpiece of a trade that gets rid of the best pitcher the fanbase has seen since the Eisenhower administration. One is then considered a monumental disappointment, a bust, a failure when one hits just .234 with nearly 300 strikeouts over their first 200 games with the new club. You don’t trade the second incarnation of Randy Johnson for a 99 wRC+.
So the excitement is more than palpable when that wRC+ jumps from 99 to 140, as it did for Moncada in 2019 when he made The Leap into a player finally worthy of the number-two-prospect-in-the-world status. But the can of worms is opened up again when a bout with Covid derails Moncada’s 2020 season. More than four years after the initial trade, it was still unclear which direction the roller coaster was headed. Was his 2019 just a bit lucky? Or was a poor 2020 simply a function of contracting a deadly disease that’s killed half a million Americans and continues to ravage parts of the world unable to access the vaccines being hoarded by wealthier countries?
Hopefully, that’s a bit of a shock to the system and a reminder of how absurd and dangerous the 2020 season actually was. Fortunately, it seems evident that Moncada’s health and bat are both just fine, with 2020 looking more and more like a regular (albeit disease-induced) aberration for a player who has swung an elite bat more often than not since the start of the 2018 season.
Maybe none of this is particularly new or interesting. There aren’t too many people, I don’t think, who would be terribly surprised to hear that a former consensus top-five prospect has turned into one of the better players in the league. I do think it’s cool to use the ever-expanding arsenal of analytical tools available to us to try to get a peek at the levers moving behind the scenes. For better or worse, the justifiable hysteria that has gripped us for much of the last year and a half expands into our baseball evaluation, too. 2020 muddied the picture for all of us, so while Yoán Moncada being good again might not be news in and of itself, it’s reassuring (to me) to see that at least in baseball terms, there are some concerning parts of 2020 that were ultimately aberrations.
Photo by Nick Wosika/Icon Sportswire | Feature Image by Justin Redler (@reldernitsuj on Twitter)
