


This past offseason, Pitcher List introduced PLV, a new set of metrics. I won’t try to explain the machinations here, suffice it to say they provide us with a more intuitive way to evaluate player performance by dissecting outcomes at the individual pitch level. For example, was this a good pitch? And what might the expected result be based on the quality of the pitch? Basically, PLV provides better context by accounting for variance while assessing player performance. For a much more thorough explanation, be sure to read Nick Pollack’s primer on PLV here.
For reference, the definitions are listed below straight from the source. Grades are on a 20-80 scale.
Swing Aggression: How much more often a hitter swings at pitches, given the swing likelihoods of the pitches they face.
Strikezone Judgement: The “correctness” of a hitter’s swings and takes, using the likelihood of a pitch being a called strike (for swings) or a ball/HBP (for takes).
Decision Value (DV): Modeled value (runs per 100 pitches) of a hitter’s decision to swing or take, minus the modeled value of the alternative.
Contact Ability: A hitter’s ability to make contact (foul strike or BIP), above the contact expectation for each pitch.
Power: Modeled number of extra bases (xISO on contact) above a pitch’s expectation, for each BBE.
Hitter Performance (HP): Runs added per 100 pitches seen by the hitter (including swing/take decisions), after accounting for pitch quality.
Pitch Level Average (PLA): Value of all pitches (ERA Scale), using IP and the total predicted run value of pitches thrown.
Pitchtype PLA: Value of a given pitch type (ERA scale), using total predicted run values and an IP proxy for that pitch type (pitch usage % x Total IP).
Every week, we’ll survey the PLV numbers and see who is performing well and, who isn’t. It could lead us to breakout players or maybe help us better understand why a player might be struggling or doing well. We’re about three weeks into the season, so sample sizes are still flimsy right now. Basically, most things are hectic and there’s still quite a bit of fluctuating. The idea right now is to just get a better description of the results as most values aren’t stable, swing aggression being an exception.
For reference, here are the stabilization points, i.e., when the results tend to become a bit less noisy. They come courtesy of Kyle Bland, one of the very smart and talented people that helped develop PLV. You can follow him on Twitter @blandalytics.
For PLA and Pitchtype PLA, things tend to stabilize at around 500 pitches.
For hitters, it’s a little different.
SZ Judgment and Decision Value: 500 pitches, or roughly 32 games played.
Swing Aggression: 75 pitches, five games played. This is one of the variables that’s stable by now for most players.
Contact: 90 swings, about 12 games played.
Power: 95 Batted ball events, about 35 games played.
The last two depend a little bit on the type of hitter. For example, aggressive hitters will reach it more quickly relative to hitters who are passive and don’t swing as often.
Last week, we surveyed rookie hitters. This week, we’ll start by looking at the PLV report cards for a few hitters that are off to rip-roaring starts. (Note: All PLV data is current through Wednesday 4/19).
Last year, after being traded to the Phillies on August 2nd, Brandon Marsh hit .288 with a .773 OPS across 41 games. He showed some slight gains in contact as his K rate dropped from 36.1% to 31.1% in the second half as you can see below.
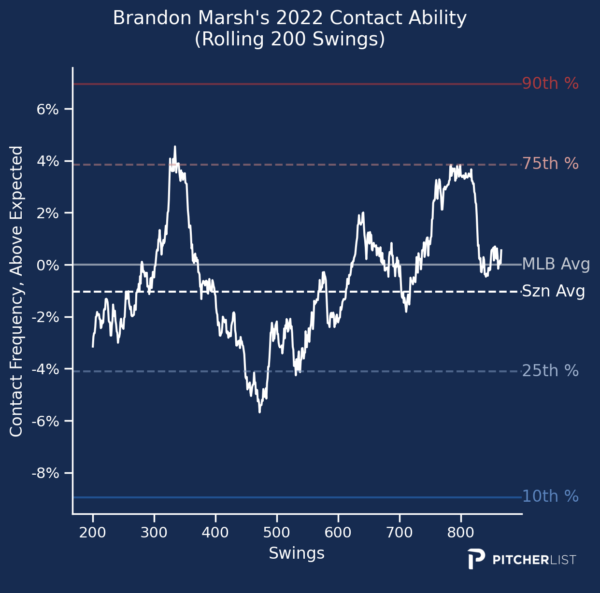
(Note, we don’t have a big enough sample size for rolling charts this year, but they will be included soon.)
This year, Marsh has been one of the most productive hitters in baseball with a 1.156 OPS through 17 games. Again, the sample size is still small but PLV likes his performance so far and we can see some good gains in decision value relative to last year.
He’s been less aggressive this year as his swing rate has dropped from 47.9% to 41.4%. And that’s come with a drop in chase rate from 33.8% last year to 25.2%. His swinging-strike rate is also down a few points too. For a player who has struggled with strikeouts, these are good things that you like to see.
Of course, we can’t expect this level of production. Regression isn’t hard to spot given a .484 BABIP and a .499 wOBA /.406 xwOBA. Still, his contact quality is up noticeably relative to last season: almost 10% in hard contact and a 5% bump in barrel rate. Whether that continues is anyone’s guess but really, this boils down to him swinging at better pitches. On that front, we’re seeing gains as his grades in Decision Value and Strikezone Judgment suggest. Let’s see if they stick as we’re about halfway to the stabilization point.
I think a lot of people thought Matt Chapman might benefit from the trade to Toronto last year. But it didn’t change much as he finished with a .757 OPS. This year, though. Woah. Maybe he had a year-long case of jet lag or something. Who knows. Anyways, he leads everybody with a 1.211 OPS. And, as you might’ve guessed or already noticed, his player page is a work of art, the pinnacle of perfection. If you’re a baseball, now might be the time to look away.
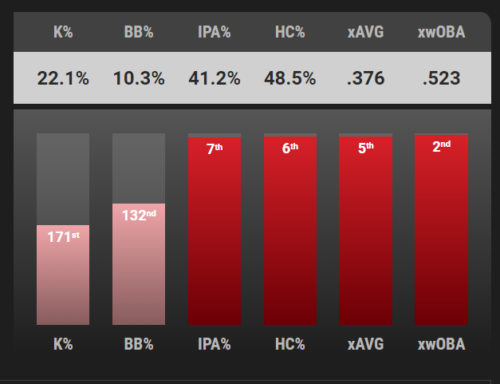
He’s also sporting a perfectly obscene 32.6% barrel rate. As Pete Ball mentioned in his Keep or Kut podcast, Chapman is indeed making more contact. His strikeout rate is currently 22.1% which would be a career-low and nearly five points off his career average. At 29, it’s odd to see his strikeout rate suddenly fluctuate, so I’m inclined to think it’s noise. But last week, Esteban Rivera at FanGraphs noted a change in Chapman’s stance, a toe tap that he had early during his career in Oakland. Maybe that’s the secret behind his surge? Whatever the case, PLV is taking note of the gains in contact and power.
I’m a little skeptical that he’s all of a sudden in a new tier so to speak. But, the early results are so loud that it’s getting hard to ignore the fact that he might be reaching a new baseline. As you’ll recall, power takes about 35 games/95 BBE to stabilize, we are just over halfway there, so we’ll see if he can keep it up.
Drafted by the Cardinals back in 2012, Patrick Wisdom got his first real chance two years ago with the Cubs and has since banged out 61 home runs in just under 1000 PA, good for a .785 OPS. This year, he’s off to a strong start with a 1.059 OPS through 18 games. The problem, as Randy Holt notes here, is that he strikes out a ton.
Drafted out of high school by the Cardinals 19th overall in 2018, Nolan Gorman’s profile has always featured a ton of power. We saw that last season as he debuted and hit 14 home runs in 89 games. But strikeouts held him back as he ended the year in the minors. And that’s something that has also been a part of his scouting report: Last year, he had a 36.7% strikeout rate in 43 games with Triple-A Memphis. This year, though, he’s off to a promising start with a 1.052 OPS through 17 games.
Gorman’s abundant power is represented by a barrel rate and xwoBACON both just outside the top ten percentile. But he’s also being more selective at the plate: His Swing Aggression is down a point and his overall swing rate is down almost five points. He’s also cut his chase rate from 32.6% to 23.4% which is reflected in considerable gains in SZ Judgement and DV. The results have been encouraging as his strikeout rate has dropped from 32.9% last season to 23.3%. If he can hold onto the gains in plate discipline, his power could make him an exciting breakout player.
No, you’re not dreaming. It’s finally happened. After years of ground balls galore, we’re now all living in Yandy Land. I’ll keep it short, as Díaz’s groundball rate has been a talking point for as long as anyone can recall. But that’s all changed. Or at least, it looks that way as his flyball rate has skyrocketed from 26.8% to 44.4%. Earthworms rejoice. About three weeks in and he’s two-thirds the way to matching last year’s home run total which he reached in a career-high 558 PA.
His exceptional plate discipline is still there, but the only difference seems to be that he sacrificed a little bit of contact (strikeout rate up about 4%) for some considerable gains in power: 96th percentile xwOBA, 88th percentile xwoBACON, and 87th percentile barrel rate. Is this finally the year? The early returns are promising.
This breakout is a little less loud than the other ones. But, hey, someone has got to lead the Tigers in OPS. Kerry Carpenter busted out a .422 wOBA and 1.005 OPS across 63 games with Double-A Erie. He replicated those rates in 35 games with Triple-A Toledo before getting called up to Detroit late last year where he quietly produced a .342 wOBA and .795 OPS in 31 games. As Alex Chamberlain mentioned before the season on FanGraphs, it was an impressive performance.
The sample size is really small, but so far, he’s looking good. The power has shown up with a 97th percentile barrel rate and an 82nd percentile xwoBACON. And he’s cut his K rate this year from 28.3% to 23.7%. He’s also chasing a bit less. We’ll see if that sticks. He should get plenty of opportunities to prove himself on a Tiger team that simply doesn’t have many other options right now.
Top Ten SPs by PLA (So far)
Again, PLV and PLA (ERA version of PLV) tend to stabilize at around 500 pitches, so we’re not there yet. This is just to have a little fun and see what the early results look like. I trimmed the list to a minimum of 300 pitches just to give us a round number. That left out George Kirby (270 pitches, 2.07 PLA) and Nestor Cortes (262 pitches, 2.36 PLA). Note: This doesn’t include Cortes’ most recent start this past Thursday against LAA. Michael Wacha also graded out well (271 pitches, 2.50 PLA) but that was before his latest rough outing against the D-Backs.
It’s interesting to see Dustin May so high on the list despite the lack of strikeouts. His sinker has been terrific so far earning a PLA of 1.11. That’s the best sinker from any SP so far. Nick Lodolo’s is second at 1.26.
Drew Rasmussen continues to look like one of the best values of this year’s draft. His four-seamer has returned a PLA of 1.97, that’s tied with Gerrit Cole’s four-seamer and just behind Kirby (1.96). The best fastball from any starter so far? That would be Yusei Kikuchi at 1.86. Just like we drew it up.
Pablo López has been one of this year’s early breakouts and rounds out the top ten. His new slider has been fantastic and has returned a 1.74 PLA. That and his improved fastball velocity have fueled a massive spike in his K rate from 23.6% to 33.7%. Just behind him is Sandy Alcantara (355 pitches, 2.54 PLA).
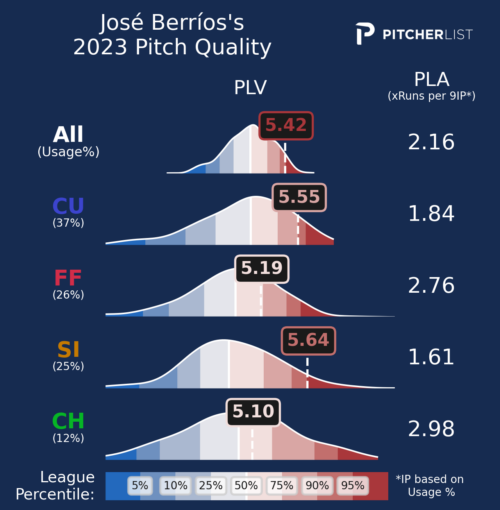
Obviously, the name that sticks out like a sore thumb is José Berríos. I’m not sure what to make of him. The one thing that struck me when I looked at him this offseason was his four-seamer: it was really hit hard with a .410 xwOBA allowed. Of course, we’ve seen Berríos be very effective before but because his fastball seems so vulnerable it makes me think that his path to success is a narrow one.
Nevertheless, PLV is telling us to at least keep an open mind. If you’re holding out hope for a rebound, his pitch quality chart will provide some added incentive. He’s got a tough test up next against the Astros.
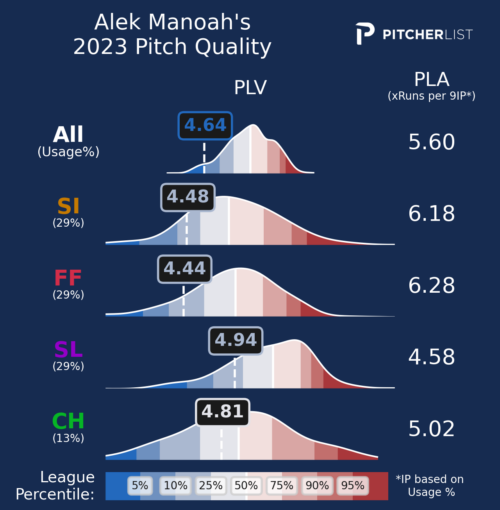
We’ll end by looking at a pitcher who has really struggled so far, Alek Manoah. Unlike his aforementioned teammate, PLV is a little bit more pessimistic regarding his struggles. Below you’ll find his pitch quality chart for 2022 (left) and 2023 (right).
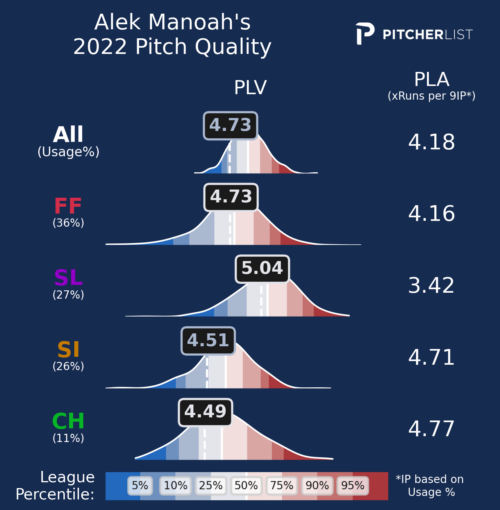
Manoah posted a spotless 2.24 ERA and 0.99 WHIP across 31 starts last year but was a not-so-sneaky regression candidate based on a good but not great 16.4% K-BB and 3.34 xERA. Similarly, he graded out with a 4.18 PLA overall last year so spotting potential regression wasn’t difficult. Still, no one was expecting anything this bad.
The picture that PLV is painting here isn’t great with big declines in his four-seamer and sinker. In his last start against the Rays, his sinker (25 pitches) was charted with a PLA of 8.64. His four-seamer (30 pitches) was a little better, but not much with a PLA of 6.58. Not good. If you’re looking for a silver lining, his slider (28 pitches) was at least decent with a PLA of 3.84.
His massive walk rate of 15.5% really seems odd considering he’s never had a walk rate over 10% in his entire pro career (8.7% in 2021). As Nick Pollack mentioned in one of his recent SP roundups, Manoah just plain looks all out of whack, and nothing seems to be working. Given his success last year, it wouldn’t be a surprise at all to see him bounce back. But based solely on what we’ve seen so far, his outlook seems shaky at best.