


A few months ago I took a look at how hitter prospect tool grades manifested in MLB. Here I am going to try the same exercise on pitching prospects.
As a refresher, the skills or tools of baseball prospects are frequently graded on a 20-80 scale. At first, this may seem arbitrary, but apparently, it is fairly common. 50 is average. Each level is one standard deviation from the average. 40 is one standard deviation below, 60 is one above, 30 is two below, etc. These 3 standard deviations above and below capture 99.7% of what is below a normally distributed curve, that is why there is little need to go beyond 20-80. Sometimes tools will receive a “half” grade of 55 for example. You will sometimes also see the scale described as 2-8.
Hitter tools are typically broken down into Hit, Power, Raw Power, Speed. These are fairly easy to convert into outcome-based stats.
Pitcher Tool Breakdown
Pitching grades are a little different. Each pitch receives a grade and the overall command/control is also graded. FanGraphs gives a Future Value, while MLB Pipeline gives an Overall Grade. I believe this is just different nomenclature.
I imagine most teams include much more detail, such as command of individual pitches, deception, etc., but most of us do not have access to these detailed evaluations. Also, most of us do not have the time, ability, and/or camera angle to evaluate each pitching prospect. I am amazed when I sometimes see minor league video quality that reminds me of the highlights from my 11:00 pm local news broadcast from a Rookie Ball team (Utica Blue Sox) circa 1996. Therefore, we rely heavily on these publicly available grades for prospect analysis.
Seeing how individual pitch grades translate into MLB outcomes is somewhat challenging. Location, sequencing, and usage of course play a large role in pitch outcomes. Recently Statcast introduced Run Value (RV). This measures how much each pitch increases or decreases run potential in any given situation. For example, a pitch that results in a strikeout in a bases-loaded situation greatly reduces run potential, resulting in a negative RV. A ball to start an inning slightly increases run potential, resulting in a positive RV. For each pitch type this is measured cumulatively for a pitcher, and on a per 100 basis (RV/100).
Unfortunately, Run Value stats are only available dating back to 2019 and for this article, I am looking at numbers going back to 2014. I also could not find a way to export multiple seasons’ worth of RV’s. Because of this, I used FanGraphs’ Pitch Values (PV). Honestly, I’m not sure the difference between how they are calculated. I’m guessing there is a slight difference in how outcomes are weighed. In 2021, many of the pitch scores are identical or very similar. If I had been able to look at RV’s dating back to 2014 I don’t think they would be much different than the PV’s. To even the playing field I used PV/100 pitches (wFB/C, wSL/C, etc.). Positive PV’s represent good outcomes for pitchers.
I will also take a look at the wOBA’s for individual pitches, as well as some traditional metrics.
Past Tool Grades
I pulled pitcher tool grades dating back to 2013. Most prospects were on top 100 lists, but not all. I estimate about 75% of the grades were pulled from FanGraphs and 25% from MLB Pipeline. For all prospects, I used the most recent grades they received before losing prospect status. Prospects will usually get a Present and a Future Grade for each tool. All of my calculations are based on the Future Grade because the players I included have thrown a fair amount of pitches in MLB.
These sites give a fastball (FB), slider (SL), curveball (CB), and changeup (CH) grade. They do not break these pitch types down into their sub-types. They also cannot account for a change in pitch type/quality throughout a career. Maybe an individual received a 40 grade on a four-seamer in the minors and scrapped that for a better two-seamer in the big leagues. I could not account for such details, so everything is simplified and grouped together.
MLB Correlations
I ran a correlation with each tool grade and various stats. The closer the coefficient is to a positive or negative one, the stronger the correlation. A negative number indicates that a higher grade is correlated to a lower outcome stat, and vice versa. Generally, anything above .7 is considered a strong correlation, between .5-.7 moderate, and less than .5 is weak. However, for baseball I would bring those thresholds down to above .5 being strong, .3-.5 moderate, and less than .3 to weak.
In the table below I’ve highlighted in blue the cells where the pitch grade corresponds with the appropriate pitch-specific outcome for ease of viewing. The orange highlights what I found most interesting. Fastball grades have the strongest correlation with slider outcomes. Unsurprisingly, fastball grade is strongly correlated with velocity, with an r of .68. Based on the table below it seems that slider effectiveness goes hand-in-hand with fastball velocity. This is also not surprising. How fastball grade correlates with curveball wOBA is also fairly interesting. The other correlations on the table are pretty low on the surface. However, given all of the variables that go into the success of individual pitches, how everything is interlocked, seeing any kind of correlation at all gives one confidence in prospect grades.
I also ran some correlations between total package grades and overall outcome stats (i.e. ERA, WHIP, K%, and BB%). %Start-IP is the percentage of innings pitch as a starter. Command is the grade for all pitch types. Future or Overall Value attempts to sum up a pitcher’s total future value. Average Stuff is the average of each pitch grade for a player. Average Stuff + Command is exactly as it sounds. Lastly, for the heck of it, I totaled the pitch grades of each pitcher. This will of course favor pitchers who throw the most pitch types.
The fairly strong correlation of Command with BB% is expected. The better the Command the lower the BB%. I’ll also point out that the better the Command grade, the higher percentage of IP as a starter. Guys with poor command frequently end up in the bullpen. Because Total Stuff reflects the number of pitch types a guy throws it is also nice to see that correlate fairly well with %Start-IP. All very reassuring. A prospect with low Command and Total Stuff scores is likely to end up in the bullpen. I’ll leave the rest of these numbers for you to break down.
MLB Translations
How have these bucket grades actually converted to big-league stats? There are so many relationships here I’ll focus on a few.
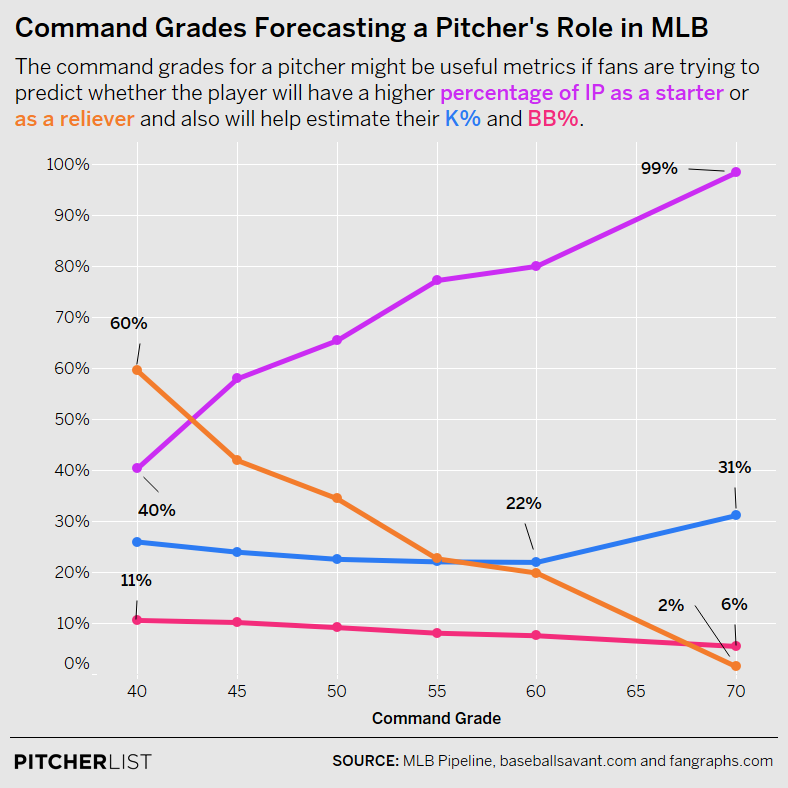
Data Visualization by @Kollauf on Twitter. Note: Shane Bieber is the only player sampled here that received a 70 command grade
To me, this is the strongest takeaway, albeit the most obvious. Command grades translate the most readily to MLB. BB% drops steadily with increasing Command grades. If you’re looking at prospects that are most likely to be long-term starters it seems like a Command grade of 55, or at least 50, is very important.
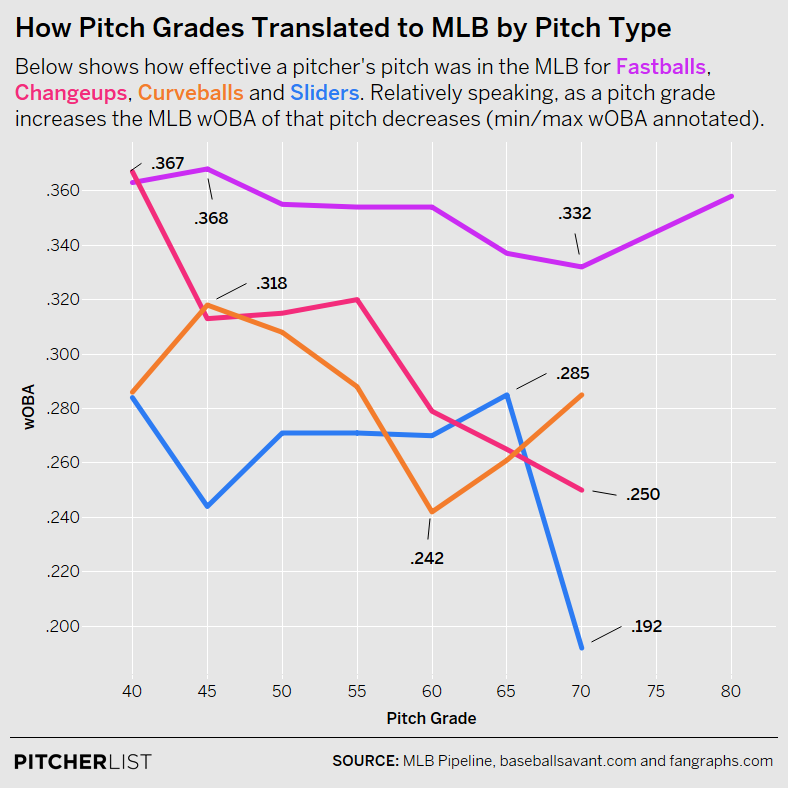
Data Visualization by @Kollauf on Twitter
As I mentioned earlier, looking at grades of individual pitches can be challenging, but better grades generally lead to lower wOBAs. Results for xwOBAs were very similar.
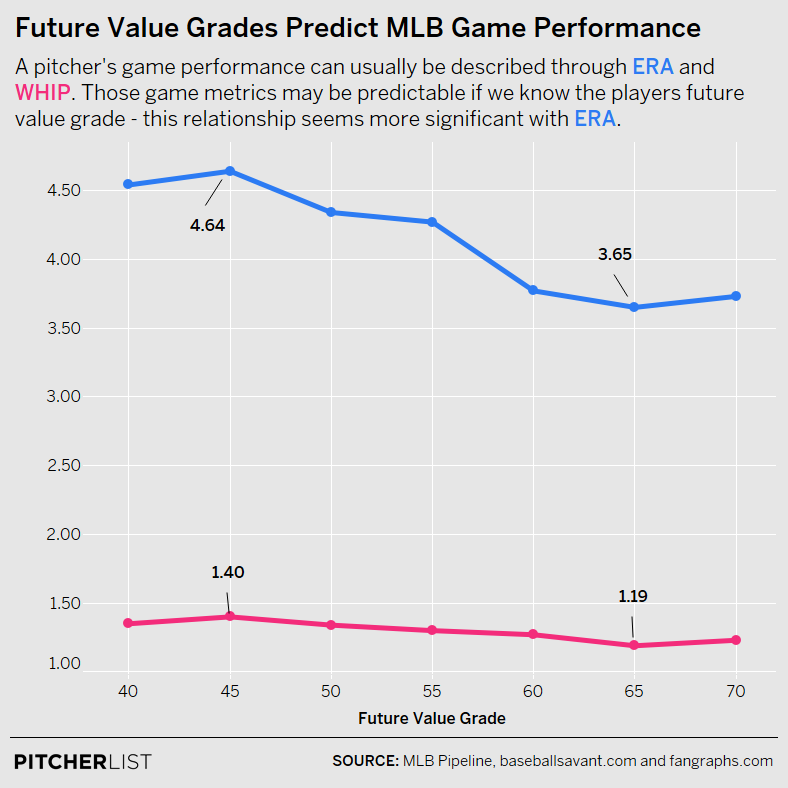
Data Visualization by @Kollauf on Twitter
Along with overall Command, Future (or Overall) Value is the most straightforward way to evaluate a prospect. As seen here they reflect well in the all-important ERA and WHIP fantasy categories.
Final Thoughts
Much above reaffirms beliefs that have long been held about pitching. Pitchers with strong command stand a better chance at being starters at the MLB level and maintaining a low BB%. Better stuff leads to a higher K%. Higher fastball velocity leads to better results not only on the fastball but for the other pitches in a repertoire.
Comparing pitch grades with outcome metrics may provide an opportunity to find pitchers that are outperforming or underperforming their individual pitch quality because of command, deception, and/or usage. It would also be interesting to compare grades for young pitchers with Stuff+, a metric often cited by Max Bay and Eno Sarris. I don’t know exactly what goes into Stuff Plus, but I’m sure it is entirely quantitative. Prospect pitch grades are typically some combination of quantitative and qualitative information. If a prospect’s tool grades align with their Stuff+, even with a small sample size, you can feel pretty confident in their early-career MLB results.
Photos by Dustin Bradford/Icon Sportswire, NeonBrand/Unsplash, Chris Chow/Unsplash | Adapted by Ethan Kaplan (@DJFreddie10 on Twitter and @EthanMKaplanImages on Instagram)
Andrew, good read that (mostly) confirms my perceptions. I’m curious about your thoughts on Josh Fleming. He has a 70 Command rating with all other tools rating as average or below. In 78 MLB innings, he sports a 2.90 ERA, 1.06 WHIP and a 23.9% CSW% with a 10-3 W-L record. It seems like he, and others that fit this mold, are somewhat under-appreciated (e.g. John Means before his 2020 season). Thanks
I agree that command guys can be underrated. The only player in my dataset that had a 70 Command grade was Shane Bieber. That may be a bit too high of a ceiling for Fleming. Bieber’s other grades were better also. Others that had similar grades to Fleming are Alec Mills, Jaime Barria, Steven Brault, Ty Blach, and Kyle Freeland on the high end. They all had 60 Command grades.