


A year ago, I dove deep into the descriptive and predictive value of the major ERA skill indicators: FIP, xFIP, and SIERA. What prompted me then was the ubiquitous use of these metrics without a proper foundation. I myself was guilty of this from time to time. What I found was that, in a single season, FIP was most highly correlated with ERA, while SIERA and xFIP were far more predictive of a pitcher’s ERA in the next season than his ERA or FIP the season before, with a slight edge going to SIERA.
What’s prompting me to return to this topic is the advent of xERA by Baseball Savant. Now, if you go to Statcast’s expected statistics leaderboard, you’ll find on the right-hand side each pitcher’s xERA and the differential between that value and his ERA. Before I began using xERA for my player evaluations and rankings, I wanted to know whether it was actually useful.
Besides, I also wanted to expand the data sample from my original article, in which I only considered 2017-18 numbers. Instead, this survey evaluates the descriptive and predictive value of each ERA skill indicator from 2015-19. More on that in a bit.
Definitions
First, it’s important to understand the difference between these metrics and why some might be more valuable than others. ERA, FIP, xFIP, and SIERA are all available on FanGraphs’ player pages, while xERA, as noted above, can be found on the Statcast leaderboards. Consider also their definitions from Statcast’s glossary:
- Earned Run Average (ERA) – Earned run average represents the number of earned runs a pitcher allows per nine innings—with earned runs being any runs that scored without the aid of an error or a passed ball.
- Fielding Independent Pitching (FIP) – FIP focuses solely on the events a pitcher has the most control over—strikeouts, unintentional walks, hit-by-pitches, and home runs. It entirely removes results on balls hit into the field of play.
- Expected Fielding Independent Pitching (xFIP) – xFIP takes a pitcher’s FIP, but it uses a projected home-run rate instead of actual home runs allowed. The home-run rate is determined by that season’s league average HR/FB rate.
- Skill-Interactive Earned Run Average (SIERA) – SIERA quantifies a pitcher’s performance by trying to eliminate factors the pitcher can’t control by himself. For instance, SIERA is park-adjusted. Moreover, unlike FIP and xFIP, SIERA considers balls in play and adjusts for the type of ball in play. SIERA punishes high-walk pitchers more for each additional walk than regular pitchers. It rewards high-strikeout, high-ground-ball, and high-fly-ball pitchers for each additional strikeout, ground ball, and fly ball, respectively. FanGraphs provides a helpful overview as to why.
- Expected Earned Run Average (xERA) – Expected ERA, or xERA, is a simple 1:1 translation of Expected Weighted On-Base Average (xwOBA), converted to the ERA scale. xwOBA takes into account the amount of contact (strikeouts, walks, hit by pitch) and the quality of that contact (exit velocity and launch angle), in an attempt to credit the pitcher or hitter for the moment of contact, not for what might happen to that contact thanks to other factors like ballpark, weather, or defense.
Correlations
First, let me shout out Tim Richer (@tricher00), who helped me collect the data for this article. To begin, it’s helpful to see which metric had the best in-season correlation with a pitcher’s ERA. For a sufficient sample, we identified all pitchers with 100 IP in any season from 2015-19. There were 686 such seasons.
Our methods included regressions, which tell us the coefficient of determination (R2) between two or more variables and illustrate how much variance in the sample of a dependent variable (e.g., ERA) is explained by an independent variable (e.g., FIP). The higher the R2, the greater the independent variable explains changes in the dependent variable (though R2 will never exceed 1).
| ERA Indicator | R2 |
|---|---|
| FIP | 0.61 |
| xFIP | 0.38 |
| SIERA | 0.38 |
| xERA | 0.58 |
For example, 61% of the variance in the 686 ERAs was explained by FIP. As you can tell, that was the highest of any ERA indicator, with xERA trailing shortly behind. In other words, say you plotted all of the 686 ERAs against each of the associated FIPS, xFIPs, SIERAs, and xERAs, and generated equations for predicted ERA based on those metrics. Plugging in a pitcher’s FIP to the FIP equation to get a predicted ERA value, on average, would give the closest result of the four indicators to the pitcher’s actual ERA.
One conclusion we can draw is that FIP correlates most strongly to ERA in-season. It will be the most useful for explaining whether, looking backward, a pitcher has really earned his earned run average or has gotten (un)lucky to date. Likewise, xERA is almost as good for the same purpose.
Predictiveness
To determine the relative predictive value of each metric, we applied the Root Mean Square Error (RMSE) because it is a measure of predictiveness rather than correlation. Additionally, the value of RMSE lies in its intuitiveness. The RMSE is the square root of the standard deviation of residuals (prediction errors). In laymen’s terms, it is a measure of how spread out your model’s values are from the line of best fit between two samples.
In this case, we used data from 2015-19 again, but a pitcher had to have 100 IP in back-to-back seasons to qualify for the study. There were 354 such back-to-back 100 IP seasons in that time. Then, we compared each skill indicator (as well as ERA, as a baseline) for each pitcher in the first season to his ERA in the next.
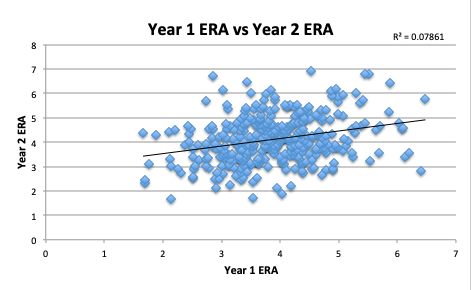
Let’s start by examining the predictive value of a pitcher’s ERA in one season to the next. The RMSE is 1.113. As I noted, RMSE is the average distance of our model values from the line of best fit. What’s great about RMSE is that it’s measured in terms of the samples’ units. Therefore, if the RMSE is 1.113, using ERA in year X to predict ERA in year X+1 creates an average error of 1.113 runs. Frankly, it’s a pretty huge error, considering there’s a significant difference between a 3.00 ERA and a 4.11 ERA. It’s also unsurprising that the R2 between the samples is so low: 0.079.
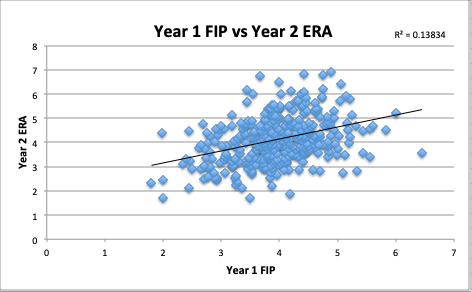
Next, consider the predictive value of FIP for ERA in the following season. The RMSE for this sample was, indeed, lower than using ERA to predict itself: 0.968. That’s a substantial improvement, and is also reflected in the 0.14 R2. While there’s still about an average error of an entire run, the predicted ERA based on FIP from the prior year is 0.145 runs closer, on average, to the pitcher’s actual ERA in the next year.
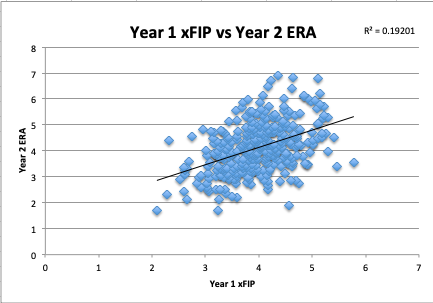
Notably, xFIP is even more predictive of future ERA than either FIP or ERA. Now, the RMSE is down to 0.892, so the line of best fit between xFIP values and predicted ERA values for next season based on those xFIP values is closer, on average, to the actual observed ERA values in the second season. The xFIP sample explained 19.2% of the variation in the subsequent season ERA sample.
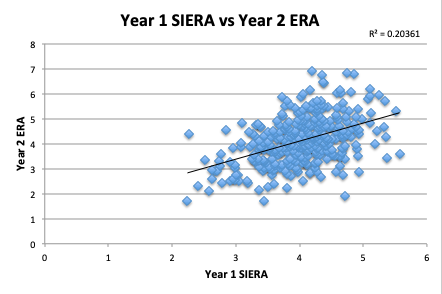
As we will see, SIERA is the most predictive of our ERA indicators, though it is only slightly better than xFIP. SIERA’s relatively low 0.871 RMSE indicates that predicted future values for ERA based on SIERA were the closest to the actual future ERA. Predicted ERA based on SIERA is 0.242 runs closer, on average, to actual ERA than predicted ERA based on ERA from the prior season.
Finally, our newest metric, xERA, was less predictive of ERA than xFIP and SIERA, about the same as FIP, and better than just using ERA. The 0.965 RMSE shows that, like FIP, xERA produces an average error of about one run when predicting ERA.
| Metric | R2 |
|---|---|
| ERA | 0.079 |
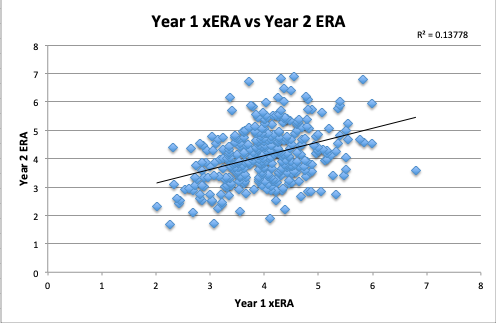
| FIP | 0.138 |
| xFIP | 0.192 |
| SIERA | 0.204 |
| xERA | 0.138 |
| K-BB% | 0.224 |
Really, what I should say is how little any of these metrics actually are predictive of ERA. The best of the bunch, SIERA, only explains 20.4% of the variance in subsequent-season ERA. In fact, you’re better off using K-BB% to predict future ERA than any of these ERA indicators. If you’re looking to do so, just plug in a pitcher’s 2019 K-BB% to the following formula: -0.0861*(K-BB%) + 5.3793. That formula is derived from taking all of the pitchers with back-to-back 100 IP seasons and plotting their K-BB rates in the first season against their ERAs in the second. For instance, Clayton Kershaw’s 2020 predicted ERA would be: -0.0861*(21.0) + 5.3793 = 3.57.
Conclusion
As a matter of correlation, FIP and xERA are excellent indicators for determining whether a player has earned his ERA. What we’ve learned about xERA is that it is most useful for in-season evaluation and may serve as a helpful check against a pitcher’s FIP.
Although every ERA indicator is a better estimator of future ERA than ERA itself, none offer a marked improvement. In fact, K-BB% is better than all of them. We still yearn for something better.
Photo by Icon Sportswire | Feature Graphic Designed by James Peterson (Follow @jhp_design714 on Instagram & Twitter)
