


“Some guys all have all the luck,” once sang Rod Stewart. And though I Don’t Want to Talk About It, players won’t stay Forever Young and so we’re tasked to determine if a hitter’s slump is a product of bad luck and a temporary rough spot and if there’s Reason to Believe they’ll turn it around.
This isn’t about the guys with all the luck, though. Or even the discography of Rod Stewart. This is about the players who are hitting into the worst kind of luck. Rather than facing nasty pitchers, missing the ball by a quarter of an inch off the barrel, or simply having a bad day, these batters are doing everything right within their power, and still making outs. It’s those rockets that are hit right at a fielder; the moon shots that are a homer in every park except the one they’re playing in that night.
Who are the tough-luck-out leaders in baseball, and what can we learn from them?
In an attempt to figure it out, I pulled every pitch that was an out from 2021 and looked at which ones had an expected batting average (xBA) of greater than .500. In other words, these plays all had a greater than 50% chance of going for a hit based on their exit velocity and launch angle, yet they went down as outs. Here are the leaders for 2021 by the percentage of pitches that went for what we’ll call “tough luck outs,” with a minimum of 500 pitches seen:
| Player | Tough Luck Outs | Pitches Seen | % TLO |
| Brantley, Michael | 21 | 680 | 3.1 |
| Blackmon, Charlie | 19 | 644 | 3 |
| Tucker, Kyle | 22 | 838 | 2.6 |
| Seager, Corey | 15 | 584 | 2.6 |
| Benintendi, Andrew | 18 | 729 | 2.5 |
| Albies, Ozzie | 19 | 828 | 2.3 |
| Smith, Pavin | 17 | 755 | 2.3 |
| Hernández, Teoscar | 13 | 555 | 2.3 |
| Ramírez, José | 19 | 859 | 2.2 |
| Pujols, Albert | 11 | 508 | 2.2 |
| Hicks, Aaron | 11 | 511 | 2.2 |
| Arenado, Nolan | 17 | 827 | 2.1 |
| Aguilar, Jesús | 16 | 774 | 2.1 |
| Fletcher, David | 16 | 747 | 2.1 |
| Longoria, Evan | 15 | 701 | 2.1 |
| Dozier, Hunter | 11 | 528 | 2.1 |
| McMahon, Ryan | 16 | 819 | 2 |
| Olson, Matt | 16 | 814 | 2 |
| Polanco, Jorge | 15 | 749 | 2 |
| Dahl, David | 12 | 588 | 2 |
| Dalbec, Bobby | 12 | 597 | 2 |
| Alonso, Pete | 11 | 550 | 2 |
| Conforto, Michael | 11 | 539 | 2 |
| Freeman, Freddie | 16 | 844 | 1.9 |
| Ohtani, Shohei | 15 | 796 | 1.9 |
| Franco, Maikel | 14 | 737 | 1.9 |
| Margot, Manuel | 12 | 644 | 1.9 |
| Smith, Dominic | 12 | 618 | 1.9 |
| Acuña Jr., Ronald | 14 | 784 | 1.8 |
| Adames, Willy | 13 | 711 | 1.8 |
| Castro, Starlin | 13 | 722 | 1.8 |
| Crawford, Brandon | 12 | 661 | 1.8 |
| Soto, Juan | 12 | 672 | 1.8 |
| Lux, Gavin | 11 | 615 | 1.8 |
| Farmer, Kyle | 10 | 564 | 1.8 |
| Calhoun, Willie | 10 | 556 | 1.8 |
| Hays, Austin | 9 | 505 | 1.8 |
| Judge, Aaron | 15 | 870 | 1.7 |
| Kiner-Falefa, Isiah | 14 | 810 | 1.7 |
| Verdugo, Alex | 13 | 763 | 1.7 |
| Díaz, Yandy | 13 | 746 | 1.7 |
| Altuve, Jose | 12 | 701 | 1.7 |
| Donaldson, Josh | 11 | 636 | 1.7 |
| Bote, David | 11 | 646 | 1.7 |
| Hernandez, Cesar | 14 | 871 | 1.6 |
| Seager, Kyle | 13 | 825 | 1.6 |
| Candelario, Jeimer | 13 | 833 | 1.6 |
| Story, Trevor | 13 | 832 | 1.6 |
| Frazier, Adam | 13 | 835 | 1.6 |
For Charlie Blackmon and Michael Brantley, three percent of the total number of pitches they’ve seen have had an expected batting average of .500 or greater, only to darken the confusing “outs” indicator on the new Bally Sports Network broadcasts.
Assuming half of those pitches fell into fair territory as they would more often than not, that would raise Charlie Blackmon’s batting line to a .263 average and a .400 OBP, compared to his current .250/.353.
Kyle Tucker, while not as high of a percentage of his total pitches seen are of the “tough luck out” variety, leads MLB with 22 TLOs. The projections for Tucker coming into the season were high on both his power and speed but with a pedestrian batting average. He has pretty much lived up to that to this point, with a .250 batting average to go along with his 11 homers and five steals. But if you assume that half of his TLOs went as hits, as we’d expect, his average would be over .300 at this point of the season. Kyle Tucker is a fantasy superstar before our eyes, is what I’m saying.
But, so what. We have other ways of knowing if a batter is having a bad streak or likely to regress to their mean. To test the randomness of TLO, Pitcher List’s data scientist Justin Filteau ran a correlation on TLO from 2017-18 and 2018-19:

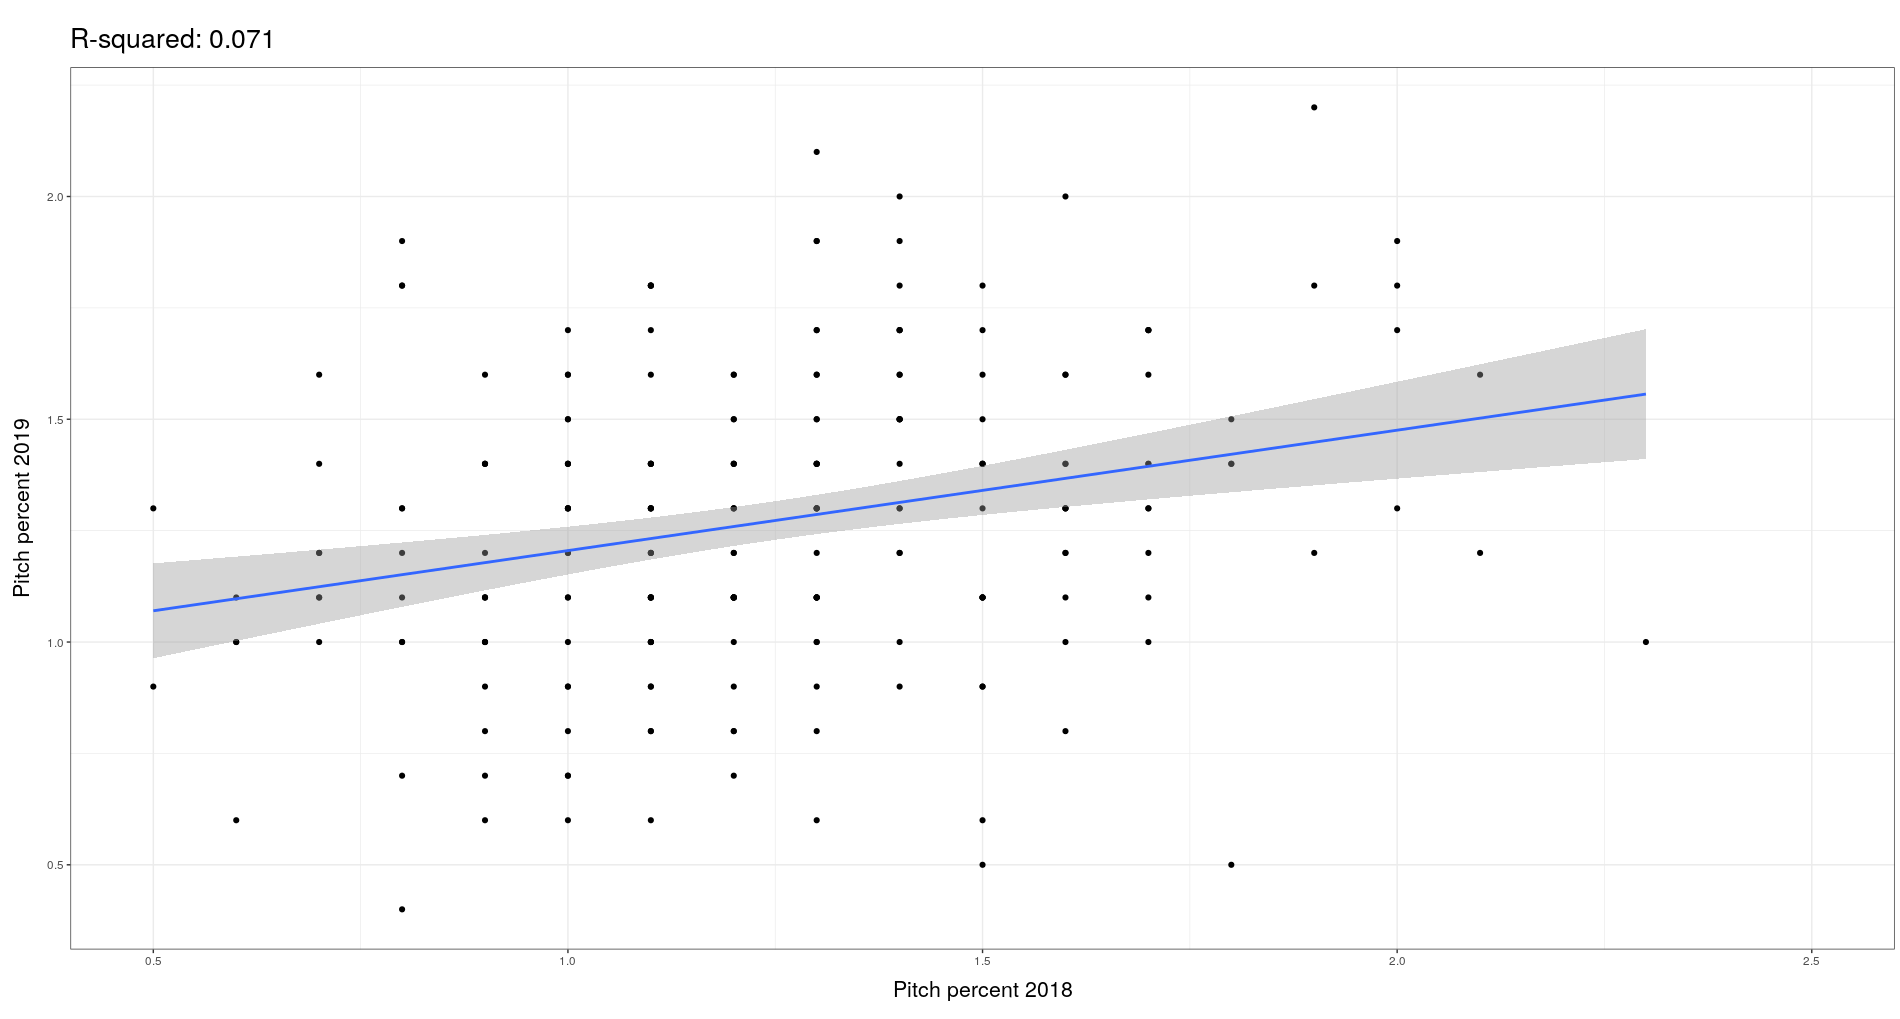
Essentially, there is no correlation between a player’s TLO percentage from one year to the next, suggesting that tough luck outs are randomly distributed. For those three seasons, the average TLO percentage was 1.25% (among hitters who saw at least 1,000 pitches). Andrew Benintendi, then, up to this point in 2021 has hit into twice the number of tough luck outs as the average batter.
There are also some significant differences between tough luck outs and BABIP. For one, BABIP will correlate with players’ skill sets. Think of a slower runner, who will run lower BABIPs on account of not beating out as many ground balls. In our TLO leaderboard, on the other hand, Albert Pujols rounds out the top ten, right behind José Ramirez. Thinking further about the tough luck outs, one might assume that it’s heavily correlated with strong contact, but strangely that doesn’t seem to be much of a strong correlation, either:

TLO seems to be truly a measure of randomness or “bad luck” as it relates to batted balls. The leaderboard has a simplicity to it in that it can distill predictable regression to the mean and hitting skill into one number. Obviously, this is the major benefit of stats like expected average minus average, which provides the spread between the batting average we’d “expect” from a hitter to their actual batting average.
The TLO leaderboard provides a quick glance at players who have hit the ball well (to appear near the top, you have to have several well-hit balls by exit velocity and trajectory), but that can also be expected to be on base more often moving forward. The leaderboard up to this point in the season provides a few takeaways for players in 2021.
Charlie Blackmon, OF, Rockies
The aforementioned Blackmon has hit into 19 tough luck outs so far this season, representing an unbelievable 3% of all the pitches he’s seen. Blackmon hasn’t hit fewer than 29 homers nor lower than .291 in a full season since 2015. The lack of power has been a disappointment up to this point, and no steals and a .250 average isn’t what fantasy owners hoped for in drafts. However, Blackmon is actually walking more and striking out less than he has in any season in his MLB career, and as we’ve seen, his average should expect to rebound.
Pavin Smith, 1B/OF, Diamondbacks
Smith’s name on the leaderboard is a bit of a surprise. With nearly twice the rate of TLO than league average, it’s surprising he’s maintained a .288 average over 214 plate appearances in 2021. Smith is in his first real go-around the majors (he played in 12 games in 2020), and even with the success he’s had up to this point, there’s still room for growth as he’s always shown double-digit walk rates in the minors. I’m firmly buying in on Smith while possible in leagues where I need average help or a capable bench bat to help out ratios in daily leagues.
Andrew Benintendi, OF, Royals
It’s sort of hard to believe that Benintendi is only 26, as it feels like he’s lived a full career cycle already. This season he’s swatted five homers and six steals while batting .291 despite hitting into 18 TLO so far. His counting stats and his hitting abilities seem much more in line with his 2017-18 when he was a high-average, 20/20 threat than his less-than-stellar 2019 and 2020.
Tough luck outs are potentially a nice gut check on undervalued players who have struggled to get on base early in a season. It’s not strongly correlated with other quick checks that we often use to see what’s going on in a batter’s profile, and has almost no year-over-year correlation, giving us reliability in its unreliability. You can find the in-season updated TLO leaderboard on Baseball Savant here.
Various Photos by Icon Sportswire | Adapted by Aaron Polcare
Will there be a column on who is having the most luck?
I’d be looking to trade my good-luck guy for a nice buy low bad-luck guy.
Good thought, I may look into that. Reverse sorting by pitch% of batted balls with xBA over .500 gives a leaderboard of Zunino, Arozarena, Duvall, Garver, and Gallo. I’d caution that this isn’t exactly a 1:1 comparison though. It’d be possible that many of those batted balls had, say, an xBA of .900 or so, in which case you wouldn’t really say they were “lucky,” just hitting the ball hard and turning few outs due to it. May be worth further exploring some parameters that would help us determine who’s had the most luck on that leaderboard. You can see the full list at the link in the last paragraph (just sort pitch% smallest to largest).
I was certainly expected to see Grandal’s name on this list…
Yas is 190th on the list with 0.8% TLO. Right between Joey Wendle and Miguel Cabrera.