


The Save is that uncomfortable statistic that we need, but we all love to hate.
It is a made-up stat, with arbitrary qualifiers, born out of nice intentions that ended up producing significant modifications to the way baseball itself is played, and, depending on who you ask, it should be replaced with something else, especially for fantasy purposes.
With the save, there came The Closer; that baseball figure elevated to mythological heights, whose job is to preserve that three or fewer run advantage for his team until the last out of the game. It’s also one of the most infuriating roles to fill when drafting and managing our fantasy teams, due to what nowadays looks like a tendency for teams to play closers like a game of musical chairs.
Thinking about that, I wondered about the recent past and present of the save (and closers) and what could that mean for the future.
It’s a Slowly Dying Role
From the perspective of a role for just one player, the closer job is losing its exclusivity. We can check that by obtaining the percentage of pitchers who earned a save during a given year, that is, the percentage of all the pitchers that got even just one save during that said year.
The following graphic summarizes that for 2015 to 2021 (until 6/23) seasons:
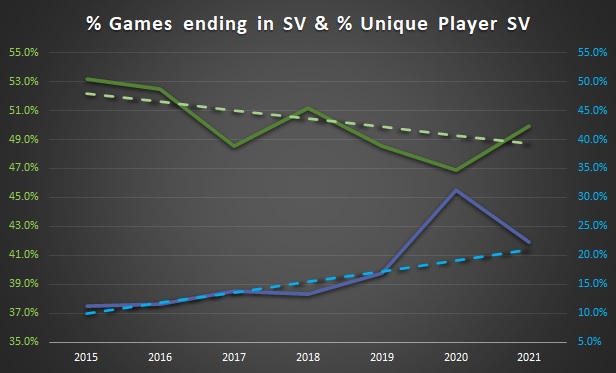
In solid green, that line shows the percentage from the total games for each year that ended up with a save: it’s been around 50% since 2015; the dashed green line displays the trend for it, excluding the 2020 season, and it looks like the slight decrease will continue.
Now, in solid blue, is the line that depicts how year after year, the saves get distributed among a larger number of pitchers. The dashed blue line shows the upward trend for that situation, even though I did not factor in 2020 to calculate that trend, due to the anomalous 2020. And if we consider 2021 as an anomaly too, 2015-2019 was still showing the same trend, just at a slightly slower pace.
In that regard, in 2015, 145 different pitchers got at least one of the 1292 saves notched that year (11.2%). While this 2021 season, already 120 different pitchers have earned a save out of the 539 total saves completed through 6/23 (22.3%).
I know that this should not be a surprise to anyone playing fantasy baseball. We are living in the specialization era of the game, especially pitching specialization, and managers have many more options than ever in a typical bullpen to tackle any specific situation, closing games included.
That’s why the “closing by committee” situation is more frequent these days. It may be abhorred by fantasy baseball players, but it’s just a sign of the times. The logical progression for this situation is that this will be something that should continue, to a point that some teams might just go with it from the get-go and not as a result of previously appointed closers meltdowns or injuries.
So, that should settle the matter as it looks like the best option, right? Not so fast.
Might Closers Still Be Needed?
Using the best pitchers, in the ideal situations for them and the team, should definitely help the team preserve wins, right? Well, the data, although inconclusive, looks like it’s pointing to the opposite.
What I did was calculate the average number of games between blown saves, meaning that the bigger that number is, the possibility of a blown save is lower. The following graph summarizes the 2015-2021 time frame:
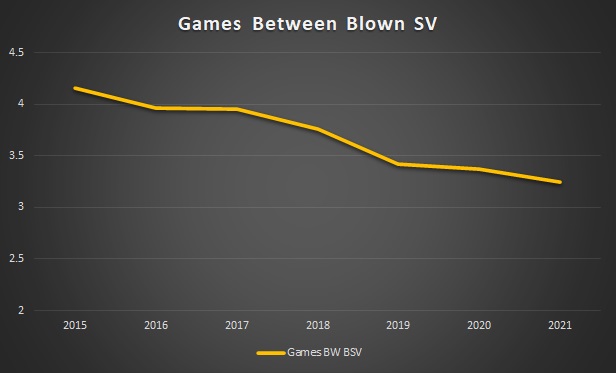
As you can see, blown saves are more frequent today than they were in 2015, a trend that continues.
So it was not just your gut feeling that pitchers are blowing up leads in save situations more than ever. They are in fact doing it. Which is, at least for me, baffling.
For added context, and under the advice of Mark McElroy, let’s look at the proportion of blown saves by “closers” pitching in a save opportunity in the 9th inning versus all other innings. What we could call “blown holds.”
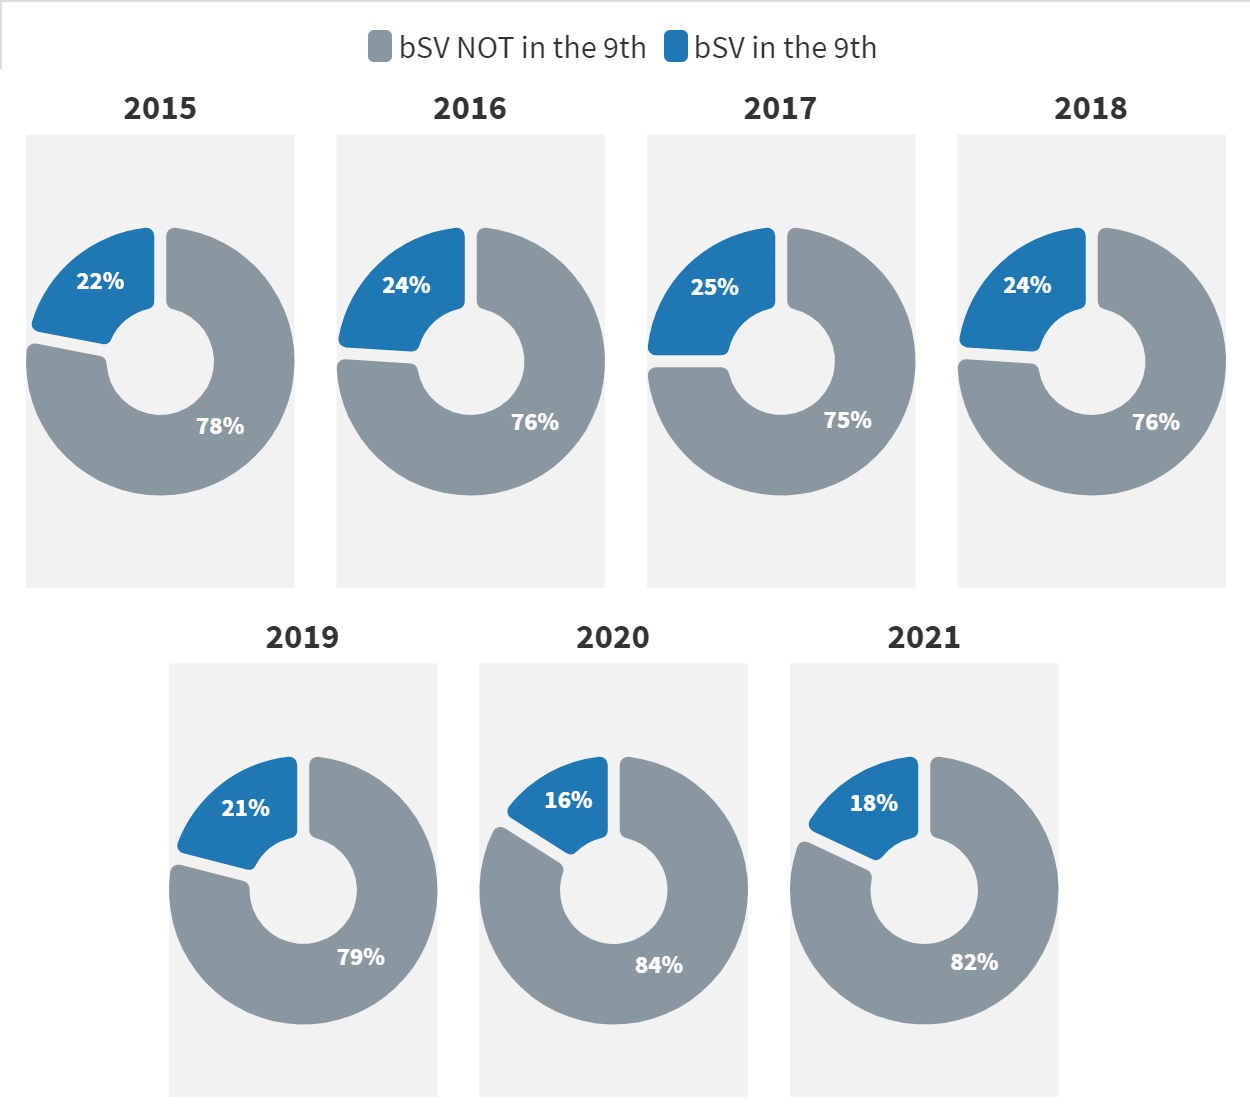
Basically, the proportion has been the same since 2015, but it has slightly decreased for Closers’ blown saves for the last three seasons including 2021.
What the numbers say is that pitchers are blowing saves more frequently but not during the closer’s opportunities (9th inning), although the gross number is still up.
If you take into account that the league’s batting average, on-base percentage, and slugging had been increasing in the 9th inning from 2015 until 2019 (2020 and 2021 being exceptions – with the new “deadened ball” also factoring into this season) it is great to know that closers are still effective.
In the specialization era, it should not surprise us that we have better-prepared batters and/or pinch hitters for the last part of the game.
But here is the troubling part: as you will see in the following table, the blown saves that are still occurring in the 9th inning are predominantly happening in an environment where there are more unique pitchers assuming the closing role. That means pitchers that do not have that regular role but had to step up due to circumstances – matchups, etc.
My thinking about this situation is that even though any major league pitcher should be able to hold a 3 run lead for an inning, it requires a different state of mind to go to the ballpark every day knowing that if the opportunity arises, YOU will be the one in charge of preserving that lead. Or on the contrary, you just MIGHT be the guy.
Think about it for a minute – you go to your work tomorrow and your boss tells you to stay put, and wait until 15 minutes before finishing the shift, and then you might be picked to close a deal for your company. But he tells the same to two other workmates. And the only thing you all can do is wait and see.
Job certainty is one important thing we all need; job clarity is the road to achieve complete fulfillment on that. A “Closer by Committee” scenario is a thing of nightmares for any pitcher in that regard.
Closers, as a role, seems to be bound to disappear because of the evolution of the game. It’s just that we, as humans, are creatures of habit, and some habits are very hard to part with. So, possibly it’s not the best idea to stop having someone specifically appointed for said role.
(Design by Michael Packard (@designsbypack on Twitter and IG)
Carlos, good article except… why do so many people continue to claim the ball is “deadened?” Sure, I guess you could say it is compared to 2019 (1.39 HR/G – which is the current record and it annihilated the previous record), 2020 60-game season (1.28 HR/G) and 2017 (1.26 HR/G – which was the record before 2019 and it shattered the old record). But, those 3 seasons were significant outliers. Currently, 2021 is tied with 2000 (which held the record before 2017) for 4th all-time at 1.17 HR/G. And, when you factor in 7-inning double-headers and extra-inning man on 2nd rule, that likely means HR/AB are more frequent in 2021 than in 2000. I guess it’s just a touchy subject with me because HRs are still very plentiful and it seems like a false narrative. The TTO syndrome that MLB has been suffering from for several years is of much greater concern and makes the game look more like beer-league softball (especially with a current league BA of .238).
Hi Dave! Glad you liked it, thanks!
In a broader sense, you are totally right as deadened can be a misleading term from the batter’s side of the game; what I was referring to, but wasn’t clear enough about, has to do more from the pitcher’s side, on how the ball behaves, something in the scope of what Eno wrote about here:
https://theathletic.com/2615177/2021/06/01/what-role-is-the-new-ball-playing-in-all-these-no-hitters/
Thanks for the feedback, I truly appreciate it!
Regards,
Carlos.