


Back in April, just a few weeks into what was set to be Trent Grisham’s first full season, Vincent Ginardi dove into Grisham on this very site. The full article is well worth reading, but here is a paragraph from his conclusion:
Grisham pulling the ball led to a breakout campaign for the outfielder in the minors in 2019. After a small sample in the majors that season and a trade to the San Diego Padres that offseason, the results we saw from Grisham in the upper minors began to surface at the major league level. He pulled the ball more and squared it up more often. A decrease in his ground ball rate could lead to an even bigger breakout in 2021. It’s an extremely small sample, but Grisham is pulling the ball and hitting it in the air even more frequently to start the year.
By May 12, Grisham had a 46.2% pull rate and a 42.7% flyball rate. The pull rate hadn’t moved much – up a bit from 44.4% in 2020 – but that flyball rate was a nice boost compared to 34.5% in 2020. At that point, Grisham had a 132 wRC+. After posting a 122 wRC+ in the shortened 2020 season, this certainly represented the “even bigger breakout in 2021” that Ginardi suggested was possible.
But if you look at his player page now, you’ll see that for 2021, Grisham had a 103 wRC+. Not only does that not look like a secondary breakout, it looks like a big step back. The question in front of us is what went wrong and can he turn it around?
What Went Wrong
Including 2020, Grisham’s last 779 plate appearances can be broken into two roughly equal halves:
| Timeframe | PA | wRC+ | K% | BB% | BABIP | HH% | Barrel% | LA | Avg EV | Max EV | Pull % | GB% |
| Start of 2020 through May 12, 2021 | 376 | 125 | 25.8% | 11.7% | 0.330 | 43.5% | 9.9% | 14.7 | 89.7 | 111.9 | 45.0% | 40.5% |
| May 14, 2021 through the end of the season | 403 | 94 | 21.3% | 10.2% | 0.270 | 33.3% | 4.4% | 10.9 | 87.8 | 109.4 | 36.7% | 41.8% |
| 2020-21 Total | 779 | 109 | 23.5% | 10.9% | 0.297 | 38.0% | 7.0% | 12.6 | 88.7 | 111.9 | 40.5% | 41.2% |
Any time a young hitter struggles, the first thing I am looking for is strikeout rate. Did the league catch up with him and figure out a hole in his swing? But that is pretty clearly not the issue here. Grisham improved his strikeout rate, and while it has bounced around, you can see on this graph of his rolling strikeout rate, his strikeouts started decreasing early in 2021 and only briefly spiked back up in the latter part of 2021.
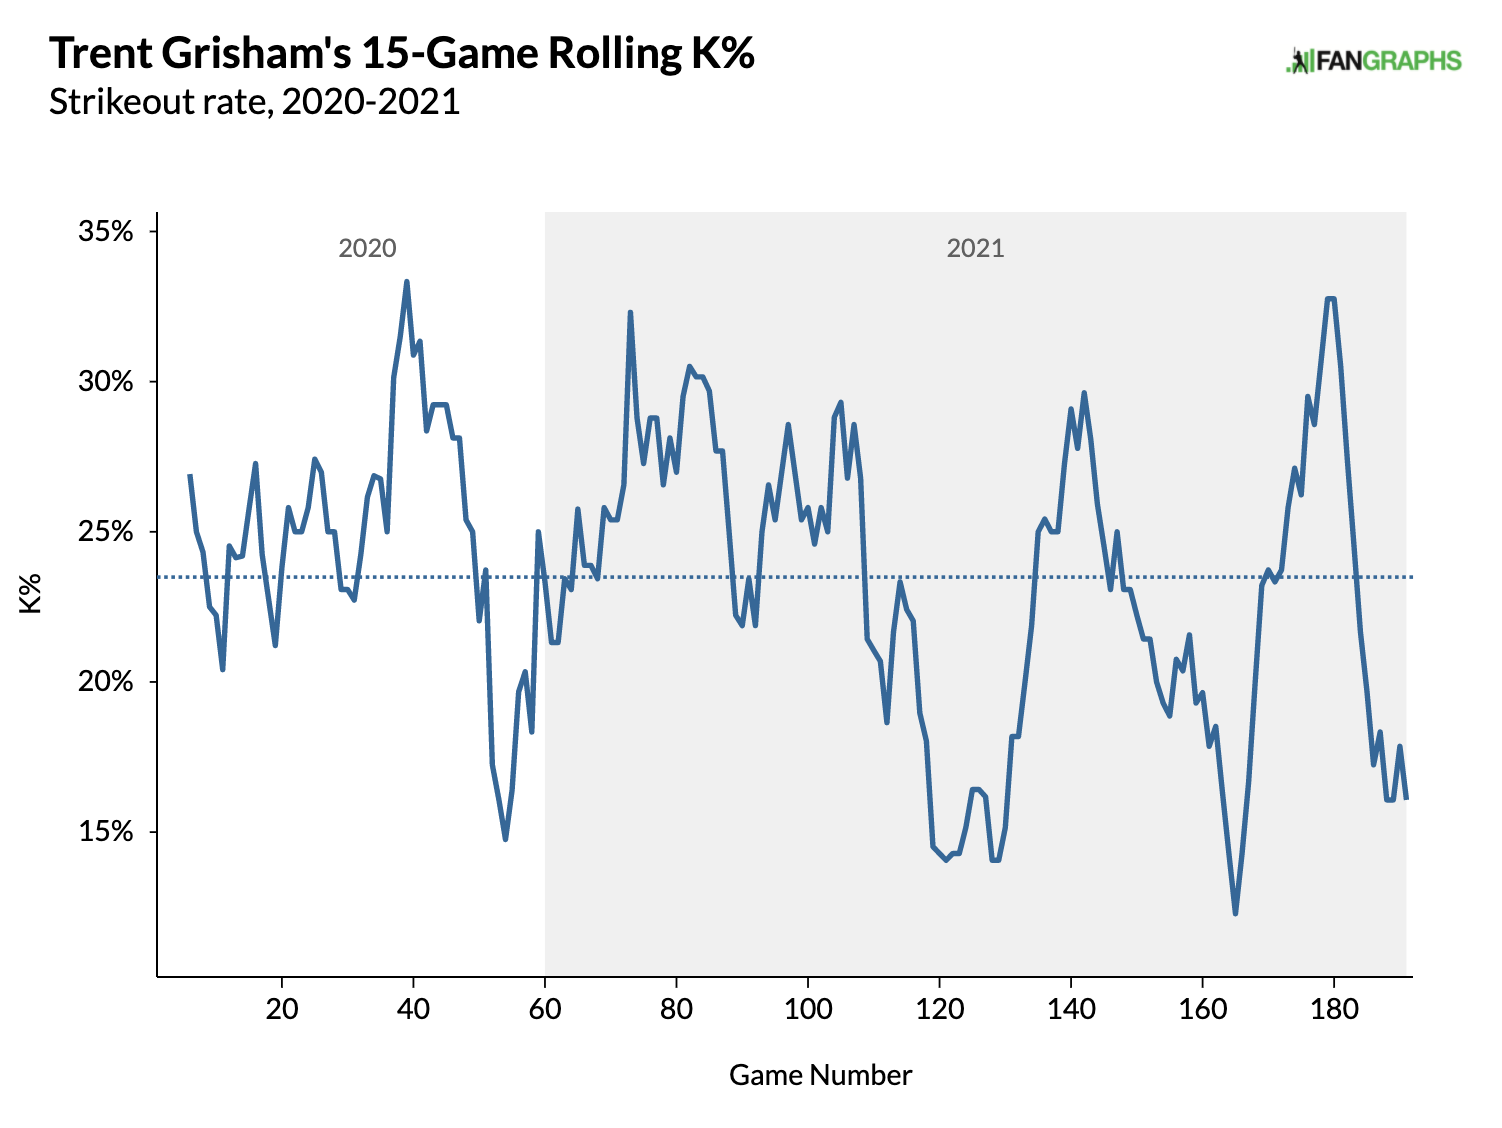
Data and graphic from FanGraphs
While his chase rate increased a bit (from 19.6% prior to May 12, 2021 to 21.5% after), his contact rate jumped even more (77.1% to 82.6%) resulting in a decrease in his swinging strike rate from 8.7% to 7.1%. The walk rate is down a small amount, but not nearly enough to be concerned about.
However, his exit velocity, hard-hit rate, and barrel rate are all down, as is his launch angle. He hit the ball more often but didn’t hit it as hard. Even if you look at hard hits and barrels per plate appearance, he dropped off significantly. The drop in exit velocity was paired with more ground balls and fewer pulled balls – the exact opposite of what Ginardi was looking for.
By May 12, game 87 on the graph below, his pull rate was already heading the wrong direction, but it was settling in around league average and was still higher than where he spent most of 2020. As for his ground ball rate, after starting 2020 with very few groundballs, that rate rose all season but was headed down for the start of 2021.
But somewhere between game 80 and game 100, his ground ball rate started to climb, eventually reaching peaks he never reached in 2020, while his pull rate began to drop, reaching lows it never reached in 2020. After May 12, Grisham had a 94 wRC+, a far cry from the 132 he had to start the season.
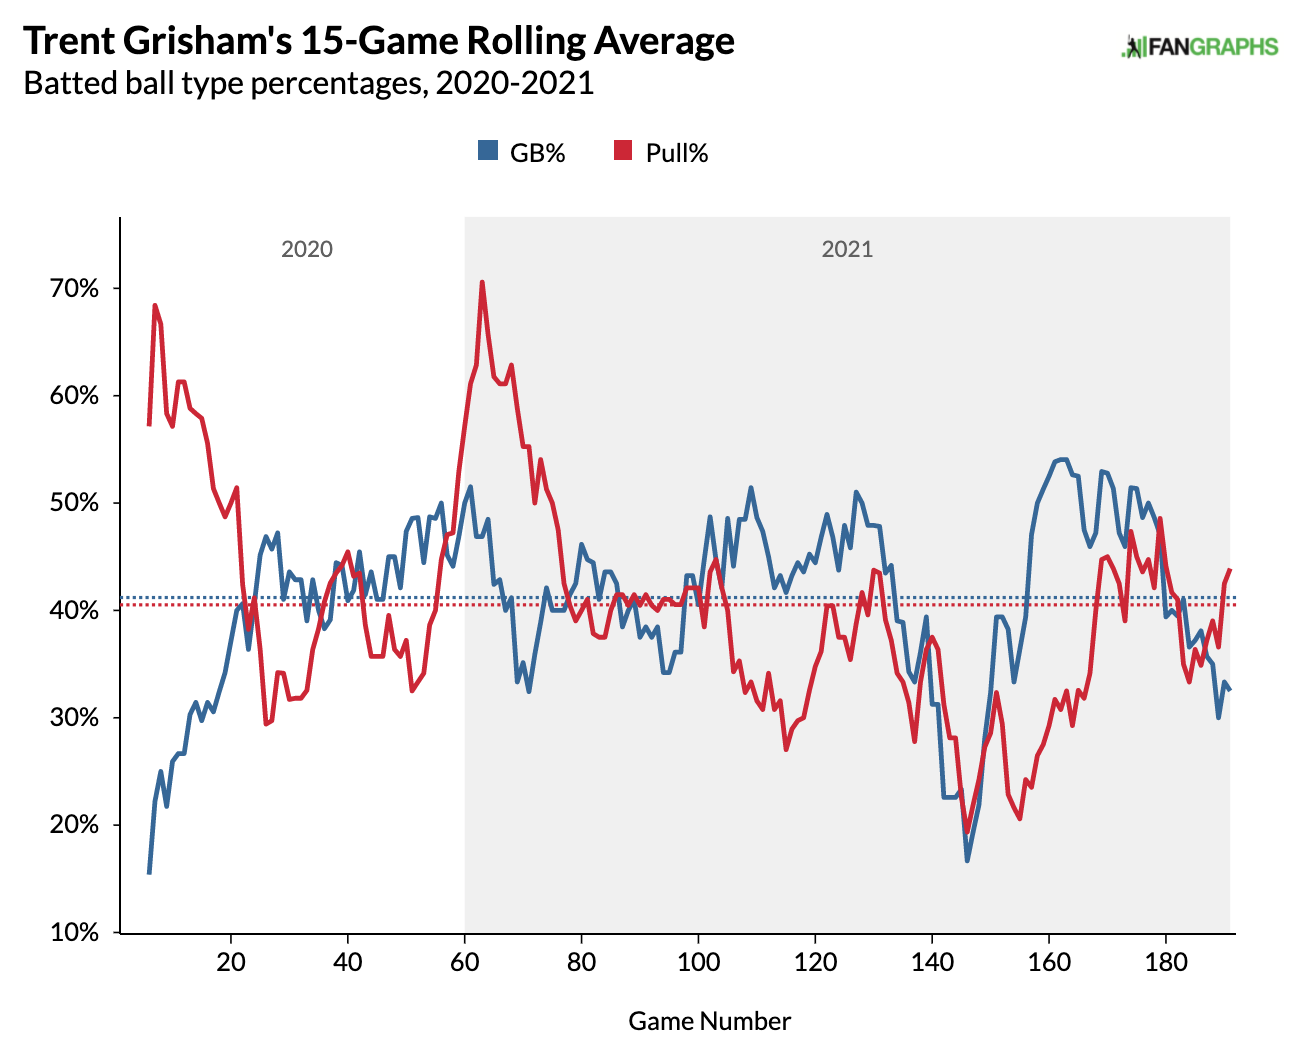
Data and graphic from FanGraphs
Grisham is not the first guy to break out thanks to an increased pull rate. Pulled balls are easier to hit hard. In 2021, across all of MLB, hitters had an 89.8 mph average exit velocity and .409 xwOBA when they pulled the ball; they had an 84.4 mph average exit velocity and .291 xwOBA when they go the other way. Keeping the ball off the ground helps, too. The chart below shows xwOBA by batted ball type and direction for the league in 2021.
| League Wide in 2021 | Pull xwOBA | Straightaway xwOBA |
Opposite xwOBA
|
| Fly Ball | 0.669 | 0.490 | 0.249 |
| Line Drive | 0.699 | 0.649 | 0.589 |
| Ground Ball | 0.223 | 0.225 | 0.217 |
So, yeah, pulling the ball and getting it off the ground is a good thing. Grisham shows most of the same patterns:
| Grisham in 2020 | Pull | Straightaway | Opposite |
| Fly Ball | 0.726 | 0.275 | 0.262 |
| Line Drive | 1.070 | 0.679 | 0.732 |
| Ground Ball | 0.247 | 0.258 | 0.194 |
Those are all pretty small samples for Grisham, but there’s nothing super surprising there. Maybe we would expect better results on fly balls up the middle in the future.
So it certainly looks like Grisham’s performance dropped off because he wasn’t hitting the ball as hard, and that he was pulling the ball less at the same time. That gets us a step closer to understanding what went wrong, but doesn’t get us all the way there.
How Pitchers Attack Grisham
With an increased contact rate and decreased strikeout rate, Grisham does not appear to be the victim of the league adjusting to him, but we can’t dismiss the possibility that he was being attacked differently, leading to less hard contact. Maybe Grisham was getting around on breaking and offspeed stuff, and pitchers upped the velocity against him? Maybe he was crushing fastballs, so they kept him off-balance with more breakers?
| Timeframe | Fastball % | Breaking % | Offspeed % |
| Start of 2020 through May 12, 2021 | 63.30% | 22.30% | 14.20% |
| May 14, 2021 through the end of the season | 67.70% | 20.70% | 11.60% |
Ok, so maybe we have something here, but it doesn’t look like much. He was facing more fastballs after May 12. Maybe opposing teams noticed he was weak against fastballs and started using them more.
| Timeframe | Fastball % | xwOBA on FB | Breaking % | xwOBA on Breakers | Offspeed % |
xwOBA on Offspeed
|
| Start of 2020 through May 12, 2021 | 63.30% | 0.403 | 22.30% | 0.336 | 14.20% | 0.214 |
| May 14, 2021 through the end of the season | 67.70% | 0.322 | 20.70% | 0.263 | 11.60% | 0.249 |
| 2021 MLB Average | 57.40% | 0.344 | 29.60% | 0.269 | 12.90% | 0.289 |
Except he didn’t really struggle with fastballs relative to other pitch types, particularly before he fell off. If anything he was feasting on fastballs. If it were early May 2021, and you saw the data on the first row of this table, would you start throwing Grisham more fastballs? No chance.
But after May 12, Grisham he got worse against almost everything. The lone exception was offspeed pitches, which he was already struggling with. But there isn’t a clear pattern of Grisham struggling with fastballs in 2020 and early in 2021, leading pitchers to throw more of them as the season progressed.
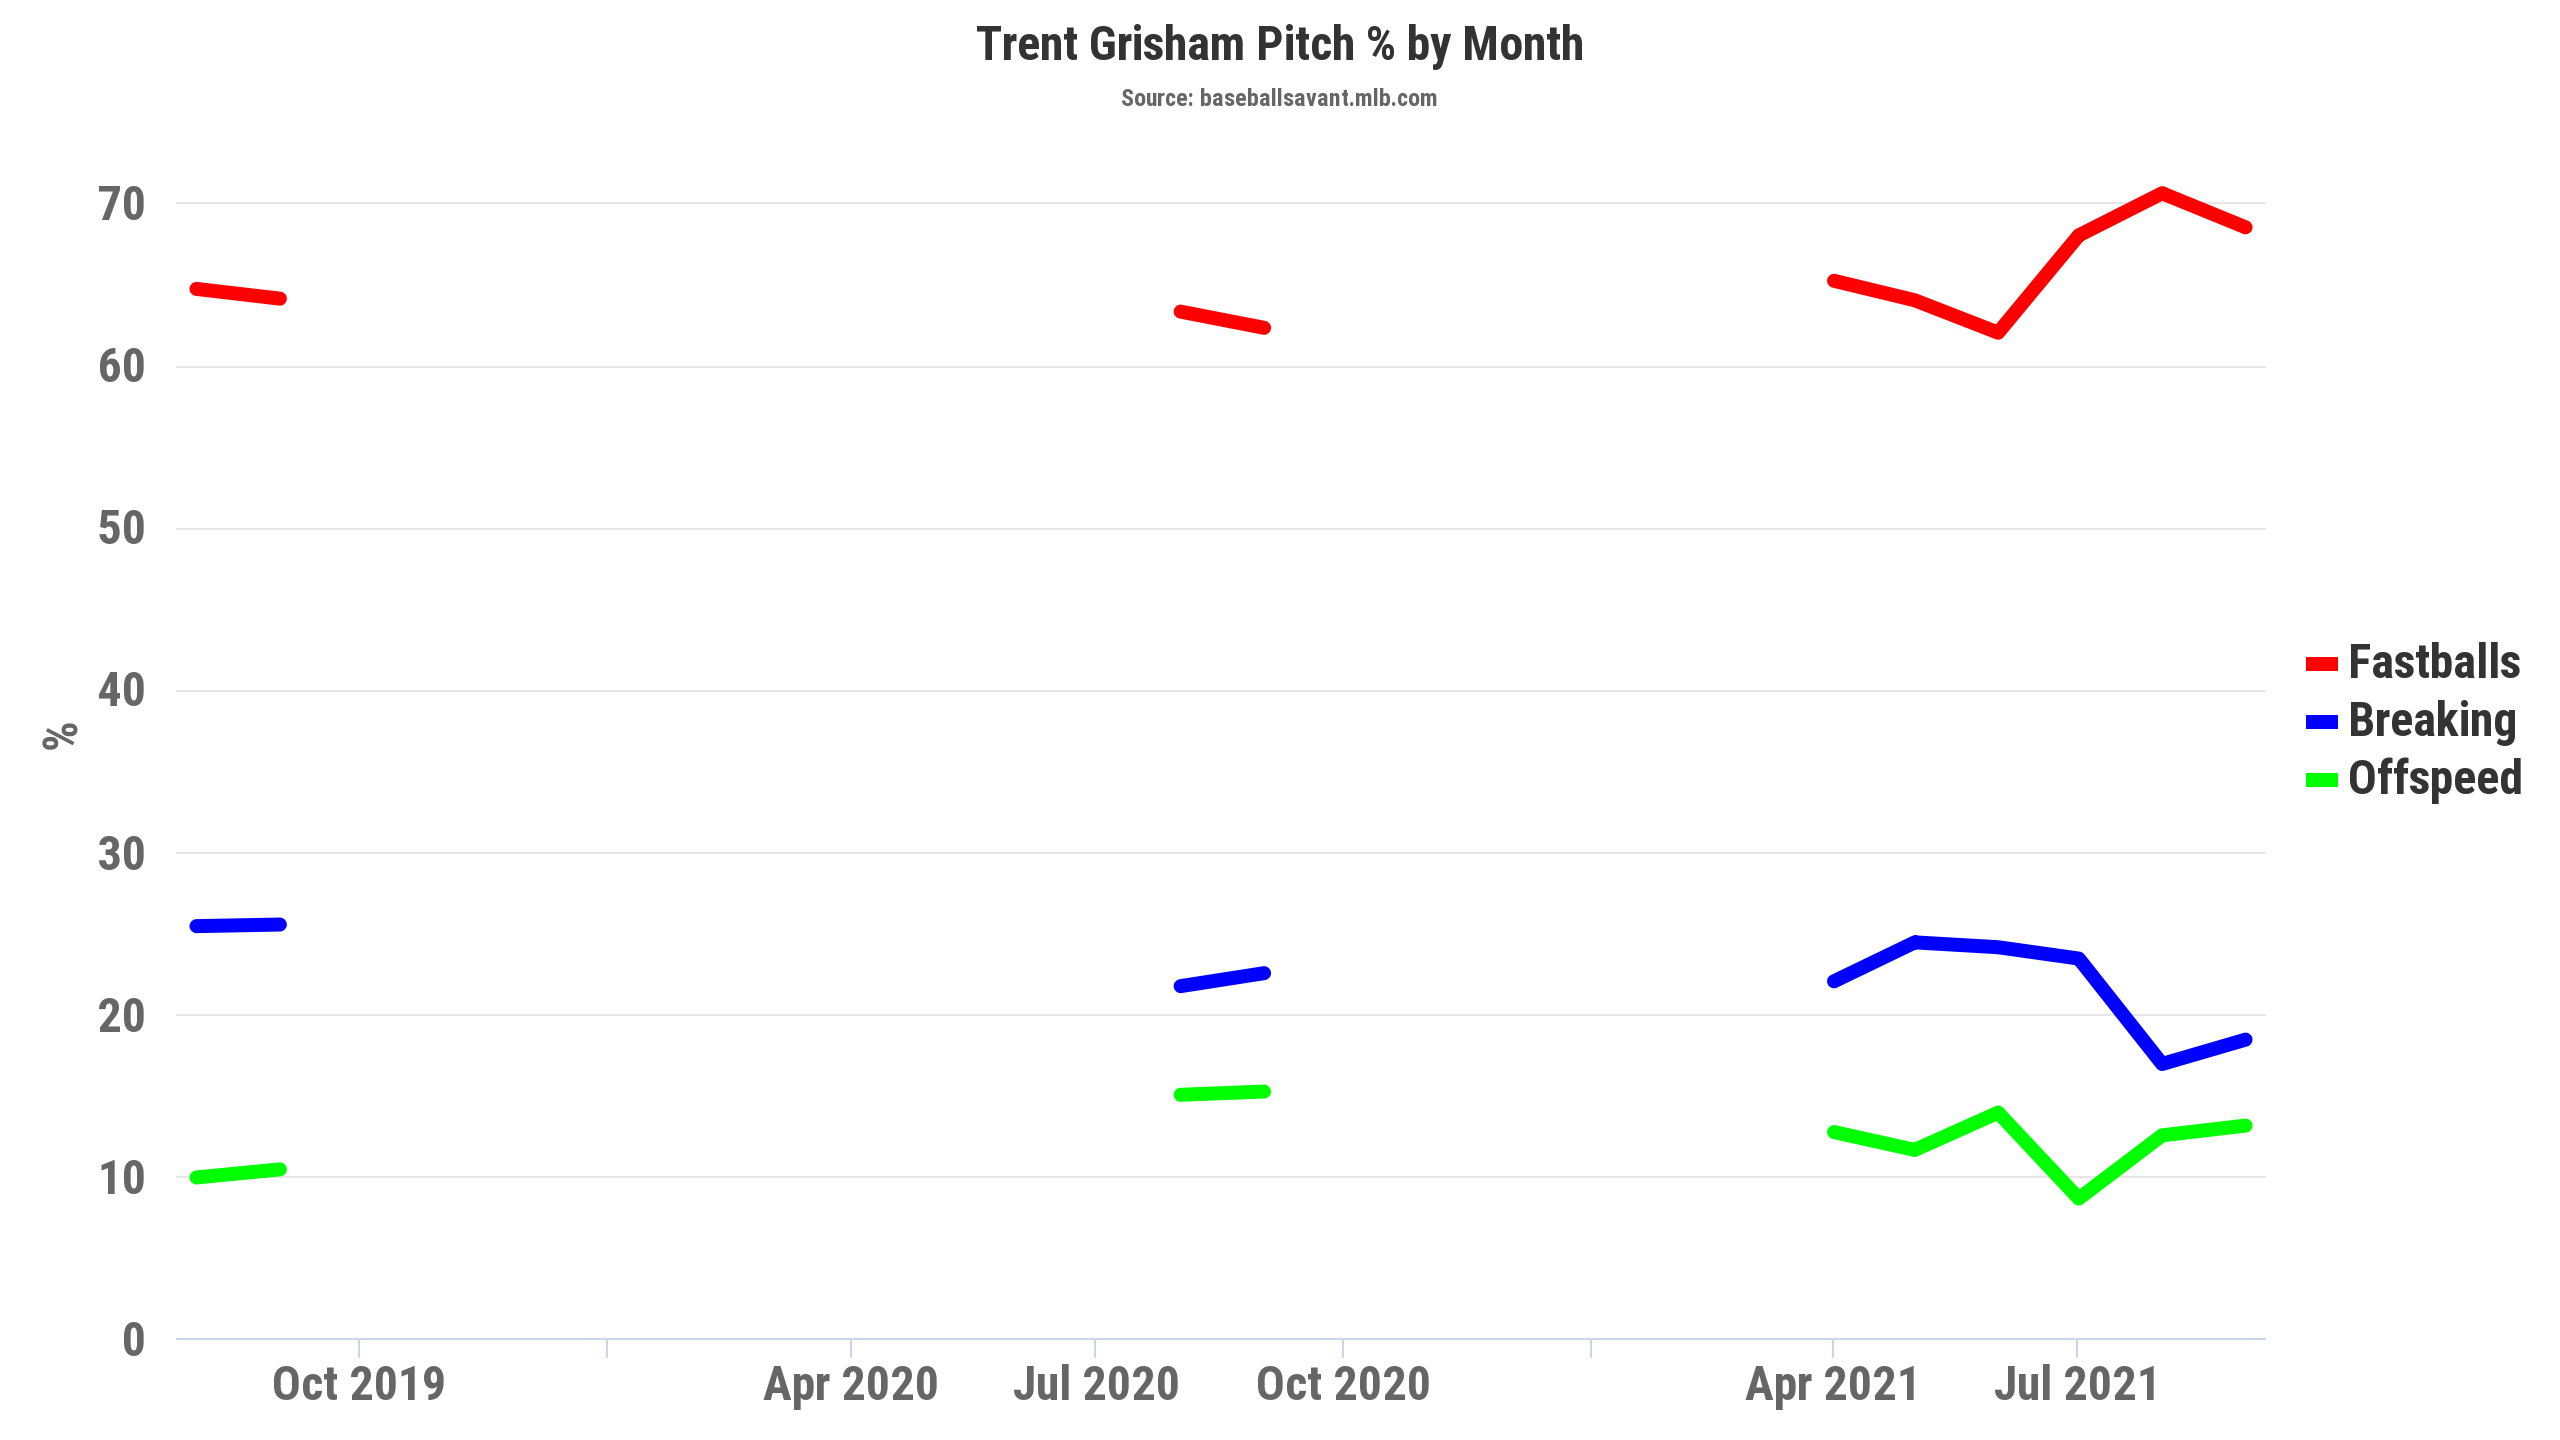
Data and Graphic from Baseball Savant
That inflection point in the red line for 2021 is June – pitchers threw Grisham fewer fastballs in June 2021 – after he started struggling – than any other month of his career. Grisham didn’t struggle because pitchers threw him more fastballs; pitchers threw him more fastballs because he was struggling.
The biggest takeaway here is that Grisham struggled across the board. His pull rate went down on offspeed pitches, his xwOBA plummeted against breaking pitches, and both went down against fastballs. This isn’t a story of “guy can’t hit fastballs, so pitchers throw more fastballs.”
Where Pitchers Attack Grisham
But, while it doesn’t seem that how pitchers attacked him is the issue, maybe pitchers changed where they attack him:
Data and graphics from FanGraphs
Like the pitch mix, this does appear to show something – pitchers were coming inside more often to Grisham. To look at Grisham’s performance by part of the plate, I used “Attack Zones” from Baseball Savant, as shown in the image below.
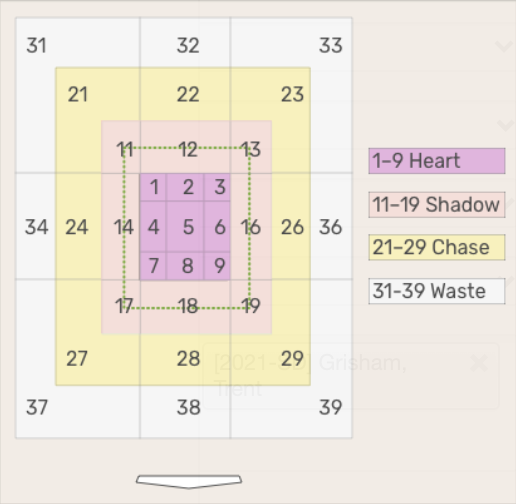
I classified zones 3, 6, 9, 13, 16, 19, 23, 26, and 29 as inside; 2, 5, 8, 12, 18, 22, and 28 as middle; and 1, 4, 7, 11, 14, 17, 21, 24, and 27 as outside. I ignored the “waste” zones to try to focus only on pitches Grisham would potentially go after. Here are the results:
| Timeframe | Inside | Inside xwOBA | Inside Pull % | Middle | Middle xwOBA | Middle Pull % | Outside | Outside xwOBA | Outside Pull % |
| Start of 2020 through May 12, 2021 | 24.90% | 0.320 | 50.00% | 34.70% | 0.370 | 52.21% | 31.70% | 0.341 | 22.73% |
| May 14, 2021 through the end of the season | 28.40% | 0.296 | 53.95% | 34.10% | 0.285 | 39.45% | 31.00% | 0.294 | 20.00% |
| 2021 League Average for LH Hitters | 21.75% | 0.307 | 51.94% | 35.20% | 0.317 | 41.12% | 34.38% | 0.297 | 21.59% |
Prior to his drop-off, Grisham was better than league average against inside pitches, but much better than league average against middle and outside pitches. So pitchers coming inside more makes sense. You’ll also notice that he got more inside pitches without getting many fewer outside or middle pitches – this is because pitchers wasted fewer pitches (6.5% after the drop-off vs. 8.7% before).
But like the fastball change, this shift does not appear to pre-date Grisham’s struggles. We’re starting to break things down into pretty small samples here, but let’s look at the gif of where pitchers attack Grisham again, this time in three segments – 2020; through June 16, 2021; the rest of 2021:
Data and Graphics from FanGraphs
You can see that comparing the first window (2020) and the second (through June 16, 2021, well after his struggles had started), Grisham didn’t see a big shift to the inside (though there are more pitches down and in out of the zone). The shift comes later, perhaps as pitchers realized Grisham was struggling.
This leads me to two conclusions: first, that pitchers did in fact see an opportunity to challenge Grisham with fastballs and on the inside part of the plate; and second, that this approach was more a reaction to his struggles than the cause of them.
Why May 12?
The elephant in the article is that I selected May 12, 2021, as a cutoff, which feels pretty arbitrary. Yes, it roughly evenly splits his 2020-21 stretch, but there is actually another reason I picked this date, and it has to do with what I think might be going on.
Grisham hit the IL on May 22, returning on June 12. But the bruised heel that sent him to the IL occurred on May 14. Grisham played May 12 at Coors Field, going 1-4 with a single, a strikeout, and a run scored. The Padres were off May 13, and on May 14, Grisham started against the Cardinals, going 1-2 with a single and three walks. After beating out an infield single in the first, Grisham tried to do it again in the second:
https://gfycat.com/adoredillanemone
This is the play where Grisham reports hurting his heel. It doesn’t look like much but it is clearly an awkward moment, and it seems that awkward moment coincides with the start of his struggles. Grisham thought he could play through the pain, but eventually needed to be shut down. Originally it seemed like he might be on the IL for the ten day minimum, but the injury lingered and Grisham was clearly a bit frustrated by it.
In the end, he was back out of the lineup more than twice the minimum. It’s not clear if he was back because the heel was healed or because, as he told Jeff Sanders in the article linked above, “It’s manageable. I can play on it.”
I can’t find any evidence of Grisham complaining about the injury after he came back. There’s no mention, I can see, of it lingering all year. But I wonder how much it impacted him. A bruise would typically heal with time, but Grisham played on it for about a week before resting and then was clearly anxious to get back. If it was causing him pain and he was struggling to push off on his back foot at the plate, feeling pain when he swung, or even just compensating for it, it could help explain why he was hitting the ball with less power, pulling the ball less (less bat speed perhaps?) but not having any issue drawing walks or avoiding strikeouts. His ability to see and react to pitches didn’t change. His ability to make contact, if anything, improved. He just couldn’t get as much power on his swing.
As far as I can tell, his mechanics weren’t off. The drop in pull rate suggests he was slower to the ball and we can see in the data that he was hitting it with less authority. Here is an illustrative comparison. The first clip is a 95.9 mph fastball down the middle from Walker Buehler to Grisham on April 16, and Grisham stays on it and drives at 100.6 mph it back through the middle for a single. The second is practically the same pitch (95.9 mph, down the middle, from Buehler, in a 1-0 count instead of 2-1), and he is behind it and hits a lazy fly ball at 85.6 mph to left for an easy out.
<
div style=”position: relative; padding-bottom: calc(56.25% + 44px);”>
https://gfycat.com/FloweryClosedGrayreefshark
https://gfycat.com/UnlinedParchedCockatiel
Here is another example. The first clip is a 94.5 mph fastball up and in from July 2020, which Grisham deposits in the RF seats; the second clip is another Weaver fastball, this one a touch slower (93.9 mph) and a touch further inside, and Grisham barely gets the ball in play.
https://gfycat.com/FondInfatuatedGiantschnauzer
https://gfycat.com/HollowLiveAfricanwildcat
That Weaver example stands out to me – in the first clip, Grisham gets through the zone super quickly, gets the barrel to the ball, and hits a 104 mph rocket; in the second, the bat doesn’t get nearly as far around and he gets jammed and hits a 52.3 mph chopper. Yes, the pitch is further inside, so it is entirely possible this is just a case of Weaver executing better, but I think if Grisham were as fast the second time as the first, he would have gotten better wood on the ball, or maybe ripped it foul.
What to Make of It All
To me, this looks like a player struggling with injuries. Yes, pitchers seemed to adjust, but the change doesn’t really scare me. He saw some more fastballs, but Grisham at his best annihilates fastballs. If he goes back to hitting fastballs like he did before he got hurt, that fastball percent is going to drop again.
Yes, pitchers came inside a bit more, but it was not a huge increase and Grisham was already succeeding despite seeing a higher-than-average share of inside pitches. Plus, as Ginardi showed us, Grisham has demonstrated an ability to make adjustments in the past – if he has to adjust to a few more inside pitches, I am confident he can.
During that first stretch, from the start of 2020 until May 12, 2021, Grisham had a .264 average, .356 OBP, 15 HR, 16, SB, 58 R and 38 RBI in 376 PA. Pro-rated to 600 PA, that is 24 HR, 26 SB, 93 runs and 61 RBI. Especially in OBP leagues, that is excellent production – a solid average or excellent OBP with a 20-20 season and a nice pile of runs? Especially if you use early picks on boppers who drive in a ton, Grisham is going to be very useful. And if the plate discipline gains stick while the contact quality returns? There is more there.
In the Pitcher List mock draft, I took Grisham in the 13th round and I’ll admit I was getting antsy and considering him much earlier. I took him with the 153rd pick; I have him 84th on my draft board. That draft board is very rough and subject to a lot of revision, but if Grisham continues to go that late, or even close to that late, I’ll end up with him on almost all my rosters.
Photo by Brian Rothmuller/Icon Sportswire | Adapted by Justin Redler (@reldernitsuj on Twitter)