


Welcome back to another edition of Patience or Panic! We are days away from the 2021 trade deadline, and there are what feels like a million rumors flying around and even more names than that. We’ve already seen Nelson Cruz and Adam Frazier find new homes, and things are only going to ramp up from there. So, with all that being said, we’re going to do things a little differently this week. I’m gonna give you guys one specific player who is likely to be dealt by the deadline and break it down. So let’s dive into this week’s Patience or Panic with one of the top names on the market, and break down what his stock could be.
Kyle Gibson, SP, Texas Rangers
Through the first few months of the season, Kyle Gibson was one of the breakout players of the year and one of the few bright spots down in Arlington, Texas. Through July 3, Gibson made 16 starts with a sparkling 1.98 ERA, giving up just seven home runs and holding opponents to a .202 batting average.
It looked like the Rangers were going to have one of the most coveted names on the market come deadline time. And while that might still be true, Gibson’s recent performance has brought down his stock.
| Rk | Gcar | Gtm | Date | Tm | Opp | Rslt | Inngs | Dec | DR | IP | H | R | ER | BB | SO | HR | HBP | ERA | BF | Pit | Str | StL | StS | GB | FB | LD | PU | Unk | GSc | IR | IS | SB | CS | PO | AB | 2B | 3B | IBB | GDP | SF | ROE | aLI | WPA | acLI | cWPA | RE24 | DFS(DK) | DFS(FD) | Entered | Exited | |
|---|---|---|---|---|---|---|---|---|---|---|---|---|---|---|---|---|---|---|---|---|---|---|---|---|---|---|---|---|---|---|---|---|---|---|---|---|---|---|---|---|---|---|---|---|---|---|---|---|---|---|---|
| 17 | 222 | 87 | Jul 7 | TEX | DET | L,3-5 | GS-7 | L(6-1) | 4 | 6.1 | 8 | 5 | 5 | 2 | 7 | 1 | 0 | 2.29 | 27 | 98 | 58 | 15 | 11 | 9 | 9 | 5 | 0 | 0 | 42 | 0 | 0 | 0 | 25 | 0 | 0 | 0 | 1 | 0 | 0 | 1.22 | -0.026 | .02 | 0.00% | 0.08 | 12.25 | 25.00 | 1t start tie | 7t 123 1 out tie | |||
| 18 | 223 | 94 | Jul 19 | TEX | @ | DET | L,0-14 | GS-6 | L(6-2) | 11 | 5.0 | 10 | 8 | 8 | 2 | 2 | 1 | 1 | 2.86 | 26 | 87 | 52 | 10 | 7 | 12 | 9 | 6 | 1 | 0 | 15 | 0 | 0 | 0 | 23 | 2 | 0 | 0 | 0 | 0 | 0 | .67 | -0.207 | .00 | 0.00% | -4.47 | -8.55 | -3.00 | 1b start tie | 6b 12- 0 out d6 | ||
| 19 | 224 | 99 | Jul 24 | TEX | @ | HOU | L,1-4 | GS-6 | L(6-3) | 4 | 6.0 | 4 | 3 | 2 | 8 | 4 | 0 | 1 | 2.87 | 28 | 104 | 48 | 19 | 5 | 6 | 9 | 6 | 1 | 0 | 50 | 0 | 0 | 0 | 17 | 1 | 0 | 0 | 2 | 2 | 0 | .91 | -0.086 | .00 | 0.00% | 0.16 | 9.70 | 24.00 | 1b start tie | 6b 3 out d3 | ||
| 10-9 | W-L:6-3 | 4.5 | 113.0 | 92 | 38 | 36 | 41 | 94 | 9 | 5 | 2.87 | 460 | 1760 | 61% | 17% | 11% | 1.05 | 26% | 7% | 0 | 57 | —% | 2 | 2 | 1 | 411 | 15 | 0 | 0 | 10 | 3 | 1 | .96 | 2.097 | .38 | 0.62% | 20.42 | 311.45 | 585.00 |
Provided by Baseball-Reference.com: View Original Table
As you can see over his last three starts, Gibson has not been nearly as good as he was for those first 16. Before this stretch, Gibson hadn’t allowed more than three earned runs in any start, and hadn’t walked more than three batters. He cleared both those numbers easily in two separate starts. So what’s the problem? Is there a problem?
The short answer? Yes.
Lucky for you readers, it is 2021, and we have incredible friends at FanGraphs and Baseball Savant, so you don’t have to settle for the short answer. We know you’re here for the long answer, anyway.
Let’s start with Gibson’s pitch mix. The pitch he relies on most is his sinker, and that’s been even more true this month, as Gibson has thrown it nearly 40% of the time, up 8% from June. The problem with that is opponents hit .308 against the sinker in June, and yet Gibson is using it even more. The fastball usage has also gone up from 11% to 14% in July, which is a problem, since opponents are hitting .455 against that pitch.
So now Gibson is throwing two pitches more than 50% of the time, and both of those pitches are getting hit. But why are they getting hit harder now? Especially the fastball, which opponents had not hit better than .182 against in any month before July.
Earlier in this piece, we referenced Gibson allowing more walks recently, and if you take a gander over at FanGraphs and Gibson’s heat maps, you’ll see the issue. Here is Gibson’s heat map on his fastball and sinker through his first 16 starts.
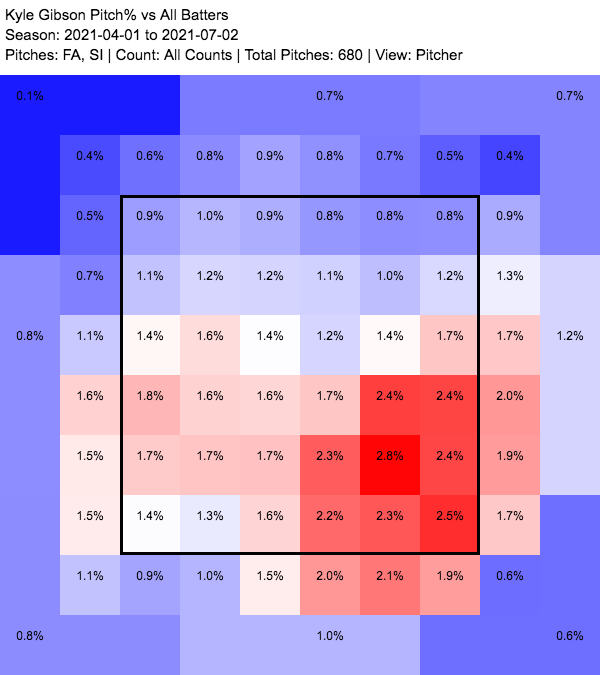
As you can see, there’s a lot of red in that bottom right corner, which would be down and in for right-handed batters, and down and away for left-handed batters. Decent recipe for success, and we did see the results.
Now let’s take a look at Gibson’s heat chart from his last three starts for those same two pitches.
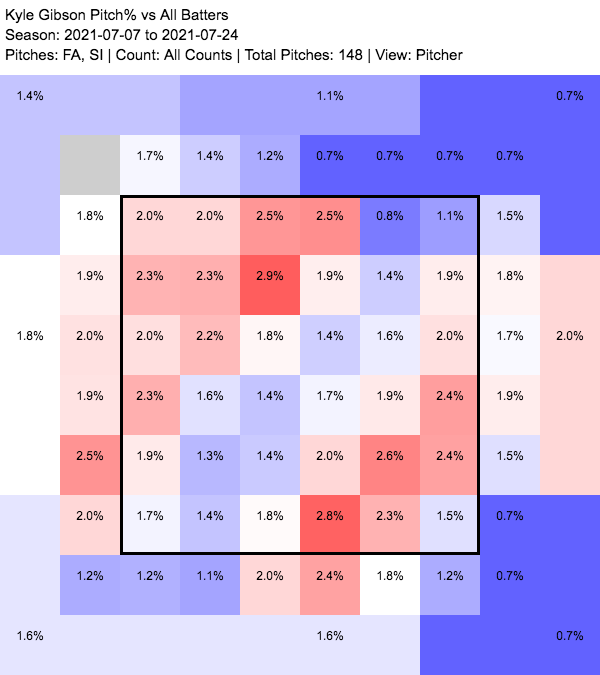
You can see the difference. Way less focus on that bottom right corner, way more pitches left up in the zone and just all around the zone in general on Gibson’s sinker and fastball. With these pitches being left around the zone and up in the zone, while also being used more than half the time, it’s easy to see where Gibson is encountering his issues. And even in his last start, when Gibson only gave up two earned runs, he walked eight batters, and from the heat chart on his fastball and sinker alone, you can see the control is fading. Gibson isn’t hitting his spots.
What we’re going to have to watch now is how these last few starts impact Gibson’s trade value. He could line up for one more start on Wednesday, but the Rangers may elect to just leave things as they lie and not risk another bad start from him. Someone will likely bite, but the control issues aren’t great, even if the team acquiring him does convince him to cut back on the fastball/sinker and use his breaking stuff more often.
Verdict: Panic
Graphic by Michael Packard (@designsbypack on Twitter & IG)
