


In World Series Game 5, Tyler Glasnow had a rough day. Of the 13 balls in play he allowed, 11 were hit 95 mph or harder. The Dodgers’ bats were so loud that MLB.com’s Mike Petriello went digging and discovered that Glasnow’s rough day was actually the worst postseason performance ever in the Statcast era in terms of hard-hit rate.
Highest hard-hit% allowed, 2015-'20 postseason, by a pitcher with a minimum of 10 batted balls allowed in a game. (There were 404 such games.) pic.twitter.com/J0ux5HtySS
— Mike Petriello (@mike_petriello) October 26, 2020
As Statcast defines it, HardHit% is defined as the percentage of balls in play hit at least 95 mph. And it’s important at all because 95 mph is the beginning if the uphill wOBA trend — that’s when exit velocity starts to actually matter. When we talk about it as a percentage, we’re pretending that the only “whole” sample that matters is balls in play.
That’s why something felt off when I saw Petriello’s tweet. Of the six other names on the list, three of them were from pitchers well-known for their gaudy strikeout totals. Glasnow himself struck out seven through five innings. Was he pitching poorly, or was he just striking people out instead of inducing weak ground balls?
Instead of focusing on one game, I decided to take a larger look at Glasnow’s 2020. And I decided to compare him against someone I consider his polar opposite: Dallas Keuchel.
| Player | Tyler Glasnow | Dallas Keuchel |
|---|---|---|
| Hard Hit Balls in Play | 53 | 62 |
| Batted Ball Events | 125 | 198 |
| HardHit% (percentile) | 42.4% (24th) | 31.3% (90th) |
| Total Batters Faced | 238 | 257 |
| HardHit/TBF (percentile) | 22.3% (79th) | 24.1% (55th) |
| Innings Pitched | 57.1 | 63.1 |
| HardHit/9 (percentile) | 8.32 (77th) | 8.81 (63rd) |
All it takes is one bad stat to tell the wrong story. Despite Keuchel’s reputation for suppressing hard contact, he actually gave up more hard-hit balls both per-batter and per-inning than Glasnow.
If you’re not familiar with HardHit/TBF or HardHit/9, that’s because Statcast doesn’t display them. But you should be: HardHit/9 is more descriptive than any conventional hard-contact stat while reaching reliability thresholds faster than BB/9.
One of the best and easiest tools to evaluate contact suppression had been hiding under our noses the whole time.
What’s the problem with HardHit%?
Let’s start by taking a look at Glasnow’s 2020 Statcast “sliders.”
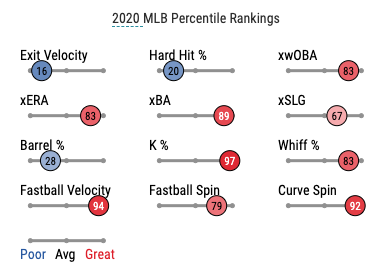
The bottom row — all velocity and spin — are on a per-pitch basis. Whiff% is per-swing. And all of the expected stats and K% are per PA. And the three “contact” stats — barrel%, exit velocity, and hard hit% — are the only stats scaled to balls in play.
Barrel rate in particular is a curious case. The one shown on player pages is Barrels/BBE%. But Baseball Savant also reports Barrels/PA% in its Exit Velocity & Barrels Leaderboard, and makes it the default sort. The per-PA version shows up nowhere else on the entire site.
The difference between these two stats is somewhat similar to the difference between whiff rate and swinging-strike rate. A pitch with a good whiff rate might be hard to hit, but that might not be a good thing — many curveballs with huge whiff rates land well below the zone too often and put pitchers behind in counts. But a pitch with a high swinging-strike rate is usually successful both at convincing batters to swing and at inducing whiffs. That makes it the preferable stat in almost all cases: it tells more of the story.
Data is only as good as what we ask of it. And in the case of hard-hit rate, Statcast pushes us to ask the wrong questions. Both hard-hit rate and barrel rate — two of the most frequently cited Statcast contact stats — push us to think about contact management exclusively in terms of the amount of weak contact that pitchers give up. If we try to compare two pitchers using those stats, the pitcher who strikes out more batters — arguably the most efficient way to suppress hard contact — will be at a disadvantage. And that leaves a huge hole in both our descriptive and predictive toolkit.
What should we be asking?
There are two questions data can answer: what has happened and what will happen. And it’s very rare that one number helps to answer both of them.
Descriptive stats answer the first question. And among them, FIP has been among the best for over a decade. It tries to estimate what a pitcher’s past ERA should have been by cutting out the noise of team defense and keeping only what it assumes a pitcher can control: strikeouts, walks, and home runs. It does bake in some noise — park factors, for example, influence home runs — but its strong correlation with ERA makes it extremely useful for detecting pitchers whose outcomes don’t quite match their inputs.
But as much as the 2020 Red Sox pitchers tried to show us otherwise, home runs aren’t exactly common events. FanGraphs’ statistical library tells us that only after 1,320 batters faced is a pitcher’s home run rate more likely to predict their future home run rate than just using the league average. This is the reasoning behind xFIP, which replaces home runs with fly balls and assumes a league-average HR/FB%. Common events such as fly ball rate are much more stable, which makes them much more helpful for predicting the future. The issue with that approach, though, is that these common events often have only a small impact on past outcomes. FIP massively outperforms xFIP at being descriptive, but xFIP beats FIP on predicting the future.
I bring these shortcomings up to highlight what a good contact stat will do for us. If we hold FIP and xFIP up to the light, we can see the path toward what we’re looking for in the space left by what they miss:
- To reduce variance, it should use an input that happens more often than home runs.
- It should be something that we can confidently show pitchers have control over.
- To eliminate noise, it shouldn’t depend on park factors or team defense.
- We shouldn’t need much context (other than sample size) to use it to compare two pitchers.
How will we know if we succeed?
One of the hard things about predictive stats is that there’s no universal ruler to measure their success with. We’re not looking to clear some arbitrary R2 number (though I’ll set some arbitrary benchmarks later). We’re looking for better than what we have. My approach was pretty blunt — I just pulled every pitcher season since 2015 with at least 100 innings and started checking the correlations that datasets gave me. I’ll be recapping the R2 at the bottom (for those of you using tiny mobile screens, that should make things easier!), but you can hover over the trend lines to get the details. Darker trend lines indicate stronger correlations, and near-invisible trend lines mean weak ones.
So, to get our bearings, let’s start by looking at some things we feel good about: strikeouts and walks.
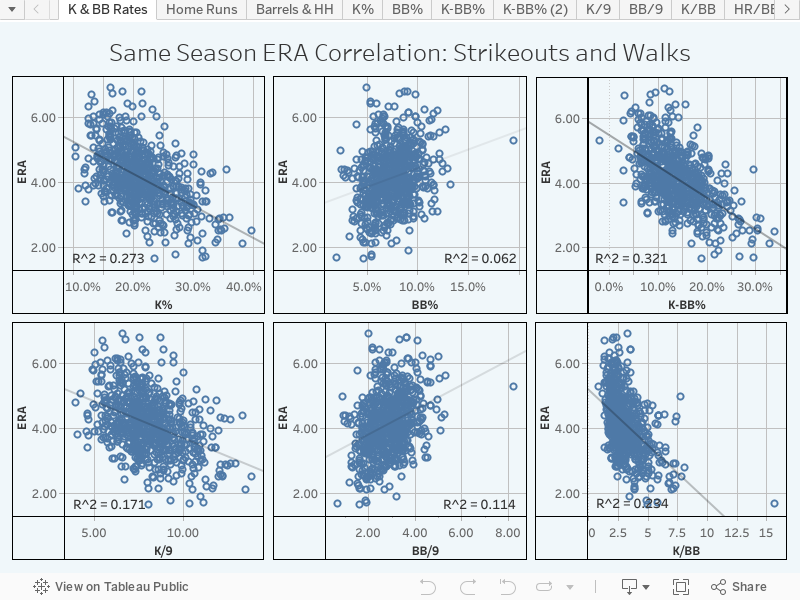
You’ll notice that the average distance from the trend line is much shorter for strikeouts than walks — that’s roughly what correlation measures. The R2 of 0.273 for strikeout rate would mean that, on average, 27.3% of a pitcher’s ERA in a particular season can be explained by their strikeout rate. Put these skills to use, and a few interesting observations pop up early: K% looks far more informative than K/9, but BB/9 looks more important than BB%. K-BB% seems like a solid indicator, whereas K/BB doesn’t. And overall, it looks like strikeouts are far more important than walks. Nothing groundbreaking here; we’re just getting our bearings specific to this dataset.
With this in mind, let’s start with home runs. We know that they aren’t very predictive. But we do know that they have a lot of explanatory power. Just how much, though?
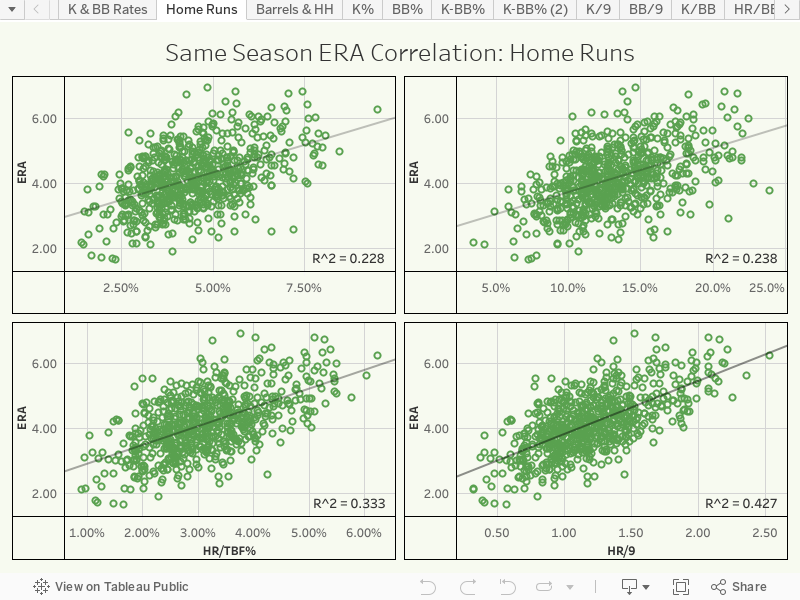
The most effective measure was HR/9, with a staggering 0.427 R2. So, if we’re trying to develop a contact stat, the bar for a good descriptive stat is pretty high. Home runs per nine just do the job pretty well already.
That particular stat bested HR/PA, which I had a hunch would be an effective measure. Why might that be? Well, ERA and HR/9 both have the same denominator, so they’re more like to correlate. It’s also possible that the ratio of runs to outs might contain some implicit information about a pitcher’s ability to generate outs that HR/PA doesn’t include. If you look at BB% and BB/9, we see a similar trend. It’s worth watching.
So we have some bearings for descriptive stats. But if we want to know how predictive a stat is, there are two tests we need to run. First, it’s important to know how well a stat predicts itself. And second, it’s helpful to know how well it correlates to the next-season’s ERA if we want to bake it into predictive stats. Again, we’ll start with strikeouts.
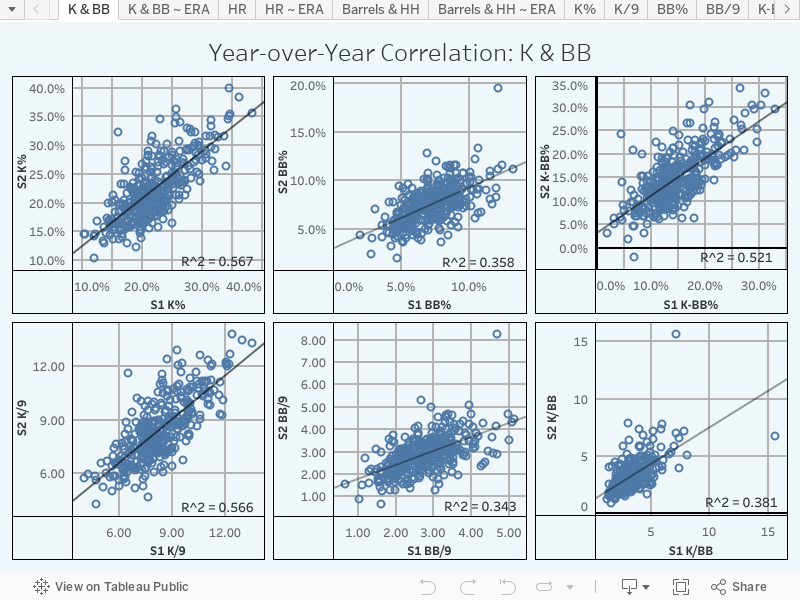
We can tell that strikeout rate is relatively stable, even a season into the future. Their 0.567 R2 is our high-water mark for predictiveness. Walk rate’s .358 R2 with next-year results aren’t as stable, but it’s still decent compared to what we’ll see next with home runs. We knew that pitchers change year-over-year. This data just tells us how and by how much.
As for correlation with ERA, the results aren’t all as strong.
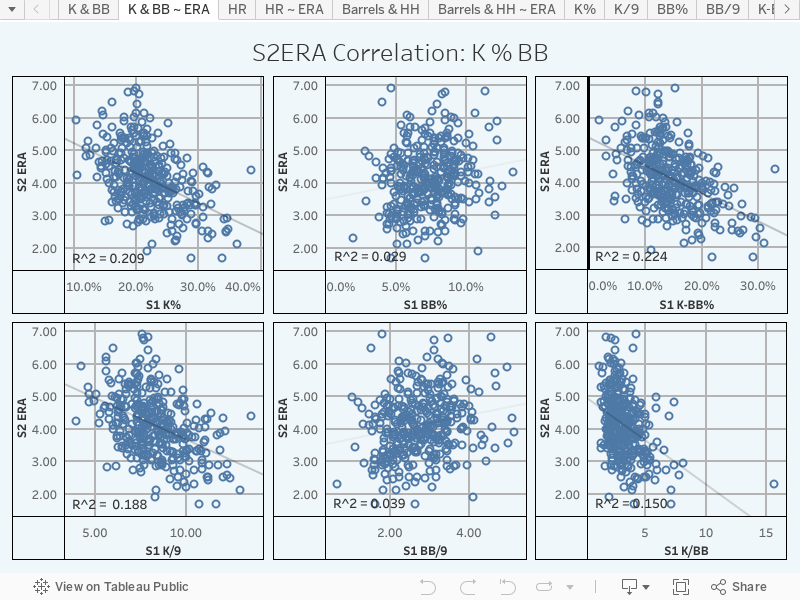
Wondering why you can’t see a trend line with walks? It’s because functionally, there isn’t one. While the 0.209 R^2 for K% is faint, it’s still tangibly there. But the R^2 for walk rate? Just 0.029. K-BB% does beat K%, though, which tells us that walks deserve inclusion in ERA indicators, but that they aren’t a great way of comparing two pitchers as a standalone stat. We’d be thrilled to see a contact stat rival K% for predictiveness, but more realistically, we’d be happy to find one that correlates more strongly than BB/9.
And in case you’re curious, home runs don’t come even close to doing that.
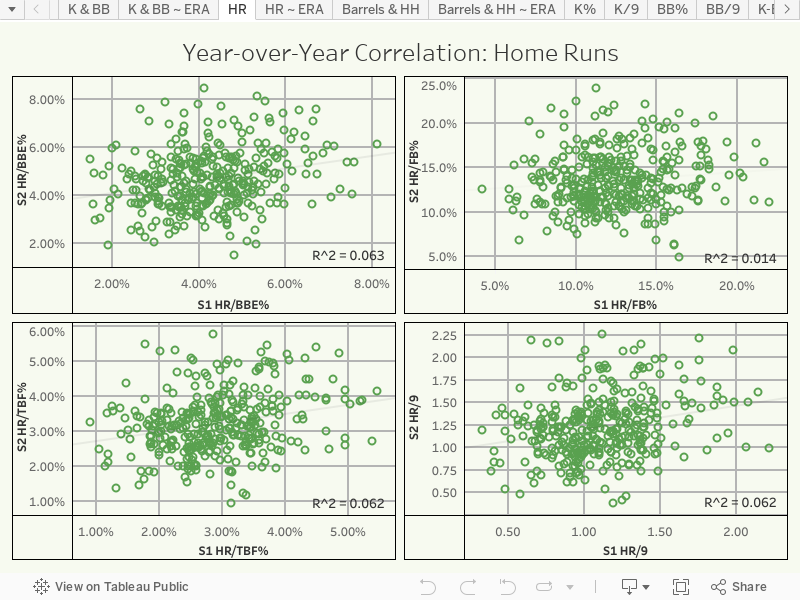
This is the chart that explains why xFIP exists. We should have little confidence that a player’s single-season home run rate — measured in any way — will mean anything going forward. The best formulation of this, HR/9, has just a 0.062 R2 with itself. If you’re wondering why these lines are flat, that’s because the formula ignores the inputs and just uses the league average instead. In other words: place little to no stock into a home runs allowed, even for a full season of work.
As for correlation with ERA? Things get even worse.
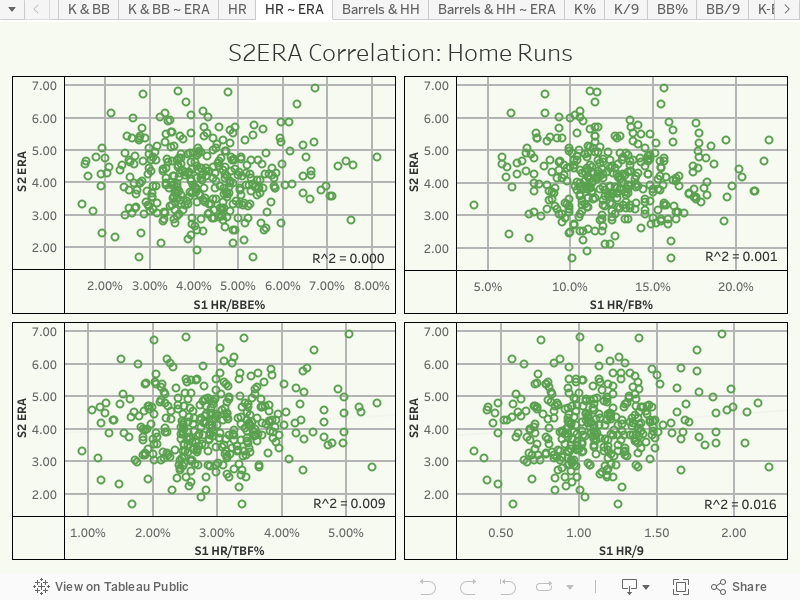
The best correlation here is just a 0.016 R2 for HR/9. That’s actually the only relationship on this chart with a p-value below 0.05, and given the weakness of the correlation and the context, that’s not enough for me to soundly reject the null hypothesis there, either. In layman’s terms: we should doubt that a pitcher’s home run stats are related to their future ERA.
So, to recap, here is each stat’s R2 of correlation for in-season ERA, next-season ERA, and for itself in the next season. Values in red have a p-value greater than their correlation, and stats in green represent the leading indicator in that column.
| Stat | S1 ERA | S2 ERA | S2 Self |
|---|---|---|---|
| K% | 0.273 | 0.209 | 0.567 |
| K/9 | 0.171 | 0.188 | 0.566 |
| BB% | 0.062 | 0.029 | 0.358 |
| BB/9 | 0.114 | 0.039 | 0.343 |
| K-BB% | 0.321 | 0.224 | 0.521 |
| K/BB | 0.234 | 0.150 | 0.381 |
| HR/BBE% | 0.228 | 0.000 | 0.063 |
| HR/TBF% | 0.333 | 0.009 | 0.062 |
| HR/9 | 0.427 | 0.016 | 0.062 |
| HR/FB% | 0.238 | 0.001 | 0.014 |
We can see just how wide the gap between HomeRuns/9 and K% is throughout — they clearly have different uses. K-BB% leading the S2ERA correlation sweepstakes also shows how important it is to consider multiple inputs at the same time.
The completely arbitrary R2 goals I’ve decided to set for a new contact stat are as follows:
- For S1 ERA: better than K%.
- For S2 ERA: better than BB/9.
- For itself in season two: halfway between BB/9 and HR/9 (greater than 0.202).
Which Statcast numbers perform best?
Choosing which numbers to look at is the most difficult task. I knew that I wanted to take a closer look at both hard-hit rate and barrel rate, but I also know that raw exit velocity is cited often enough that it was worth looking into.
After some early testing, I decided not to pursue exit velocity — it had both correlation and prediction issues. I’m including it in my wrap-up in the end, but I don’t suggest building around it. We use hard-hit rate because wOBA gains in exit velo aren’t linear, so taking an average can yield an unhelpful measure. The expected outcomes from four balls hit 90 mph aren’t the same as three balls hit 85 mph and one hit 105 mph, but that would yield the same average.
So, which varieties of hard-hit rate and barrel rate were the most useful?
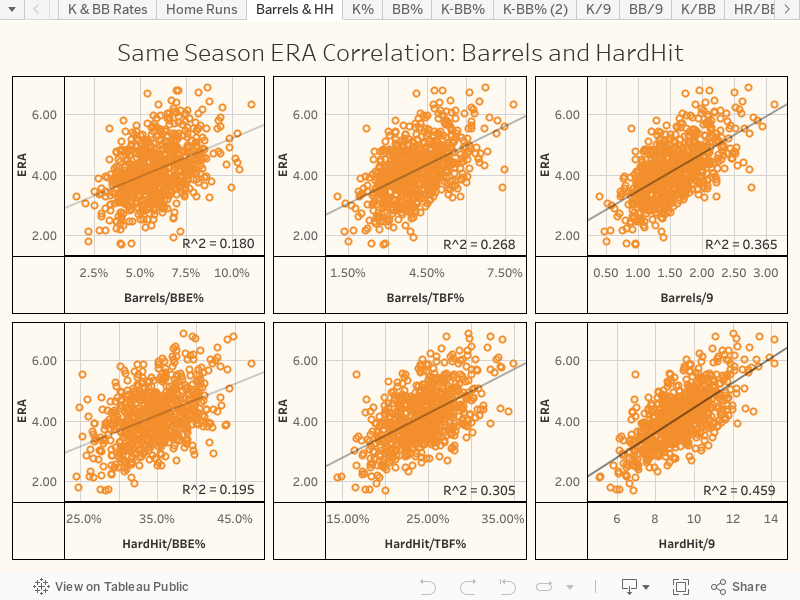
HardHit/9 was the single most descriptive pitcher input stat that I found. Its 0.459 R2 won’t beat ERA estimators like FIP, but that stat takes multiple inputs. As a single indicator, it better explains ERA than home runs do. Based on this alone, it deserves to be included among the premier stats we use to evaluate pitchers. Even its slightly-less-descriptive cousin, HardHit/TBF%, probably has a role. K-HH% is worth looking into as a back-of-the-napkin stat.
As for barrels: they look a whole lot like home runs, don’t they? Connor Kurcon of Six Man Rotation has had a great deal of success using Barrels/BBE% as part of pCRA, but that arrangement was actually the least individually descriptive of the six I’m including here. Again, using per-nine stats looks like the best way to capture variance, likely because it contains more implied information about a pitcher’s ability to get outs. Whether that’s good or not is to be determined. But either way, it looks like barrels are less effective than home runs at describing a pitcher’s past ERA. And that makes some sense: not every barrel cleared a fence, but every home run did.
If we’re looking forward to the next season, HardHit/9 and HardHit/TBF don’t just outperform barrels across the board — they’re almost as stable as BB%.
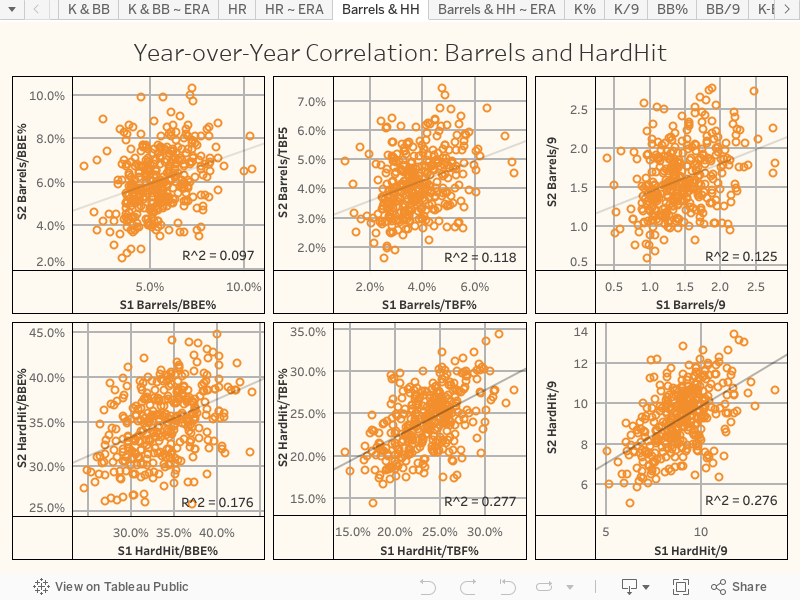
Starting with predicting themselves, HardHit/TBF% — which, as a reminder, has the same denominator as K% — narrowly edges out HardHit/9 to be the most consistent stat. I don’t find the margin to be meaningful — either should be useful. This is more evidence that K-HH% probably has a bright future (as long as you’re using HH/TBF%).
The gap between Barrels/9 and Barrels/TBF% is also small, but the bigger news is that they just aren’t that sticky. A 0.12 R2 is twice as large as the year-over-year correlation for home runs, but still falls comically short of walk rate. In other words: we should be pretty doubtful of its ability to help us look to the future. Given that home runs outperform barrels in descriptiveness, it’s not clear what role, if any, barrels should have in our evaluation of pitchers — there’s always a better option available.
When we look at S2ERA correlations, these lessons play out again.
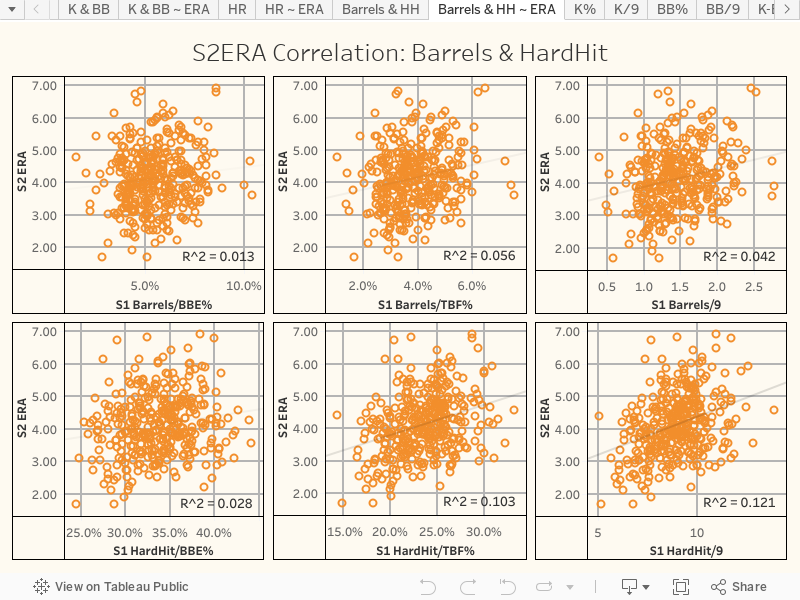
The exactly matches our expectations. From the look of things, HardHit/9 looks like the second-most predictive input we can find, behind only strikeout rate. The gains over HR/9 or traditional barrel rate are, relatively speaking, gigantic.
So, to recap, here’s what we’ve learned so far:
| Stat | S1 ERA | S2 ERA | S2 Self |
|---|---|---|---|
| K% | 0.273 | 0.209 | 0.567 |
| BB/9 | 0.114 | 0.039 | 0.343 |
| HR/9 | 0.427 | 0.016 | 0.062 |
| Barrels/BBE | 0.180 | 0.013 | 0.097 |
| Barrels/TBF | 0.268 | 0.042 | 0.118 |
| Barrels/9 | 0.365 | 0.056 | 0.125 |
| HardHit/BBE | 0.195 | 0.028 | 0.176 |
| HardHit/TBF | 0.305 | 0.103 | 0.277 |
| HardHit/9 | 0.459 | 0.121 | 0.276 |
| ExitVelo | 0.143 | 0.047 | 0.140 |
| Legend: | New Best | Meets Goal | No Improvement |
HardHit/9 met all three of my completely arbitrary goals. It’s not only more descriptive than HR/9 — it’s an order of magnitude more sticky and more predictive of future ERA. It stands head-and-shoulders above the field in everything but predicting itself, where it’s joint-top with HardHit/TBF%.
This data puts to question whether HardHit/BBE% and Barrels/BBE% deserve to be so prominently featured by Baseball Savant. They’re both just a hair better than walk rate at explaining past ERA without predicting the future all that well. They might still have a place in formulas that place them in the correct context, but as standalone statistics, they’re more of a distraction than an aid.
I have broader questions about whether we should care about barrels for pitchers. Even in their more helpful standalone form, they don’t deliver much of an improvement on home runs. I think they’re probably helpful if we’re trying to assess a pitcher who’s moving to a new team. But if a pitcher’s home park and defense aren’t changing, there’s probably not much to gain by using barrels, especially considering HardHit/9 outperformed Barrels/9 at every step.
And as for exit velocity? It might reveal something helpful somewhere. But given that exit velocity returns aren’t linear, we know this stat has holes in it. The numbers bear that out.
When can we trust these stats?
Earlier, when I cited numbers about the reliability of home run rate for pitchers, that relied on a statistical test that can be replicated. Reliability is, as stats go, a somewhat tricky trait to measure well. With the help of Pitcherlist’s in-house data guru, I decided to test it myself.
The method I settled on was a Cronbach’s Alpha test. You can read more about this at Fangraphs, where Jonah Pemstein and Sean Dolinar has provided an exceptional amount of info, including some of the code they used. One of the limitations of this method, though, is that it’s exceptionally difficult to try to calculate reliability for per-9 stats. I decided to just find the per-batter faced stats. Since the per-nine stats were about as efficient at predicting themselves, I think we should be able to use the data to draw conclusions about both.
So how did HardHit/TBF and Barrels/TBF stack up against more traditional stats?
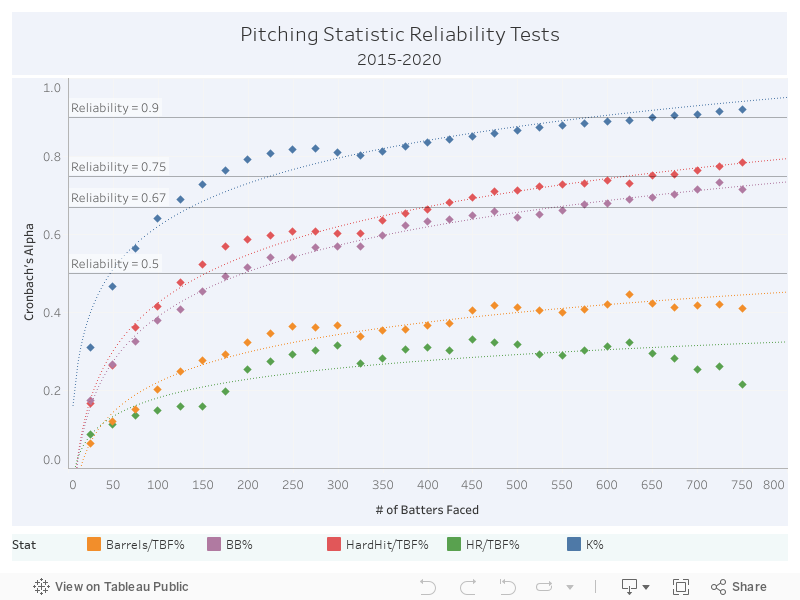
The order of which stats become reliable fastest corresponds pretty closely to which stats had the highest year-over-year R2. The exception? HardHit/TBF% actually becomes reliable faster than BB%! If we’re assuming about 20 batters per start, which is a little more than twice through the order, it would take under ten starts to estimate what a pitcher’s HardHit/9 will be for the rest of the year. And if we assume that the per-nine stats take about as long to level out — remember those year-over-year R2 values — then HardHit/9 is probably also useful in about 10 starts. That means we get meaningful results almost ten times faster from using HardHit/9 instead of HomeRuns/9.
An aside about my data: I suspect that the dropoff in reliability we see around 300 batters faced is because I’ve included 2020 data as well. I suspect I wouldn’t see that if I had only found the numbers for 2015-2019. The same effect presents itself after about 750 batters faced, which is about the maximum. So, the individual outputs get really messy from a lack of additional data. Pemstein describes the effect pretty well — check out his work if you’re curious.
Results at Work
The first and simplest application is K-HH%. But what I thought would be a substantial step up seems like it isn’t. It’s just slightly less helpful than K-BB%. That doesn’t sink it as a metric, but I had higher hopes.
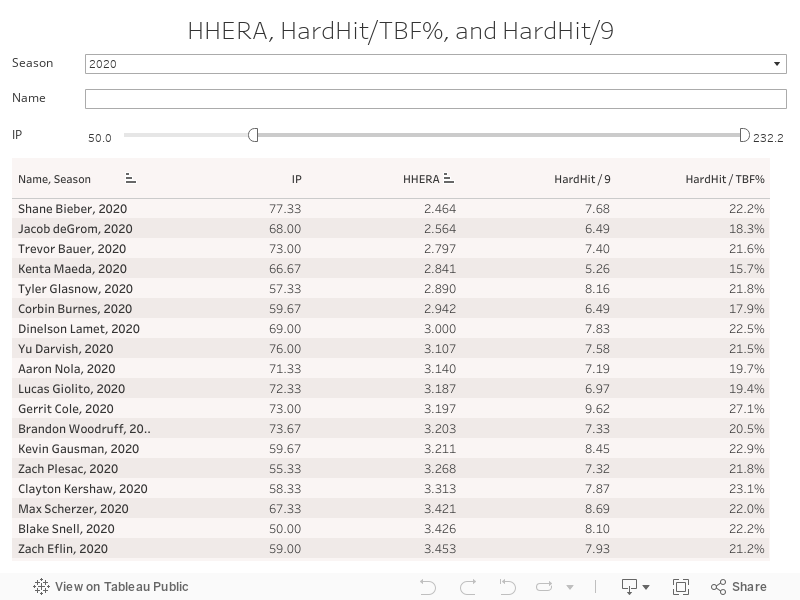
What is extremely promising, though, is my first attempt at an ERA estimator. I’m calling it HHERA (I’ll let you guess what that stands for). It’s pretty simple — I used K%, BB/9 and HardHit/9 in a linear regression to estimate S2ERA.
HHERA 1.0: 4.875703 – (7.991393 × K% – 0.06004585 × HardHit/9 – 0.1678067 × BB/9)
The good news? After running multiple k-fold cross validation, I found that the average R2 was 0.238 with an RMSE of 0.838. This is just behind Dan Richards’ field-leading FRA, and potentially ahead of pCRA (it’s a black box, so I’m unable to run fair comparisons, but HHERA beats its public numbers). I still have work to do to assess whether I should be including other variables or using non-linear models.
I plan on giving this project additional work and with the help of some people who know how to make an ERA estimator work. If that’s you, make sure to reach out.
You can explore HHERA, HardHit/9, and HardHit/TBF% below.
Conclusions
The easiest and most obvious conclusion is that HardHit/BBE% does not deserve to be the stat we call “hard-hit rate.” The same goes for Barrels/BBE%, but at least we have the ability to check those numbers on Statcast leaderboards easily and quickly.
Beyond that, the doors are open for people to take this data and run with it. There’s so much room to take what I’ve started here and apply it to different projects, such as checking to see how pitchers fare after the first time through the order. All of the data I used came from Fangraphs’ leaderboards, which are an excellent way to import reasonably sized files of exactly what you need.
In terms of analysis, I’d hope that this offers convincing proof that pitchers have some control over the type of contact they give up. Exit velocity itself may not be the best way to measure it, but it appears that by treating hard hits as events rather than as descriptors, we can learn a great deal. I’m curious to know whether other stats benefit from a similar perspective.
In any case, it seems that HardHit/9 deserves its place among the core few stats we use when we discuss both how effective a pitcher has been and how effective they will be. It tells us more about both past and future success than walk rate while becoming reliable about as quickly. What’s not to like?
Photos by Cliff Welch, Zach Bolinger / Icon Sportswire | Adapted by Jacob Roy (@jmrgraphics3 on IG)
