


In recent years the increasing prominence of the infield shift has launched a torrent of discussion among fans, pundits and players alike regarding its usefulness and place in the game. The tenor of the dialogue has even turned acrimonious at times, with some calling for restrictions on shifting or an outright ban.
There are potentially viable arguments for both sides of the debate. On one hand, the shift is a simple matter of defensive strategy, akin to when a football defense stacks the box against a good running back on first down or goes into a prevent defense on 3rd and long. Both situations simply involve the defense positioning its players in the best manner possible to react to the talent on offense and game situation.
At the same time, the rapidly growing deployment of the shift is producing distortive effects on how the game is played in a very short amount of time. Certain player skill sets are getting squeezed out of the game before they even have a chance to adjust. Moreover, the use of the shift is resulting in a surge of easy groundball outs, which, along with the increasing incidence of strikeouts and walks, is contributing to an increasingly homogenous and potentially boring product on the field.
This article isn’t intended to push an agenda on the debate, but rather to lay the foundation so fans better understand how the infield shift impacts the game. For instance, how much does the shift affect batting average on pulled groundballs? What is the threshold on pulled grounders for when a team should shift? And how much does the shift actually affect the stat lines of some of the game’s most prominent players? These are all pertinent questions in understanding the scope of the shift’s impact and should be relevant to both casual fans and hardcore fantasy managers alike.
(All subsequent data was procured from the amazing search functionality on Baseball Savant).
What Is The Infield Shift?
Most baseball fans will be familiar with the standard infield alignment, which features two players on either side of the second base bag in a roughly symmetrical formation. The first baseman and second baseman generally cover the right side of the bag (from the catcher’s perspective), while the third baseman and shortstop cover the left side. However, for as much as the subject is discussed, not much time is spent discussing what meets the criteria of a “shift”. Luckily, Baseball Savant and Statcast provide a formal definition, asserting that any formation placing three fielders on one side of second base is a shift.
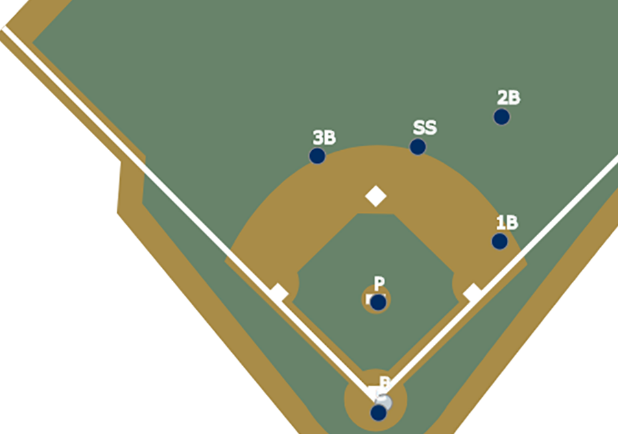
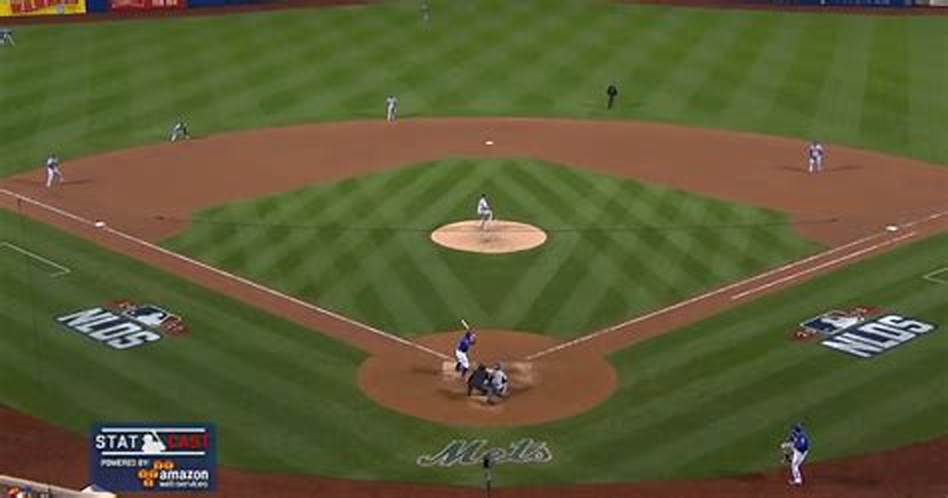
Based on Savant’s criteria, an infield shift against a left-handed hitter would look similar to the picture above, with the shortstop moving into the second baseman’s position, and the second baseman playing a hybrid infield/outfield role that guards against pulled ground balls. The third baseman moves into the shortstop position and the remaining left side of the infield is left vacant. There are a variety of takes on this format. Some feature the shortstop playing directly behind the second base bag with the second baseman playing closer to the infield. Others would position the third baseman closer to the third base bag. However, for the sake of sorting data, all of these variations will be grouped into one “shift” bucket. The central point is that the shift is any formation with three infielders on one side of second base.
How The Shift Works
The decision to apply an infield shift is predicated on if the batter displays a reliable bias towards hitting the ball to the pull side of the infield. An interesting dynamic at play is that all MLB hitters exhibit this tendency. There wasn’t a single batter in 2018 who hit more opposite field groundballs than pull groundballs. The closest candidates were utility man Ian Desmond and OF Delino DeShields, who still favored pulled grounders over the opposite field variety by a relative 50%.
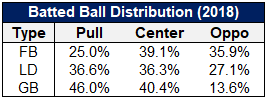
The average MLB hitter hit groundballs 46.0% to the pull side, 40.4% up the middle and 13.6% to the opposite field in 2018. That’s over 85% of all groundballs that go pull or up the middle! Understanding these figures is the first step in contextualizing why the shift works. Even with the average MLB hitter, there is close to a 90% likelihood that a groundball won’t be hit to the opposite field. Moreover, many of those opposite field ground balls would end up as hits no matter what – shift or no shift – given that they’re heavily comprised of slow dribblers that are difficult for the defense to handle.
https://gfycat.com/HeartfeltWateryItalianbrownbear
If 46.0% of all ground balls look something like this, and another 40% goes up the middle, it’s easy to see why teams would start adapting to hitters like Cubs 1B Anthony Rizzo with an infield shift.
Note that the infield shift is not concerned with the pull rates of hitters on line drives and flyballs. Both batted ball types generally clear the infield with ease and are not affected by the positioning of infielders. As a result, it is important to avoid looking at overall batted ball data when determining if a player should face a shift or how much they might be negatively affected by it.
For instance, LF Khris Davis produced an overall pull rate of 34.8% in 2018, in the bottom third of the league, which could indicate that teams shouldn’t apply an infield shift to him. However, most of Davis’ center and opposite field bias came on balls in the air. In contrast, Davis’ groundball pull rate of 52.4% ranked in the top third. As a result, Davis is a good candidate to face an infield shift, and sure enough, he faced a shift on over 20% of his plate appearances last year.
Shifted Numbers
The infield shift first appeared in the 1920s and grew in popularity when St. Louis Cardinals Manager Eddie Dyer utilized it against Hall of Fame Red Sox hitter Ted Williams in the 1946 World Series. However, it’s usage remained largely tangential in the subsequent half-century. Then, as the sabermetric revolution swept across baseball in the 2000s, front offices and managers became wiser to the advantages the shift could provide. If even the average hitter displays very predictable groundball tendencies, then surely there is a large advantage to be gained from shifting infield defensive alignments.
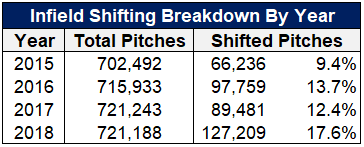
Teams started by only shifting extreme outlier hitters, primarily comprised of lefties that displayed pulled groundball rates north of 60%. By 2015 teams were employing an infield shift on 9.4% of all pitches thrown, which was a significant but hardly game-changing amount. Teams gradually became more liberal with their shifting thresholds and a big jump occurred in 2016, as the rate increased from 9.4% to 13.7%, a relative 45% increase. However, progress stalled in 2017 as the number of shifts actually decreased, likely the result of an overreaction to the “fly ball revolution” which swept baseball that year.
2018 witnessed the largest increase in shifting in recent years, with nearly 30,000 more infield shifts deployed than the previous season, bringing the total shifting share to 17.6% of all pitches. Despite the overall increase, there is a large disparity in shifting among franchises, with the forward-thinking Astros leading the way at a 37.3% shift rate and the Angels trailing the pack at 3.3%. The Rays, Twins, Yankees, Royals and White Sox round out some of the other top shifting teams, while the Cardinals, Cubs, Rangers, and Padres are some of the other laggards.
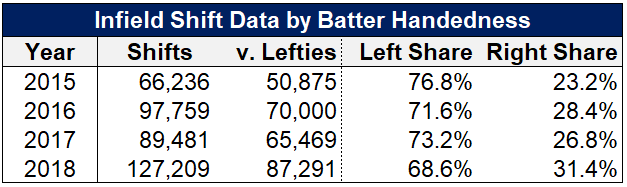
Due to some structural realities to be discussed in subsequent paragraphs, shifting against left-handed hitters is more effective than against righties. As a result, the nascent stages of the shifting revolution focused mainly on shifting left-handed batters. However, slowly but surely, teams became more daring in their approach, and the share of shifts devoted to righties increased from 23.2% in 2015 to 31.4% in 2018. In spite of this, certain teams, like the Toronto Blue Jays and Boston Red Sox, continue to employ organizational philosophies favorable to left-handed shifting but completely shut off to right-handed shifting.
There are a variety of variables that will affect how teams shift in the future. I believe that shifts against left-handed hitters will continue increasing given their robust suppressive effect on batting average, while righty shifting will slow given structural issues related to placing three players on the left side of the infield. Currently, teams shift left-handed hitters at a 32% rate and righties around 10%. Given that 2018 witnessed six teams shift lefties less than 20% of the time, and 11 teams shift righties less than 5% of the time, there is still significant low-hanging fruit to be gleaned by increased shifting.
Some argue that, if fly ball rates continue to increase, teams will have less incentive to shift the infield, which could result in fewer shifts. However, this is unlikely, since even though more fly balls will reduce the overall value of shifts, their impact on ground balls will still remain objectively positive. For a crude analogy – if someone is giving you free ice cream, and they reduce the serving size from three scoops to two scoops, you still take the free ice cream. Another point to consider is that hitters on the extreme end of the fly ball spectrum are some of the biggest victims from the shift because selling out for fly balls seems to result in a swing plane that is prone to producing pulled ground balls. Thus, while the overall amount of ground balls hit across the league might decrease going forward, the amount of pulled ground balls could stay the same or even increase, as they did from 2017 to 2018 (pulled grounders increased from 18.9% of all batted balls to 20.5% in spite of an overall decline in groundballs and the large increase in shifting).
Lefty vs. Righty Conundrum
Circling back to the Khris Davis example from earlier. Despite hitting pulled grounders close to the 70th percentile, Davis was only shifted on 20% of his plate appearances in 2018. With a groundball pull rate comfortably above 50%, it would seem like Davis should have been shifted more. However, Davis is a right-handed hitter, and there are certain structural limitations to shifting righties that don’t apply to lefties.
Most shifts against a righty batter appear something like the above. The pull side of the infield looks fairly similar to the pull side on a lefty shift (see the first photo in the article), however, the opposite field alignment is different. In a righty shift scenario, the first baseman is limited in how far he can stray off first because he needs to stay in close proximity to complete the putout. This leaves a much wider hole to the right side of second, which hitters can exploit since 40% of all grounders are hit to center. Sure enough, the shift is worse at preventing hits up the middle against righties, ceding a .260 batting average on groundballs compared to .240 under a standard alignment.
In the left-handed shift scenario, the third baseman can stray close to second base and better cover balls hit up the middle. As a result, lefties have a substantially lower batting average on balls hit to center against the shift (.214) compared to standard positioning (.241). This deviation in performance against groundballs to the center is why shifts against lefties work better than against righties. And while it’s true that a shift against a lefty leaves the opposite field more exposed than a shift against a righty, this fact is largely irrelevant since most shifted hitters hit grounders to the opposite field less than 10% of the time.
This deviation is further exacerbated when a runner is on first, a situation that covers roughly 12% of plate appearances. If a runner is on first, the first baseman needs to hold the runner and keep their foot on the bag prior to pitch, resulting in a wider vacancy on the field in relation to the second baseman. This positioning actually increases the frequency of shifting against lefties (34% with no runners compared to 47% with runners on first), since teams are incentivized to cover the gap created by the first baseman holding the runner. However, against righties, this situation results in the first baseman ceding almost the entire right side of the infield to the hitter, which is not a tenable situation. Unsurprisingly, teams reduce their shifting against righties from 13% of pitches with no runners on to 5% with a runner on first.
What The Numbers Say
Since shifting is primarily concerned with defending ground balls, the best method for evaluating its effects on offense is also the simplest: batting average. Ground balls rarely ever go for extra-base hits and are the least affected batted ball type by park and environmental factors, so we don’t need to be overly concerned with wRC+ and xwOBA type statistics.
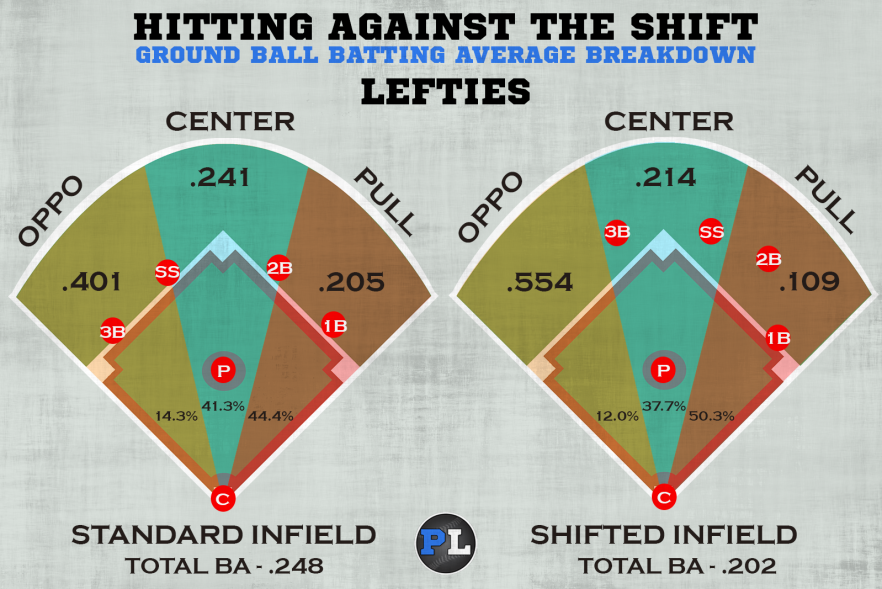
From 2015 to 2018, left-handed hitters maintained a .248 overall batting average on groundballs against a standard infield alignment. However, there were significant discrepancies in batting average depending on where the ball was hit. Pulled ground balls, which comprised 44.4% of the set, produced a middling .205 batting average, likely due to the relative ease of a first baseman completing his own put out at first or the short distance of the throw from second to first. Ground balls to center converted at a .241 clip, while grounders to the opposite field earned a .401 average. The average exit velocity to the pull side and up the middle was nearly identical at 85 MPH, while the exit velocity to the opposite field was only 80 MPH. It’s likely that elevated average on ground balls to the opposite field results from softly hit dribblers that are difficult for the third baseman or pitcher to handle. However, this statistic isn’t very relevant since even non-shifted hitters only hit grounders to the opposite field 14.3% of the time.
Against a shifted alignment there are significant differences in these averages. The overall batting average on shifted groundballs was .202 from 2015 to 2018, a nearly 50 point reduction from the non-shifted .248 average. Another thing to note is the change in the spray profile. Unsurprisingly, hitters facing a shifted alignment pull the ball more, with a 50.3% pull rate on grounders compared to 44.4% in the standard scenario. Two-thirds of this increase came at the cost of grounders up the middle, while one-third results from a reduction in opposite field grounders.
The most relevant difference in results comes on pulled ground balls, with a nearly 100 point decline in average from .205 to .109. While this finding is intuitive, the magnitude of the effect is surprising, as the shift has basically turned a pull grounder from a lefty into a nearly automatic out. Ground balls up the middle decline in effectiveness from a .241 average to .214 average, while balls hit the opposite field increase in their conversion to hits by over 150 points.
Some might look at the .554 average on oppo grounders against the shift and assume it’s definitive evidence that hitters should bunt more or aim opposite field. However, remember that even the most well-balanced hitters only hit opposite field grounders at about a 15.0% rate. Hitting a ground ball to the opposite field is not natural, and given the much lower exit velocities on those hits, it clearly is not the result of optimal contact. Forcing power hitters like Texas slugger Joey Gallo and St. Louis 1B/3B Matt Carpenter to aim for weak, opposite field contact might increase their batting averages slightly, but would likely have large negative second and third order effects in terms of their ability to hit for extra bases and drive in runs.
The sample of hitters being compared between standard infield and shifted alignments is different, with the shifted batters averaging exit velocities approximately 0.5 to 1.5 MPH higher on their grounders depending on their direction. This means that, if anything, the batting average discrepancies could be even higher between the standard and shifted alignments if adjustments were made for quality of contact.
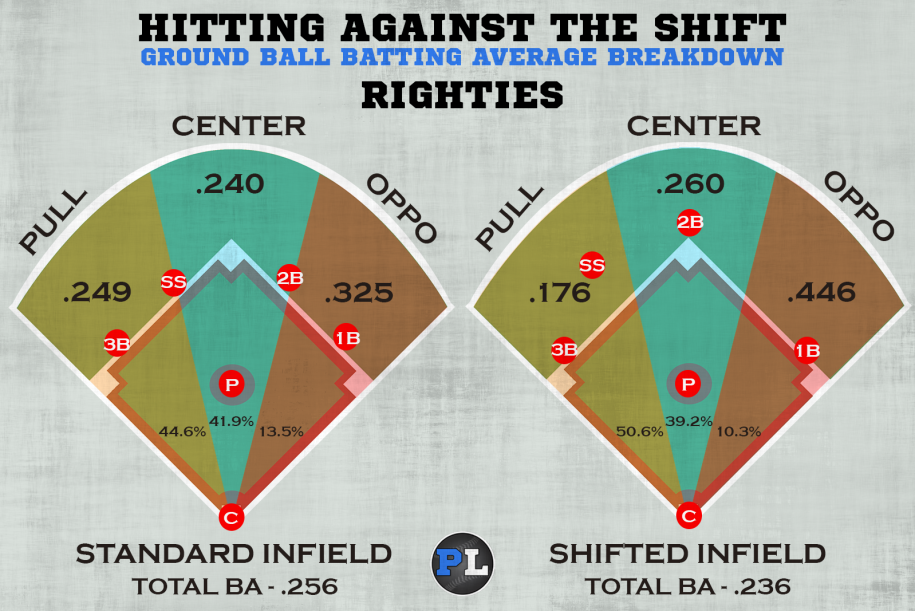
Right-handed grounders to the pull side result in a .249 average against standard alignments compared to .205 for lefties. This structural discrepancy is likely the result of the increased time and difficulty in transferring the ball from the left side of the infield to the right side to complete the putout. The righty average up the middle is virtually identical to the lefty at .240, while the opposite field average is lower at .325. Once again, opposite field ground balls are actually the best at producing base hits, likely because of their 79 MPH average exit velocity resulting in difficult plays for the defense.
The shifted alignment against right-handed hitters reduces overall batting average on grounders from .256 to .236, a much more muted effect than the decline against lefties. This is why right-handed shifting has a glass ceiling on its effectiveness. As mentioned earlier, the primary difference in results come on balls up the middle, where right-handed shifting is actually 20 batting average points worse than the standard alignment.
Certain right-handed hitters with very extreme groundball pull splits, such as Mariners 1B/DH Edwin Encarnacion, are shifted regularly despite these issues. Encarnacion’s 56.3% shift rate paced right-handed batters in 2018, with Cubs 3B Kris Bryant, Phillies’ 1B Rhys Hoskins, and Mets 3B Todd Frazier all experiencing shifting in over 40% of their plate appearances. However, it’s unlikely these players ever face the 70-80% infield shifting rates that that left-handed bats like Gallo and Carpenter experience. I guess it’s good to be right.
Getting Shifty With It
Part two of this series will dive further into the future of infield shifting and how rates might stabilize in the future. From there we will explore which hitters might experience further declines in production as shifting becomes increasingly mainstream across MLB. We will also take a deep dive into how the shift affects the stat lines of some of today’s best hitters, setting up baselines to properly evaluate the effect of shift rates on stats like batting average, on-base percentage and slugging, as well as traditional counting stats like runs and RBIs.
