


Much of the conversation around Major League Baseball to this point in 2024 has been centered around the ongoing rash of prominent pitcher injuries we’ve seen in the first few weeks of the season, and it’s not hard to see why. Spencer Strider, Shane Bieber, and Eury Perez are among the most recognizable starters to have their seasons ended just since the beginning of spring training, with Jacob deGrom, Shane McClanahan, Walker Buehler, Robbie Ray, Jeffrey Springs, and Sandy Alcantara all currently rehabbing from major arm injuries.
Due to the volume and stature of the injured arms we’ve seen, the public perception of the issue is that it is worse now than it has ever been. That’s not entirely true; April is always the worst time of the year for arm problems for a variety of reasons. Still, there’s no denying that this trend, illustrated below as part of a piece by Ben Lindbergh, is a scary one.
There are numerous factors driving the pitcher injury epidemic, including but not limited to increased fastball velocity across the league, the rise of 90+ MPH breaking balls, potential increases in fatigue resulting from the new pitch clock, and the sudden ban of adhesive substances forcing pitchers to change their grip on the baseball to retain command. I’m not here to go in-depth about each and every one of these concepts, but there is one that I find endlessly interesting: the difference between a pitcher’s average and maximum pitch velocity.
Looking into how frequently a pitcher is throwing close to their maximum can give us insight into how much strain they are putting on their body and which pitchers are intentionally reaching back for more when they need it. With how much incentive there is to throw as hard as possible as a Major League pitcher right now, maybe guys who can pace themselves more throughout an outing are putting themselves in a better position to avoid injuries over the course of the season.
Maximum Effort, Maximum Frequency
While the validity of the root causes attributed to pitcher injuries is hotly debated, it’s widely accepted that velocity is a huge part of the equation. Modern arms are put under more stress on a day-to-day basis than ever before thanks to the high demand for outlier pitch movement, velocity, and strikeouts across the league, and pitchers are inching closer to the upper limits of the human body with each passing season.
When a starting pitcher takes the mound in a Major League game, they will establish a range of pitch velocities throughout their outing as the number of pitches they throw accumulates. For most analyses that we do to evaluate pitchers, we exclusively factor in average velocity, as it represents the bulk of pitches thrown and a more true reflection of that pitcher’s quality.
For this bit of analysis, however, we want to zero in on a pitcher’s average velocity in relation to their maximum velocity. Doing this can provide some insight into how often modern pitchers throw near their maximum effort and, in turn, put more acute stress on their throwing arm during an outing.
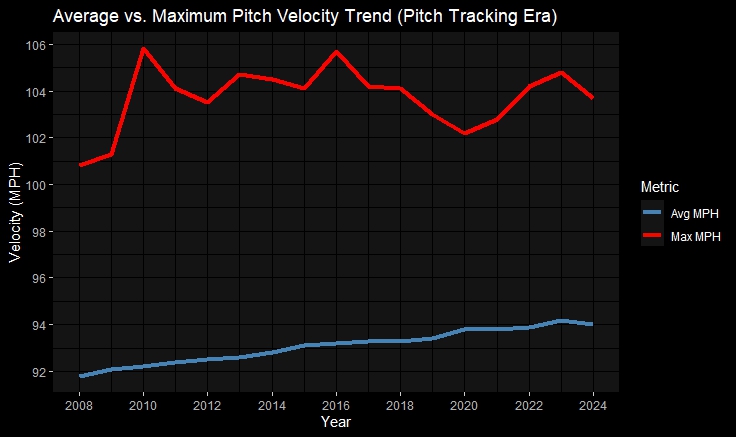
Clearly, pitchers have been steadily creeping closer and closer to the league’s maximum velocity throughout the pitch-tracking era. The average fastball in 2008 just barely cracked 90 MPH, but that figure has risen over 4 MPH in the roughly decade and a half since. We now have pitchers who are comfortably sitting in the mid-90s with their fastballs for upwards of 50 pitches every five days for nearly six months over the course of the season, and that’s discounting bullpens and throwing sessions between outings.
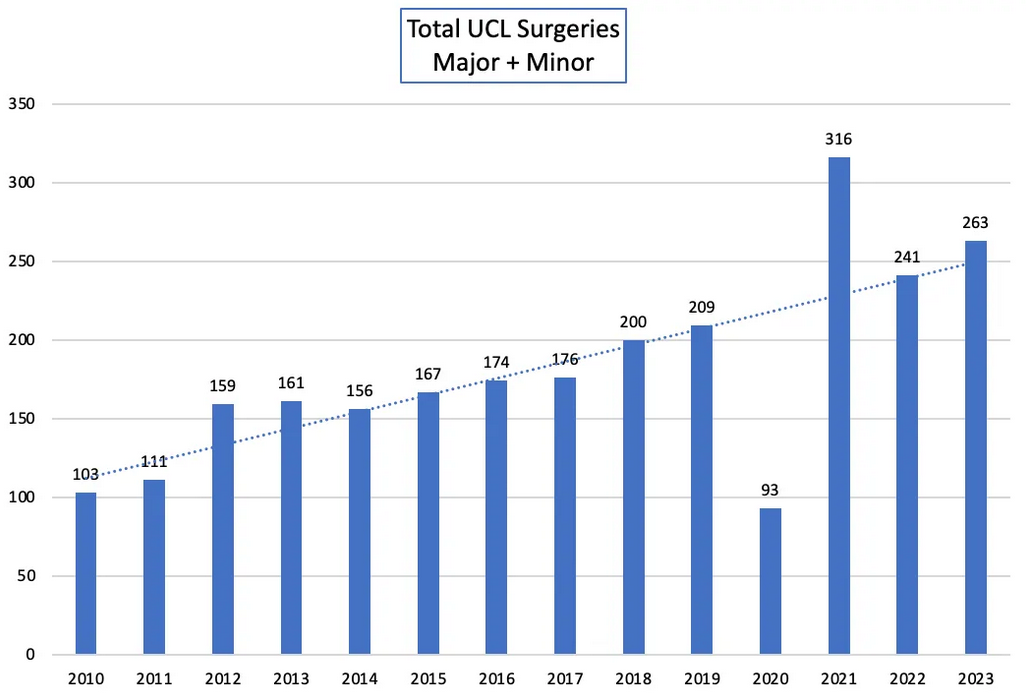
Needless to say, that trend aligns pretty comfortably with the growing number of elbow surgeries performed throughout the major and minor leagues in that same time frame. Combine that with the decreased per-pitch rest time enforced by the pitch clock and the growing problem of year-round throwing for amateur and professional pitchers, and you have a recipe for disaster.
And that’s just fastballs! The increase in breaking ball usage over the last handful of years has also likely played a role in exacerbating the issue. Using sliders as an example because they are normally the hardest breaking ball variant, usage has grown from around 14% in 2008 to 22.4% thus far in 2024. When you have some pitchers out there throwing their average slider harder and more frequently than most pitchers’ fastballs in 2008, that’s sure to contribute to cumulative stress on the pitching arm.
Now that we’ve established that pitchers are sitting closer to their maximum, I want to start thinking about average and maximum velocity separation less through the lens of injury and more through the lens of performance. If pitchers are more likely to injure themselves sitting just 2-3 MPH outside their physical limitations, is there a way to widen that gap while still retaining a comparable level of performance?
It’s All About Incentive
One of the tempting takeaways from the previous discussion about velocity separation might be that pitchers should just ease off the velocity a bit on average and sit farther away from their limit. That sounds like a reasonable conclusion initially, but there is overwhelming incentive for the modern pitcher to throw their absolute hardest as frequently as possible when the only tangible drawback is a lengthy injury absence.
Let’s just take a look at how hitters have fared against fastballs in various velocity brackets so far in 2024 to get a better idea of how much sheer pitch velocity affects expected batter performance.

From the perspective of those in charge of building major league teams, it’s easy to see why you could look at this and just salivate over it. From a player perspective, your takeaway from this is that in order to become sustainably successful in the big leagues as quickly as possible, you should be throwing at least 95 MPH on average. Hitter performance dips steadily and drastically the further above 96 you get, so it’s an absolute no-brainer to try maxing out your velocity.
That goes for in-game decision-making as well. It’s easy to say “Why don’t you just sit 92-94 and reach back for 96+ when you really need a swing and miss?”, but why would a pitcher even bother throwing pitches that yield poor results on average when they are physically capable of maintaining higher velocity? It’s better for a pitcher to make it to the big leagues by flashing elite velocity and risking a trip to the major league injured list (making major league money) than it is to risk never making the league at all.
Also worth noting is the incentive placed on younger amateur athletes to throw hard as early in their career as possible. We have this idealized version of a crafty major league pitcher who can dot the edges of the zone and doesn’t rely on velocity, but the reality is that those guys probably threw much harder than their peers as amateurs and “control & command” guys simply don’t get scouted unless they can bring the heat.
Velocity is projectable for MLB teams; it’s easier for them to develop players with natural arm talent than it is to wait and hope on guys who can throw strikes. Essentially, if you want to advance past high school level baseball as a pitcher, you’re going to have to throw hard.
What if, then, there was a counter-incentive to simply throwing the ball as hard as possible? What if there existed a way to convince pitchers that backing off velocity and establishing a lower cruising speed was actually beneficial? There would need to be extensive research to back this up, so let’s explore the idea.
Pull Back the Reigns?
To better convey the idea I’m trying to get across here, I’ll use an anecdotal example featuring two current MLB pitchers with some of the widest separation between their average and maximum fastball velocities: Kevin Gausman and Nestor Cortes. Let’s look at how their fastballs perform in a tight band around their average velocity and in a range around their maximum velocity. In other words, let’s see how these pitches fare when these guys are cruising vs. when they’re really reaching back and trying to blow it by the hitter.
This table shows us how hitters are performing against Gausman’s and Cortes’ fastballs when they are cruising at their average velocity and when they reach back to approach their maximum. In Gausman’s case, that’s 93-94 MPH on average and 96+ on the higher end, whereas Cortes’ sits 91-92 and can reach back for 93+. The Delta is representative of how much worse hitters are performing against their fastballs when they are thrown toward the upper end of their velocity range.
As you can see, Gausman is normally a couple of ticks quicker than Cortes with the fastball and is capable of cranking it up to 96+ when he needs to. Cortes sits comfortably in the low-90s and can reach back for 93+. You’ll notice that Cortes’ four-seamer performs better than Gausman’s when both pitches are around their average velocity. That has to do with other factors that I’m not considering here like induced vertical break and the pitch repertoire surrounding it.
What you’ll also notice is that Cortes’ fastball becomes downright untouchable when he rears back for 93+ MPH, yielding a nearly 200-point drop in expected batter performance compared to its average velocity. Comparatively, Gausman’s fastball definitely becomes better when he goes for 96+, but the improvement in results isn’t quite as dramatic.
That right there is the phenomenon I’m trying to isolate here. What if pitchers who sit in the low to mid-90s with their fastballs experience a larger increase in performance when reaching the upper end of their velocity range compared to pitchers who sit in the mid to high-90s and reach back for near triple digits?
To put it another way, what if it is more beneficial for certain pitchers with lower average fastball velocities to reach back for an extra 2-3 MPH than it is for pitchers with higher average velocities? It’s a bit difficult to thoroughly evaluate the merit of this idea thanks to the fact that there are numerous other factors that influence how a fastball performs in-game from pitcher to pitcher. Still, it’s an interesting thought with potential implications for player development.
When discussing Cortes’ fastball usage, one might be tempted to say, “Look at how good that pitch is above 93 MPH! Why doesn’t he just train velo and sit 93-95 all the time?”
There is, however, a fair argument based on this data that his fastball is already good at 91-93, and cranking it up any further on average could not only expose him to increased injury risk but decrease the effectiveness of the pitch altogether. In a way, you could say that when a pitcher with high separation between their maximum and average fastball velocity dials it up and approaches their max, it could almost act as an extra unique pitch.
There would still be an incentive to throw harder regularly because those pitches will normally play better, there could be room for creativity here. Cortes’ fastball is already good in its lower velocity bracket, so he can succeed sitting there and throwing harder when he needs to. Having fastballs in both velocity bands appears to almost diversify his arsenal just based on velocity. Combine that with his unique delivery, and you get a pitcher who is incredible at messing with the timing of opposing batters.
Implications
There’s no doubt that getting pitchers to ease back on velocity at the major league level, especially in the minor leagues would be an uphill battle. Throwing hard is the best way to get noticed and fast-tracked to a major league roster spot, and arguably the best way to sustain success once you get there.
Still, maybe there is a route to success reliant on lower average velocities that more established major league pitchers would be willing to explore. One thing that I noticed when looking through the leaderboards of pitchers with the highest maximum-average fastball velocity separation is that a majority of these seasons came either from seasoned veterans or younger pitchers who already had a few good seasons under their belt. Here are the individual starting pitcher seasons with the highest fastball velocity range in the Statcast era:
Among these pitchers, Carlos Rodón’s 2016 and Freddy Peralta’s 2019 were their sophomore seasons in the major leagues, and Shohei Ohtani’s 2021 was his first full season as a starter. The rest are well-established veterans who had been around for several years at the time of their listed season.
Perhaps a way to mitigate velocity-related injury risk for a starting pitcher would be to leverage velocity to establish yourself in the major leagues, then see if you can use greater velocity separation to retain your effectiveness without throwing near your max at all times. Maybe veterans of the league who know themselves as pitchers develop this skill as sort of a survival tactic, allowing them to not only avoid injury as their body becomes more susceptible to breaking down but to stay in the league longer than they otherwise would.
Gleaning wisdom from veteran pitchers about how they maintain a high level of performance for longer periods of time could be part of the solution.
From a fan perspective, however, conceding the fact that your favorite, most exciting young starters will likely miss a significant amount of time at some point in their early career with arm injuries is pretty painful. Shane McClanahan is my absolute favorite starter to watch, and I haven’t seen a pitch from him since August of last year and likely won’t until this time next year. Being a fan of pitching right now is tough because you see an incredible amount of talent on a daily basis, but it feels infinitely more fleeting now.
There are countless factors contributing to this phenomenon, none of which figure to be easy to address. Still, I think exploring any different approaches to in-game performance or training and maintenance between outings will become more and more important as the volume of injured arms across the league continues to swell.
While this is preliminary research into the concept, utilizing velocity separation could be an interesting path that allows pitchers’ talent to shine at all levels while also safely using the full breadth of their arsenal to produce results.
Photos by Icon Sportswire | Featured Image by Justin Redler (@reldernitsuj on Twitter)
Good read, thanks. This seems intuitive, yet rarely discussed. Like running, you have to pace yourself based on the distance. A closer usually doesn’t have to worry about going multiple innings, let alone six or eight. So, he can max out at a much higher rate than a starter or long middle reliever with much less risk of injury.
I also think command and control are sacrificed for velocity.