


So far this season, Brendan Donovan is excelling, posting a 138 wRC+ in his first couple hundred major-league plate appearances.
But a look under the hood tells us that there’s more to the rookie Cardinal’s story. In this year’s run environment, players are underperforming their xISO by .031, while Donovan is over-performing by .043!
In this article, I’ll look at Donovan’s over-performance and explore one potential method for quantifying the role that base-running plays in slugging percentage.
A Problem with ISO
Isolated Power or ISO is a simple but powerful metric. To calculate it, you simple subtract a player’s average from their slugging percentage. In effect, this makes ISO a simple way of looking at extra-base power alone. There’s an obvious flaw, though, in ISO’s ability to describe power output: sometimes players turn singles into a double, doubles into triples, and triples into inside the park home runs.
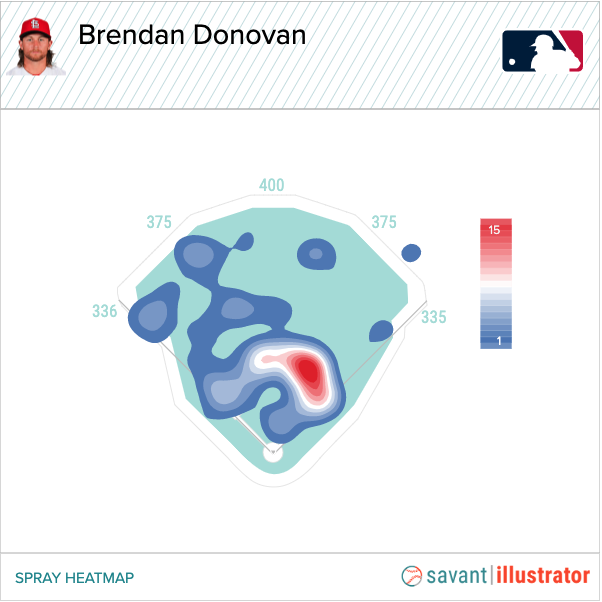
Donovan is a good example of this. The left-handed hitter has just two home runs on the season and just two barrels. His inflated ISO comes from hitting gap-to-gap and from stretching singles into “hustle doubles.” Take a look at this low line drive, cut off by Tucapito Marcano, that Donovan narrowly turns into an extra-base hit:
https://gfycat.com/jaggedpoliticalhammerheadshark
Now, this is the kind of batted ball that could easily go either way. Off the bat, a double is certainly possible. But for many players, Marcano’s quick time to the ball would prevent extra bases. Donovan’s decision to take that chance might explain how Donovan has continued to over-perform his expected stats.
Consider, for a moment, how far reaching this ambiguity in ISO can be. It’s not uncommon to hear about minor league prospects whose ISO is inflated by doubles on account of lower-quality fielding. Giancarlo Stanton is an example of the opposite side of the spectrum. His lack of speed and penchant for hard-hit line drives regularly turns barrels into singles.
Like other expected stats, Expected ISO or xISO provides an estimation of ISO based on how likely a given batted ball is to produce extra-base hits. That over-performance can be correlated with a few things. For example, a player might accomplish better power results by pulling the ball in the air, by sprint speed, or by producing backspin.
While we don’t have publicly available measurements of batted-ball spin, we can rule out sprint speed and spray angle in Donovan’s case. His 55th percentile sprint speed is middling, and Donovan usually hits the ball in the air to left field, as he does above:
Now, perhaps Donovan’s performance is simply based on luck, but I’d like to explore one potential explanation: base-running skill. After all, speed and base-running acumen aren’t correlated one-to-one. Since ISO incorporates all taken bases, it doesn’t differentiate how those bases were taken in the first place.
Introducing IBT
Isolated Bases Taken is an exploratory way of attempting to quantify this aspect of the running game. Other base-running stats, like BsR, incorporate things like stolen bases, times caught advancing, and runs scored. These stats don’t look at a hitter’s success while advancing because a single-turned-double is simply a double in the box score.
This is where xStats come into play. The basic idea behind IBT is fairly straightforward: IBT compares the ISO and xISO on balls-in-play.
IBT = ISOBIP – xISOBIP
This method has a few things working in its favor. By subtracting xISO from ISO, IBT reflects familiar expected vs. real stats like wOBA-xwOBA. Moreover, by looking at balls-in-play alone, IBT excludes home runs altogether. This means IBT discards the kind of ISO over-performance that results from things like pulled home runs and short outfield walls.
It should be noted, though, that unlike other results-minus-expected-results stats, IBT looks at over-performance as a skill indicator. In other words, if a player’s ISOBIP is higher than their xISOBIP, this might reflect a player’s ability to take extra bases on the base-paths.
Here’s a look at top and bottom thirty players by IBT in 2022:
A few things about these lists immediately stand out. For one, this is an eclectic bunch of hitters reflecting a wide range of skill sets. While the bottom 30 is chock full of slow, masher types, the top 30 is made up of slow and fast players alike.
Moreover, neither side correlates well with comprehensive offensive metrics. Both lists range from well-below-average to truly elite players. This makes sense, since IBT doesn’t simply reproduce SLG – xSLG.
Another important thing to notice is that nearly the entire board is negative. This is to be expected. As noted above, changes to the ball in 2022 have resulted in league-wide xStat underperformance.
Forecasting Future IBT
Up to this point, I’ve only really looked at the theoretical aspects of defining IBT. I’ve explained some reasons why I think IBT is a helpful description of one aspect of performance, but I haven’t established that IBT looks at anything other than luck. So, before closing, I’ll offer some preliminary analysis of how well IBT predicts future IBT, before concluding with some potential improvements to make in the future.
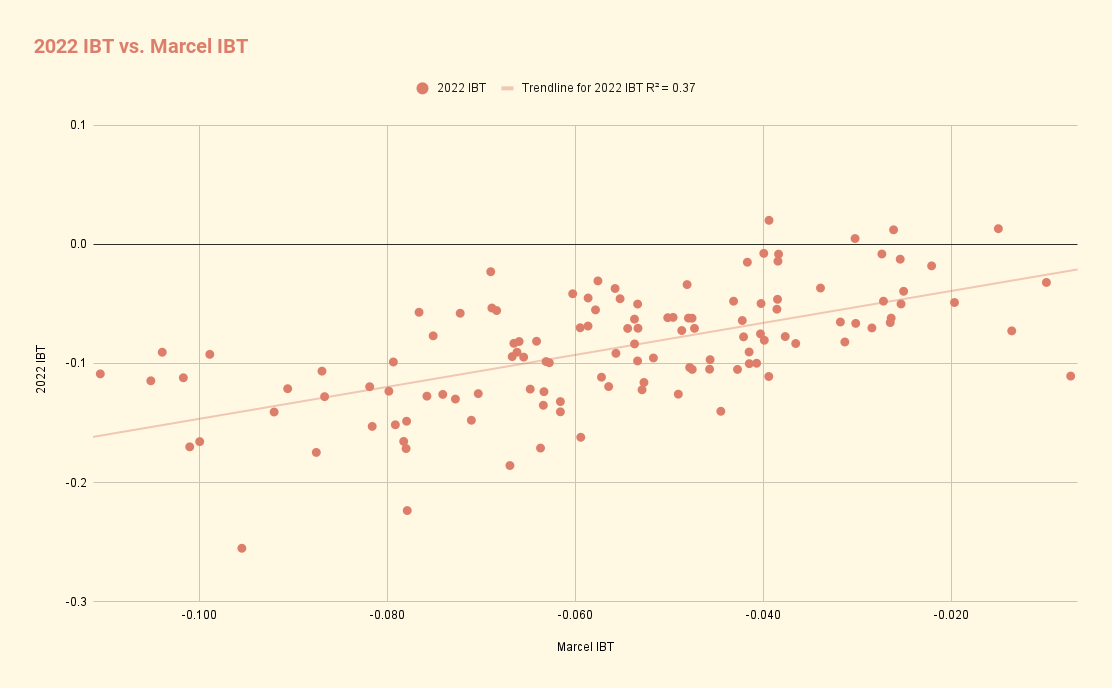
Below are two graphs correlating past IBT with future IBT. The first simply compares the IBTs of hitters with 100 or more balls-in-play in both 2021 and 2022. The second graph offers a paired-down version of an IBT Marcel projection based on data from 2019-2021. Originally defined by Tom Tango, Marcel is considered the most basic viable forecast system. My paired-down version excludes an aging curve.
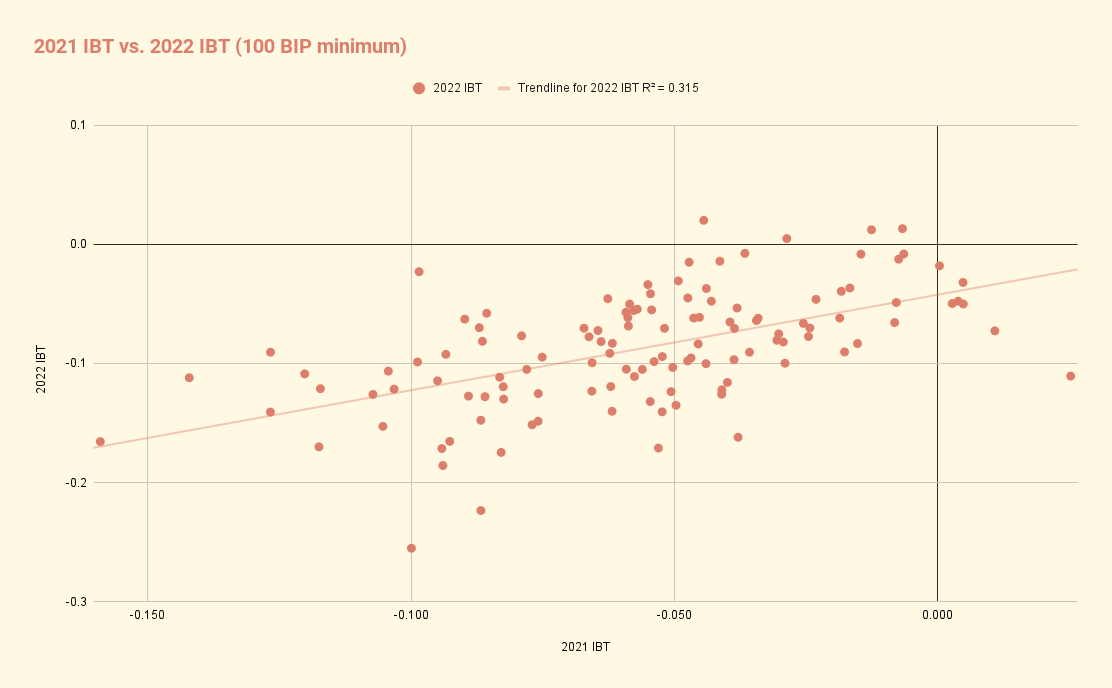
(source: baseballsavant.com)
As can be seen in the first graph, 2021 IBT has been about as predictive (R2 =.315) of 2022 IBT as a previous season’s wOBA is predictive of wOBA in the subsequent season, and more predictive of itself than xwOBA is predictive of a subsequent season’s wOBA.
In the second graph, I compare my simplified Marcel with 2022 IBT so far this season. As we can see, my projected IBT forecasts 2022 IBT about as well as most pre-season projection models forecasted rate stats like SB/PA, .AVG, R/PA, and RBI/PA.
Future Improvements
Now, these preliminary results are far from sufficient, but they do suggest that IBT might be worth further exploring. A more robust analysis would include things like stabilization point in order to assess when a sample might become meaningful. It would also have to look at things like aging curves and park factors, which might complicate and/or clarify the picture. After all, there are a handful of Rockies in the top 30 and a handful of Yankees in the bottom 30, which may reflect each organization’s home field.
At the very least, we have a good way of describing how players like Brendan Donovan can put up slugging metrics above their weight class. Whether Donovan sustains his success while slugging without power remains to be seen.
Photo by Keith Gillett/Icon Sportswire | Adapted by Doug Carlin (@Bdougals on Twitter)