


David vs. Goliath. Average Joe’s vs. Globo Gym. The proletariat vs. the bourgeoisie.
No matter the comparison, the storyline for the 2020 World Series was the same: a team from the depths of Florida with a tiny payroll, facing off against a team surrounded by the bright lights of Hollywood that paid nearly four times as much for its roster. The Tampa Bay Rays against the Los Angeles Dodgers.
In 2020, the Dodgers had an opening-day, COVID-19 adjusted payroll of $107.9 million which was second only to the New York Yankees. The Rays, on the other hand, only had $28.3 million on their books. There’s a single reason for this massive gap: MLB doesn’t have a hard salary cap or salary floor.
Take a look at some other major American sports leagues, the NHL, NFL, and NBA. Both the NHL and NFL have a hard cap and a hard floor. The NBA has a salary floor and a luxury tax but also has an additional set of cap restrictions that can only be surpassed for certain exceptions like re-signing a player that was originally drafted by the team.
Clearly out of the four leagues, MLB has the fewest payroll restrictions, and yet in 2020, the team with the 28th-ranked payroll made the World Series. Maybe this is a fluke that can be chalked off to a 60-game season unlike any other.
Or maybe there’s something about baseball that made this result possible. Let’s try to find out.
Past Champions
Craig Edwards from Fangraphs put out this excellent article in 2018 that looked at the correlation between wins, payroll, and franchise value. Looking at data from 2015-2018, Edwards concluded that payroll and wins don’t appear to be linked when looking at individual seasons, but when tracking teams over multiple seasons, there is at least some correlation between a team’s average payroll and the total number of wins.
Now there’s definitely a correlation between wins and championships. Teams can only win a championship if they make the playoffs and in order to make the playoffs, they’ll need to get a certain amount of wins. But, front offices clearly aren’t paying just for wins. They’re paying for championships and the team with the most wins each season doesn’t always win a championship. Every once in a while, you get a team like the 2006 St. Louis Cardinals that win the World Series despite finishing the regular season with 83 wins, just a couple of games over .500. Don’t get me wrong, wins are great, but teams are going after World Series rings, not regular-season titles.
So, how can we investigate if there’s a correlation between payroll and championships?
One easy way we can do this is just by looking at the different World Series champions over the years and looking at how their payroll ranked for that season. If you do this, the list for the past 25 World Series champions looks like this:
| Year | Team | Rank |
|---|---|---|
| 2019 | Nationals | 3 |
| 2018 | Red Sox | 1 |
| 2017 | Astros | 12 |
| 2016 | Cubs | 4 |
| 2015 | Royals | 12 |
| 2014 | Giants | 10 |
| 2013 | Red Sox | 3 |
| 2012 | Giants | 8 |
| 2011 | Cardinals | 11 |
| 2010 | Giants | 10 |
| 2009 | Yankees | 1 |
| 2008 | Phillies | 14 |
| 2007 | Red Sox | 2 |
| 2006 | Cardinals | 11 |
| 2005 | White Sox | 13 |
| 2004 | Red Sox | 2 |
| 2003 | Marlins | 25 |
| 2002 | Angels | 15 |
| 2001 | D-backs | 8 |
| 2000 | Yankees | 1 |
| 1999 | Yankees | 1 |
| 1998 | Yankees | 2 |
| 1997 | Marlins | 7 |
| 1996 | Yankees | 1 |
| 1995 | Braves | 3 |
| AVERAGE RANK: | 7.2 |
If you plot this on a graph you get this:
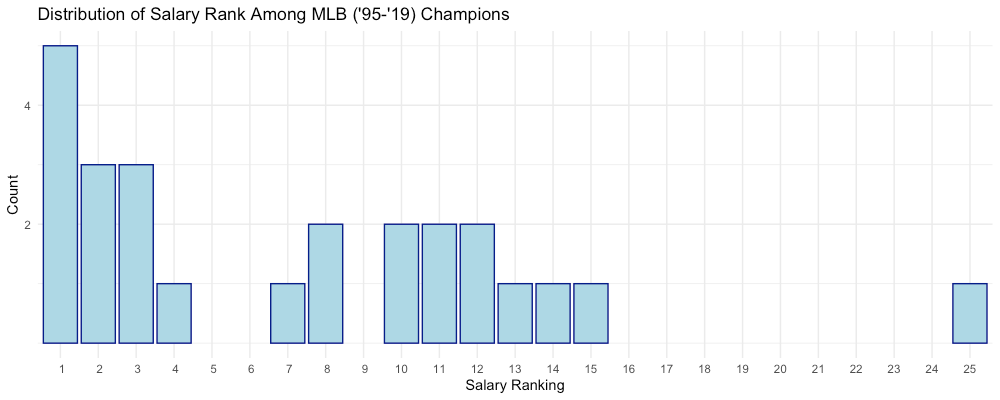
Visually, this shows that from 1995-2019, the top payroll won the World Series more than any other payroll-rank; in fact, 44% of champions in the last 25 years finished in the top three in payroll. Some middle-of-the-pack teams won as well, but no one with a payroll in the bottom half of the league won a championship other than the 2003 Florida Marlins. All of this seems to support the theory that having a higher payroll improves your World Series chances by at least a little.
This is pretty vague. What does it mean to improve your chances “at least a little?” Let’s try to quantify that.
“At Least A Little”
One way we can quantify this is by using z-scores instead of just pure payroll rankings. Calculating the z-scores of different payrolls allows us to standardize all the payrolls for a given season so that we can compare just how much larger or smaller a team’s payroll was than the other teams during that season. We do this by setting the average of all MLB payrolls in a given season to a “z-salary” of 0. Then, we do some math and give all the teams a z-salary relative to this 0 term.
Any team that paid more than the average will have a positive z-salary and any team that paid less than the average will have a negative z-salary. More specifically, z-scores/z-salaries are directly linked to standard deviations: a z-score/z-salary will indicate just how many standard deviations a data point is from the mean. The farther the z-salary is from 0, the bigger the difference between a team’s payroll and that season’s average payroll.
Quick Note #1: From here on out we’ll be using the payrolls from the 30 season span between 1985-2016, not including 1994 because that data was inaccessible.
Using this methodology, we can create different sets of z-salaries for every given season between 1985-2016. To be clear, each of these sets are distinct; 1985 would have its own data set of z-salaries relative to the salaries for that given year, and so would 1986 and so on and so forth. Creating these separate sets helps us, at least partially, adjust for inflation and other economic conditions. For example, the highest payroll in 1986 was $18.5 million while the lowest payroll in 2016 was $63.0 million. If we were to consider all of 1985-2016 as a single data set instead of treating each season separately, the highest 1986 would probably have a negative z-salary when in reality, it should have a positive z-salary due to its high monetary value for its time.
Once we have all these data sets, since there’s only one champion every season, we can take the z-salaries of just these champions and plot the distribution of these champions’ z-salaries on a normal distribution graph that looks like this:

Now, if you’re having a hard time understanding the details of this graph, that’s ok, there’s just one thing I want to point out. That skinny tail on the right side of the graph means the graph is right-skewed. This just means there are more data points on the extreme right end than on the extreme left end. Within the context we’re working with, this is fairly intuitive: teams that pay huge amounts of money for their players should be more likely to win a championship than teams that pay little-to-nothing. Basically, having an extremely high salary helps more than having an extremely low salary.
To quantify this distribution even further, we can find the average of all these z-salaries. In doing so, we’ll get roughly just how high or low a championship team’s payroll had to be compared to the rest of the league’s payrolls for a given season. This average z-salary is 0.887.
What does this mean? Well, first off, it’s a positive number meaning the average champion has a higher than average payroll per given season. But, on a more specific note, do you remember how z-score is directly connected to standard deviation? This means the average World Series champion from 1985-2016 had a payroll that is 0.887 standard deviations above the average payroll for its given season.
Comparing to the NBA
This is cool because now we have one quantifiable measure of how high a payroll needs to be on average in order to win a championship. But, what’s even cooler is when we compare this data to a league with more payroll restrictions like the NBA.
Quick Note #2: For the NBA data, we’ll look at another span of 30 seasons from 1991-2020. We didn’t use 1985-2016 because the data for 1985-1991 was inaccessible.
If we follow the same process we did above and apply it to NBA teams from 1991-2020, we get a graph of NBA champion z-salaries that looks like this:
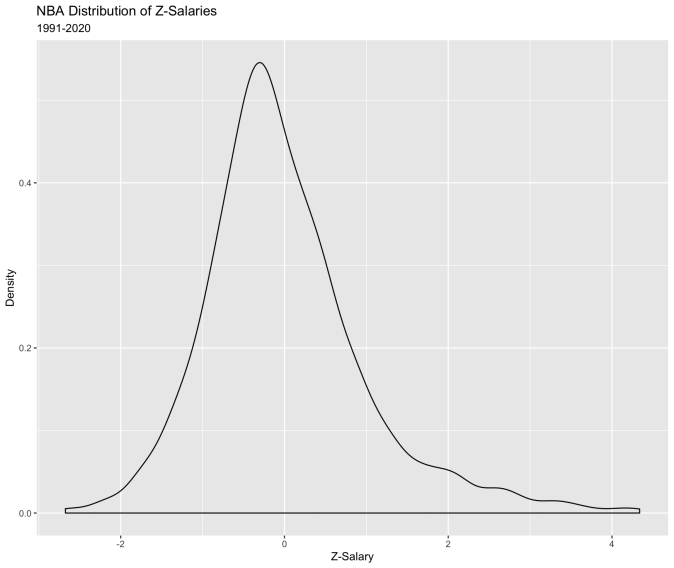
Again, there’s a right skew and again the average NBA Finals champion’s z-salary is a positive number: 0.675. Just MLB, having a higher payroll relative to your competitors for any given year increases your likelihood of winning an NBA championship.
However, the average NBA champion’s z-salary was lower than MLB’s. This means that compared to the NBA, there was a bigger difference between the average MLB champion’s payroll and the average payroll for that season.
There are two possible reasons for this: the frequency theory or the extremity theory
Quick Note #3: These aren’t the names of actual scientific theories. I’ve just made them up so that we have a way to reference the theories.
Either more MLB champions have above-average payrolls compared to NBA champions (the frequency theory) or some MLB champions’ payrolls are just really high (the extremity theory). Let’s try to see which theory is more likely.
Checking the frequency theory is pretty simple. If we look at how many data points had positive z-salaries in both leagues, we find that 20 out of 30 NBA champions had positive z-salaries while 25 out of 30 MLB champions had positive z-salaries. So the frequency theory holds: MLB champions are more likely to have above-average payrolls than their NBA counterparts.
Regarding the extremity theory, one way we can check for this is by finding the average of just the champions with positive z-scores. What this does is isolates the teams that are already spending more than average and examine just how “extreme” their spending is. If we do this, the average in MLB is a z-salary of 1.55 compared to the NBA’s average z-salary of 1.24. So the extremity theory holds as well: MLB champions pay more extreme amounts when compared to their competitors than NBA champions.
All’s Fair in MLB?
Now if you’re a fan of a small-market team, you’re probably getting a little annoyed at this point. When you look at these numbers, MLB doesn’t look too fair (pun intended). If MLB champions are more likely to have above-average payrolls than NBA champions and MLB champions also have more extreme payrolls than NBA champions, how can we consider MLB fair?
Well, you asked for it. Here are two reasons why MLB might still be considered fair.
1. Teams can win with less in MLB.
Here is the list of teams from our data set that won a World Series with a negative z-salary:
| Team | Z-Salary |
|---|---|
| 1985 Royals | -0.50 |
| 1990 Reds | -0.79 |
| 2002 Angels | -0.22 |
| 2003 Marlins | -0.91 |
| 2015 Royals | -0.10 |
| AVERAGE | -0.50 |
Here are the NBA champions that won with a negative z-salary:
| Team | Z-Salary |
|---|---|
| 1991 Bulls | -0.55 |
| 1994 Rockets | -0.47 |
| 1995 Rockets | -1.05 |
| 1996 Bulls | -0.27 |
| 2003 Spurs | -0.32 |
| 2004 Pistons | -0.33 |
| 2005 Spurs | -0.75 |
| 2006 Heat | -0.14 |
| 2014 Spurs | -0.42 |
| 2020 Lakers | -0.18 |
| AVERAGE | -0.45 |
There are a couple of cool trends here, particularly with the NBA list. The Houston Rockets’ championships in 1994 and 1995 show up on the list. They had this guy named Hakeem Olajuwon on a relatively cheap contract at the time.
It’s also interesting that in the first 16 years of the NBA data set, eight teams with a negative z-salary won a championship. But, in the final 14 years, only two such teams accomplished that feat, so perhaps there are some changes recently that have reduced parity in the NBA as well.
But the thing I want to draw attention to is that among the teams with negative z-salaries that won a championship, the average z-salary for these teams in MLB was -0.50 compared to the NBA’s -0.45. To put these numbers into perspective, in 2020, a difference of .05 in standard deviation would be equivalent to a $2,129,381.70 difference in payroll. This may not seem like much but considering players like Randy Arozarena made around $90,335 according to Spotrac, $2,129,381.70 can make a huge difference when invested correctly (that’s over 23 Arozarena’s on your team!).
So, although more teams with negative z-salaries win championships in the NBA, teams in MLB can, on average, have a slightly more extreme negative z-salary and still win. In fact, the 1995 Rockets mentioned above are the only team on the NBA list with a more negative z-salary than the 1990 Reds and the 2003 Marlins. So, even though many MLB teams spend an extraordinary amount and win titles, some MLB teams can also spend an extraordinarily small amount and still win a championship.
Quick Note #4: Yes, I will admit that only using five data points to calculate an average isn’t the strongest reason for parity in MLB, but hey we’ve got to find a reason to hope right?
2. MLB has redefined what’s “fair.”
Up until this point, we’ve been looking at individual seasons in our analysis of parity, but now let’s take a step back and see how things played out in the long run. There were 11 different NBA franchises that won a title in our 30-season data set, but there were 18 different MLB franchises that won a World Series. The average z-salary of the NBA championship franchises over the entire timeframe was 0.154 while the average z-salary of MLB championship franchises was 0.213 (again the difference is small, but would equal a 2020 MLB payroll difference of $2,512,670.41).
This is the two-sided coin that is MLB: the expensive teams do better in the long run, but the underdog can still have its shot.
The New York Yankees won the most championships in the timeframe we looked at, finishing with five rings and an average z-salary of 2.12. But then you got teams like the 2003 Florida Marlins that against all odds won a championship with a z-salary of -0.91, or the 2002 Anaheim Angels that won their first and still only World Series in the history of their franchise with a z-salary of -0.22. So yes, the franchises that pay lots of money year after year will eventually find success, but MLB is still fair because ultimately, MLB is fair in a different sense of the word “fair.”
You see, one definition Merriam-Webster gives for “fair” is “free of obstacles,” and I don’t think I’ve heard a better definition for MLB’s payroll policy.
MLB gives teams the opportunity to compete according to their own terms. With no salary cap and no salary floor, teams can spend as little or as much as they want. Teams have the freedom to do as they choose and for small market teams, this may mean saving money until the time comes to make one huge push towards a World Series. In leagues with a salary floor, these teams wouldn’t be able to save up as much money in prior seasons to make this push. This might be why compared to the NBA, there are more MLB teams that won a title, but the average z-salary of its champions is still higher.
Removing salary restrictions allows teams to spend when they want, and that’s the promise of MLB: that for better or worse, MLB promotes freedom, and that’s why it’s fair.
Analytics and graphics contributed by Paul Brendel.
Featured Image by Doug Carlin (@Bdougals on Twitter)
