f(Photo by Brian Rothmuller/Icon Sportswire)
We’ve reached the three month period of the 2018 season and we’ve got several prominent names present on our current disparity leaders. All hitters must have had at least 20 plate appearances and produce a .250 xAVG and a .425 xSLG at a minimum.
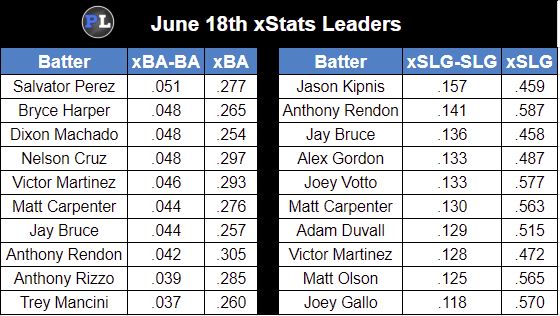
Lately, a lot has been said about Bryce Harper and his struggles in 2018. For a career .279 hitter, his .217 batting average is pretty alarming, especially with an xBA of just .265. Regardless, he’s still getting on base a lot (thanks to his 17.1% BB-rate) and still has plenty of pop in his bat; he’s hit 19 home runs and is on pace to match or beat the 42 he hit back in 2015. This month, however, Harper has just one home run and totaled only seven hits in the month of June.
WHO’S HOT?
Mike Trout (OF, LA Angels) – Trout led all hitters who had at least 20 plate appearances last week with a .684 batting average; .255 points higher than expected. He’s gotten on base three out of every four at-bats with a monstrous 438 wRC+ and over half of Trout’s BIP contact produced an exit velocity of at least 100 MPH. Have a look at Trout’s radial chart and note he’s had twice as many ‘good contact’ balls in play versus bad.
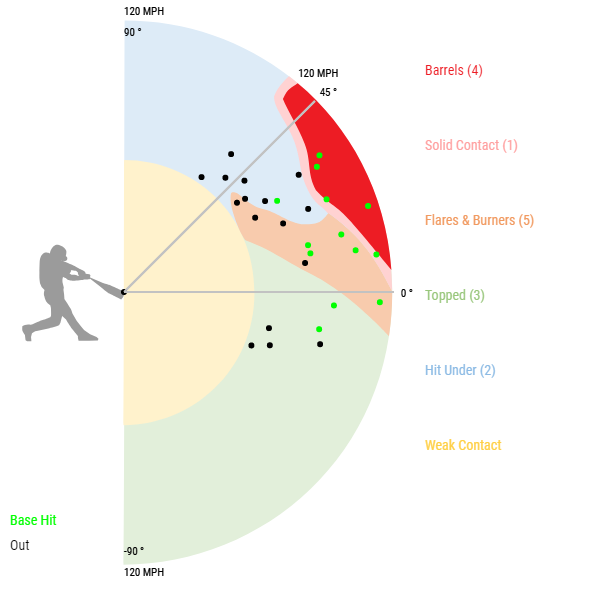
Trout had an incredible week that could make the ‘Mookie Betts for MVP’ club second guess their convictions.
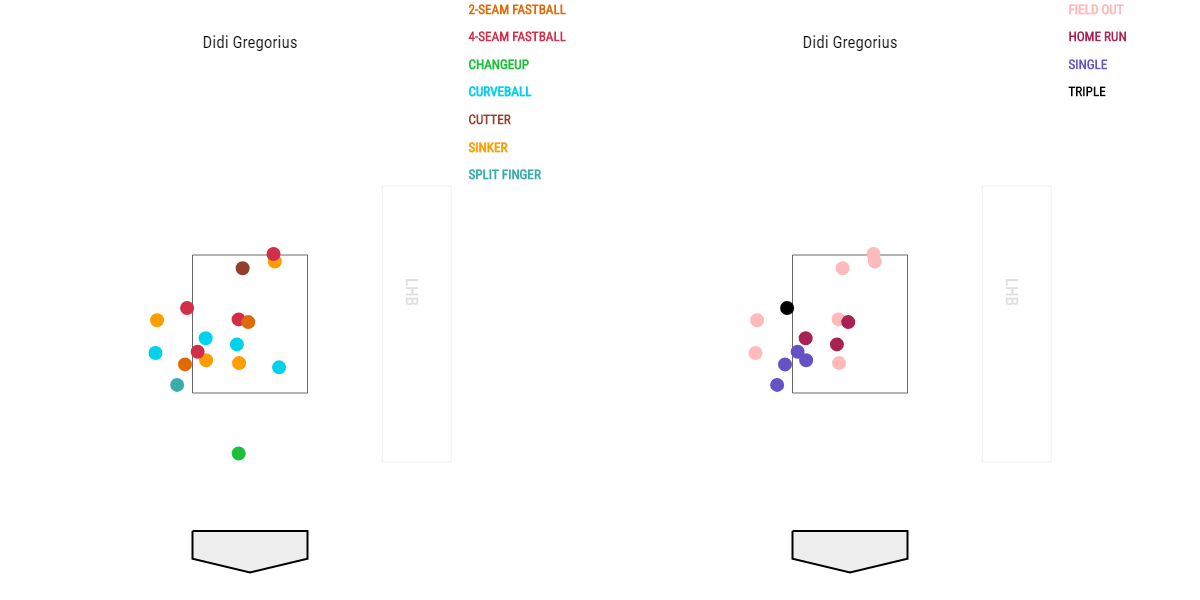
Didi Gregorius (SS, New York Yankees) – The hype dust has settled and Gregorius has seemingly fallen off a cliff after prompting fans to consider him one of the best shortstops in baseball. While he is a good player, his recent struggles have made that aforementioned assertion less of a perceived certainty. During the second week of June, Sir Didi clipped his way to a .471 batting average while having an xBA of .325. Through his last seven games, Gregorius’s .665 wOBA finished a distant second to Trout, who produced an .802. Gregorius didn’t deviate from his 2018 average exit velocity last week but looking at this pitch chart, he saw the ball very well.
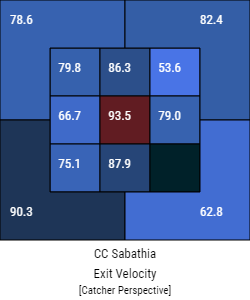
CC Sabathia (SP, New York Yankees) – Sabathia had the lowest EV against out of all pitchers with greater than 20 batters faced. His 80.5 MPH EV is a good 5 MPH lower than his Statcast-era average and 3.7 MPH lower than his 2018 average. Through two starts last week, Sabathia produced a 2.49 FIP with a .359 BABIP, allowed no home runs, and had a 4:1 K/BB rate. As you can see from his EV Zone chart, Sabathia kept his strike zone EV pretty tame with the exception of centered contact.
WHO’S COLD?
Kevin Pillar (OF, Toronto Blue Jays) – Not an especially strong offensive contributor, Pillar has been pitiful the last week or so; fourth-lowest average EV (81.1) and seventh worst wRC+ (-33). In 24 PA, he hit .125 with no walks and one extra-base hit. You can see from his color-coded EV spray chart that Pillar is not hitting the ball very well.
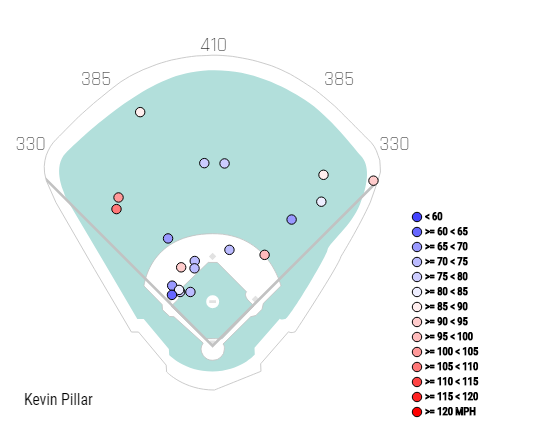
The nail in the coffin of Pillar’s dismal week is his .018 wOBA difference between his xwOBA (.143) and his actual wOBA of .125. That 6 MPH drop in average EV needs to come up, obviously, or Pillar will be wallowing in the cellar of the worst MLB hitters in 2018.
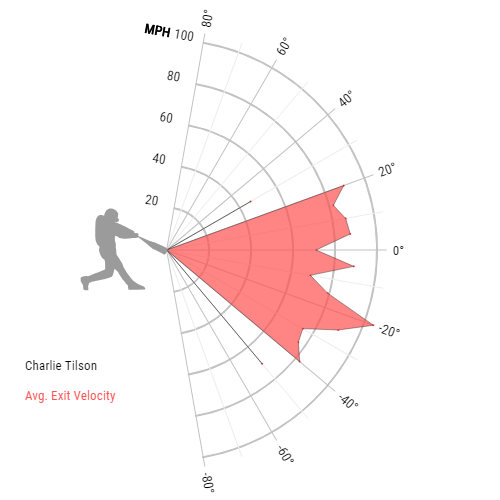
Charlie Tilson (OF, Chicago White Sox) – Tilson has been a ground ball machine this past week, having by far the lowest launch angle of any hitter (-6.7o). What compounds the issue is Tilson’s feeble 77.7 MPH exit velocity; Tilson has a 13.3% hard-hit rate in 2018, so his bad week should come as no surprise. What’s interesting is he posted a .348 batting average, which is .104 points better than his expected average. While he isn’t quite a Statcast darling this week, he’s still managed to sneak some hits by the infield, posting a .400 BABIP. For those unfamiliar with Tilson, he’s a good contact hitter with little power and terrific speed; sounds a lot like a younger Dee Gordon. Regardless, Tilson makes the ‘cold’ list due to his weak Statcast metrics that yet are not supported by the end results. That means that if Tilson can level his hits out more, he’ll be much more successful than he’s showing (see how strong his EV is below 0o launch angle).
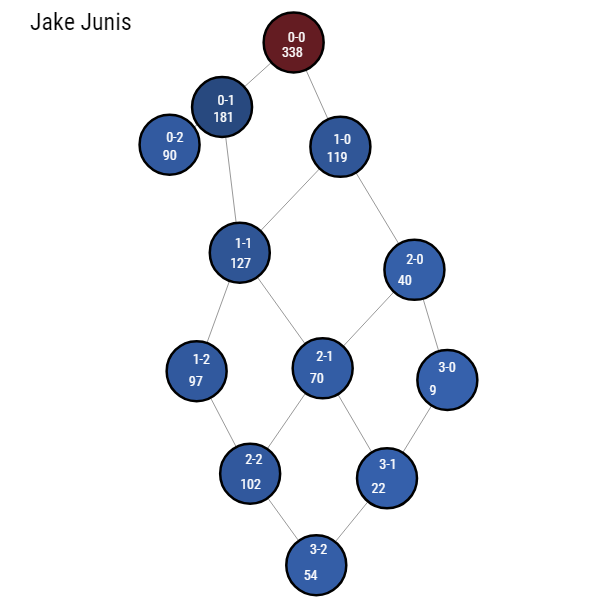
Jake Junis (SP, Kansas City Royals) – Junis pitched once last week, couldn’t get out of the 6th, and gave up three home runs with a FIP of 9.84 (second worst of the week). Junis was tied in first with Jose Quintana for highest average exit velocity (93.1). The Houston Astros absolutely rocked Junis this past Friday and it was amazing he lasted as long as he did that game. The main issue was Junis threw just two pitches out of the strike zone (with two others on the border) against probably the strongest offense in all of baseball. Below is the locational pitch chart for Junis.
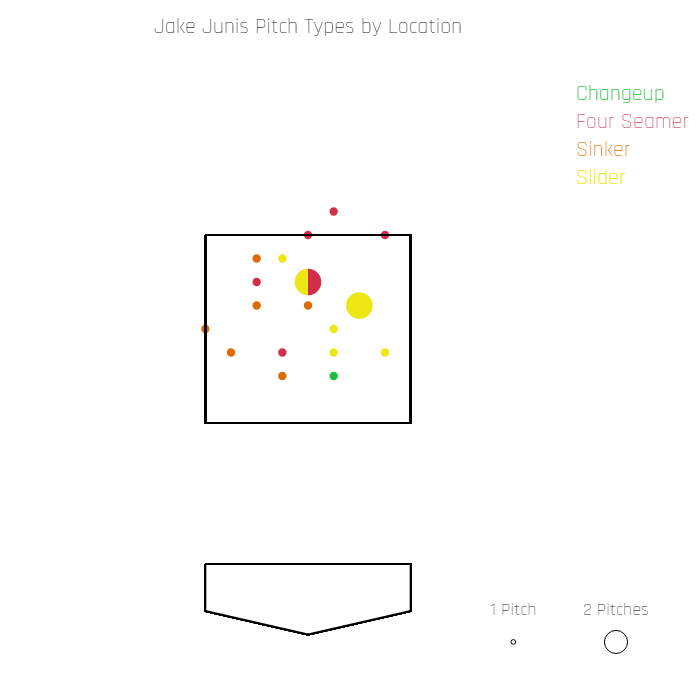
I could have passed over Junis as he did this to himself but he also has an exorbitant amount of pitches thrown in the heart of the zone during his 14 starts. Junis rarely gets himself into hitters counts but that’s likely due to the fact that he throws a lot of strikes (53.4%) that ultimately end up in play.
