


At last week’s First Pitch Florida event, a panel of Steve Gardner, Jason Collette and Glenn Colton discussed the 2020 season outlook for all 30 organizations. When it came time to discuss an organizations bullpen, and specifically who would be closing out games, there was a fairly consistent through line for more than a few teams: we don’t know yet. That’s by no means a criticism of three of the best minds in the industry, it’s more a testament to the fact that who will be getting saves in any given organization is getting murkier each season. It seems every year, we puzzle over who is going to get the bulk of opportunities on what club, who is likely to regress and who is likely to be 2019’s Liam Hendricks. I can’t tell you what esoteric reliever will emerge to save 30+ but I can tell you what the league as a whole is trending towards, how we’ve gotten saves wrong in the past and what organizations have historically done which may give you a good idea as to who those sleepers may be. Before we can get to that, however, let’s take a look at where we are with the save.
The State of the Save
At the end of the 2018 season, I noticed something weird was going on with reliever utilization. It seemed as if saves were being more evenly distributed at both the organizational and league level. I took a quick glance at the data, and that turned out to be correct.
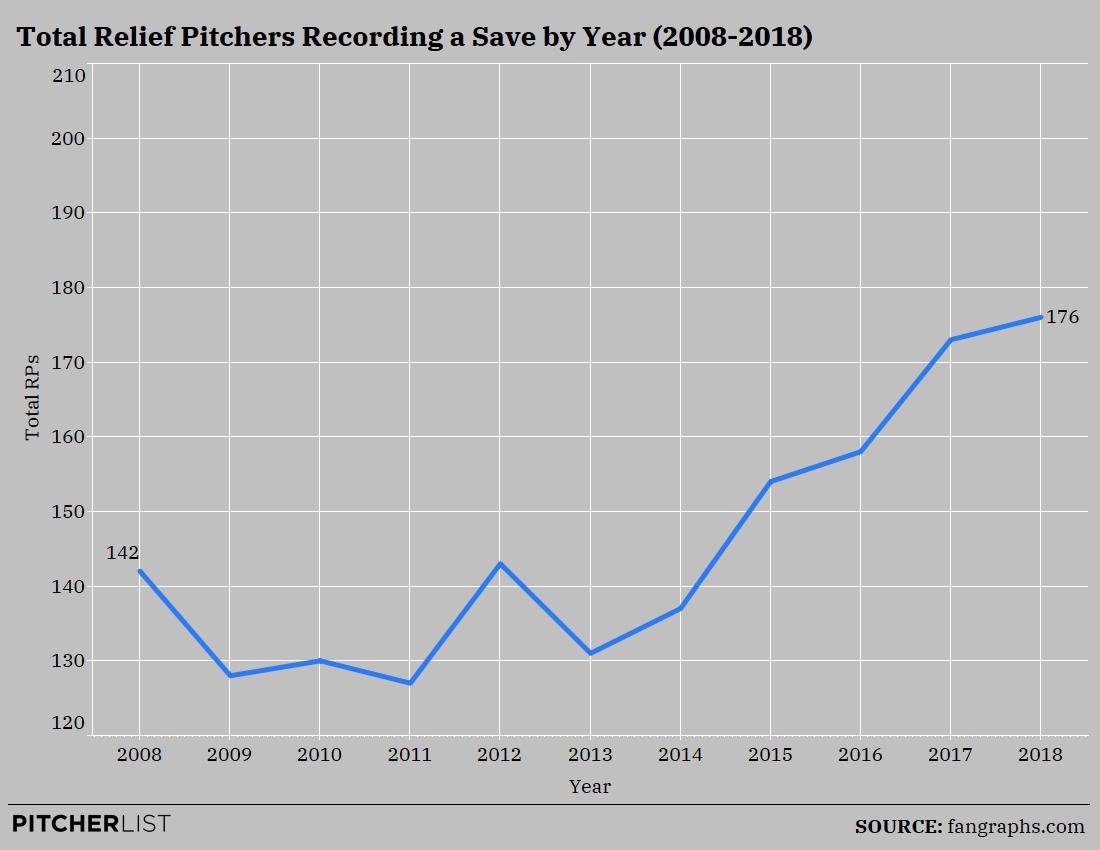
In 2018, more relief pitchers recorded at least one save than ever before in league history. As you can see that number has seen a steady increase ever since 2013. This led me to write a piece about how I believed we were drafting saves wrong. I concluded that it would be wise to not spend a top pick on a reliever, that it would likely be better to either wait until the end of the draft or take one “sure thing” before waiting until the final rounds to draft a closer (more on how that panned out later).
After the piece was published, I felt that we’d likely reached the zenith of reliever utilization. I felt that the number of relievers being used to record a save wouldn’t continue its drastic climb, and would probably begin to taper off.
I was wrong.
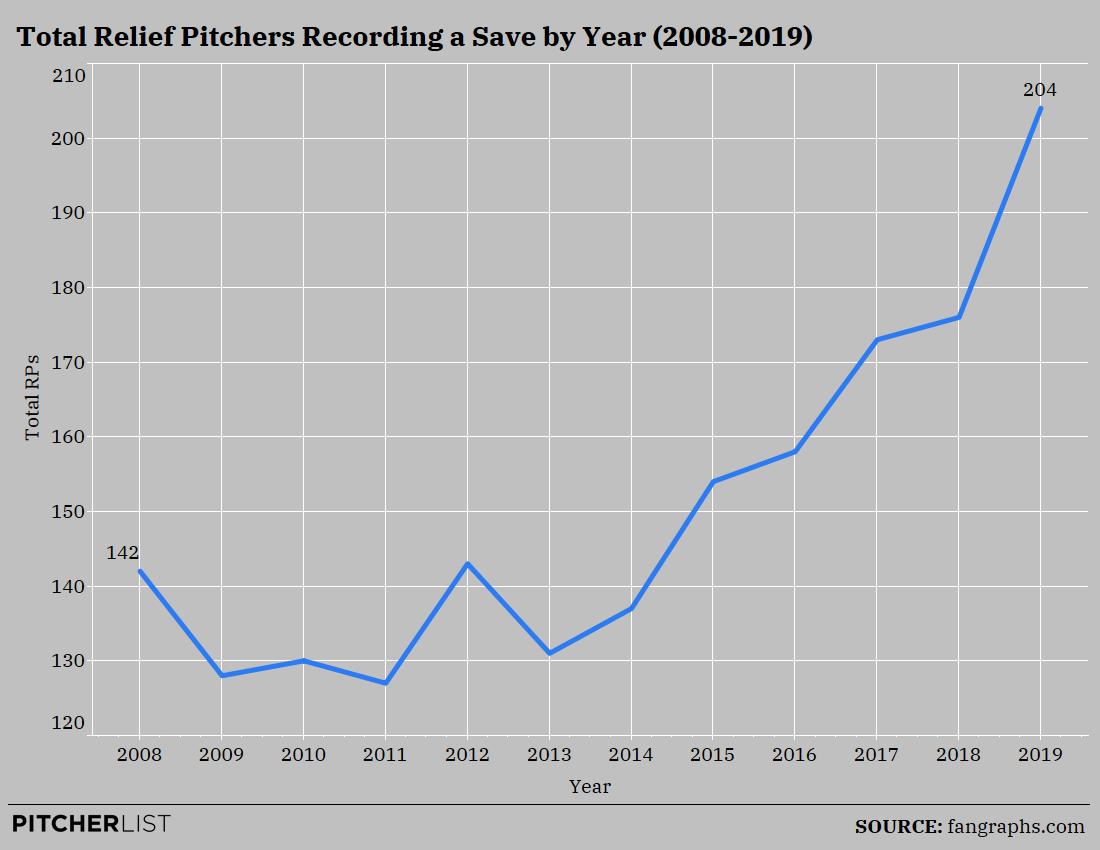
In 2019, 204 different relievers recorded at least one save.
TWO HUNDRED AND FOUR.
That is far and away a league-high.
Before I move on, let me clarify something really important here: the 204 RP’s double-count a few relievers and for good reason. In 2019, 194 unique relievers got at least one save (still a league-high), while 204 different relievers got at least one save on a per-team basis. For example, in 2019, Mark Melancon recorded 1 save for the Giants and 11 saves for the Braves. I feel it’s important to count Melancon twice because it best highlights the main point of evolving reliever utilization. If he was counted once, it would ignore the fact that when he was moved to Atlanta, he took saves away from another reliever. For what it’s worth, it should be noted that would I remove the double-counted relievers it wouldn’t matter all too much.
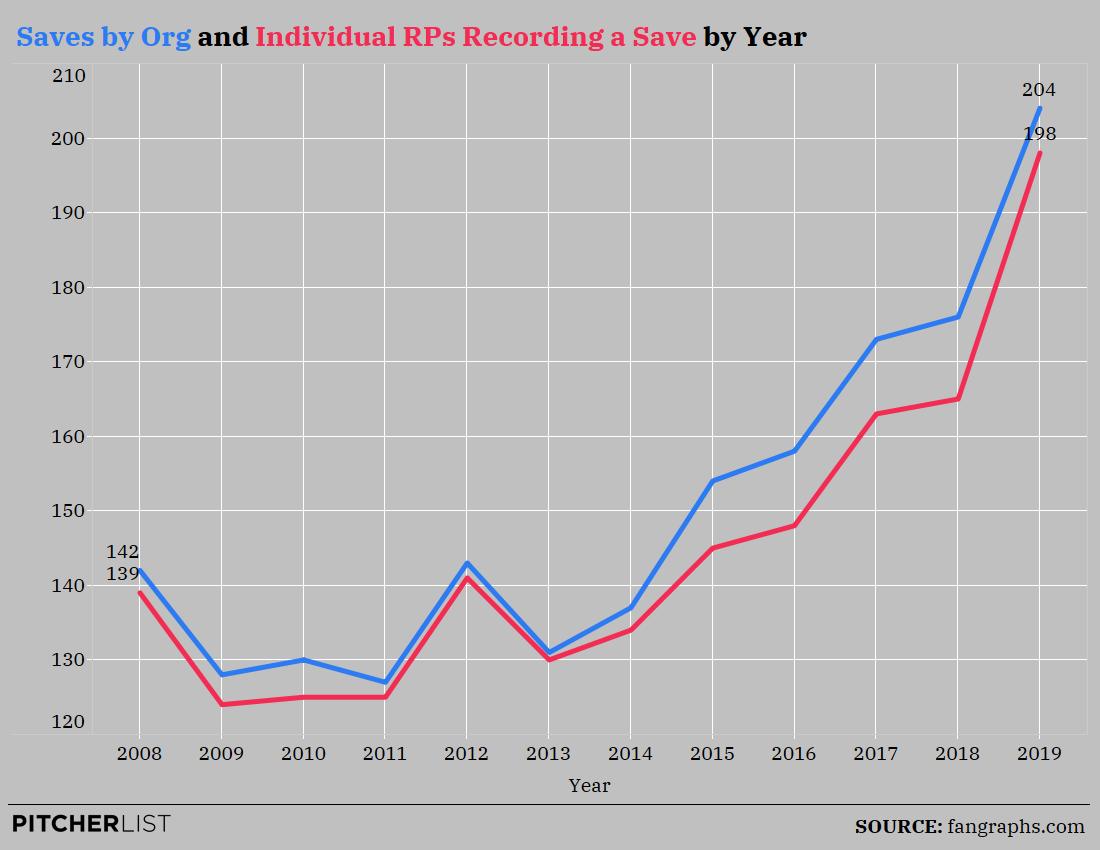
The difference is a negligible one and the point still remains: saves are being more distributed amongst relievers. Sadly, it gets worse.
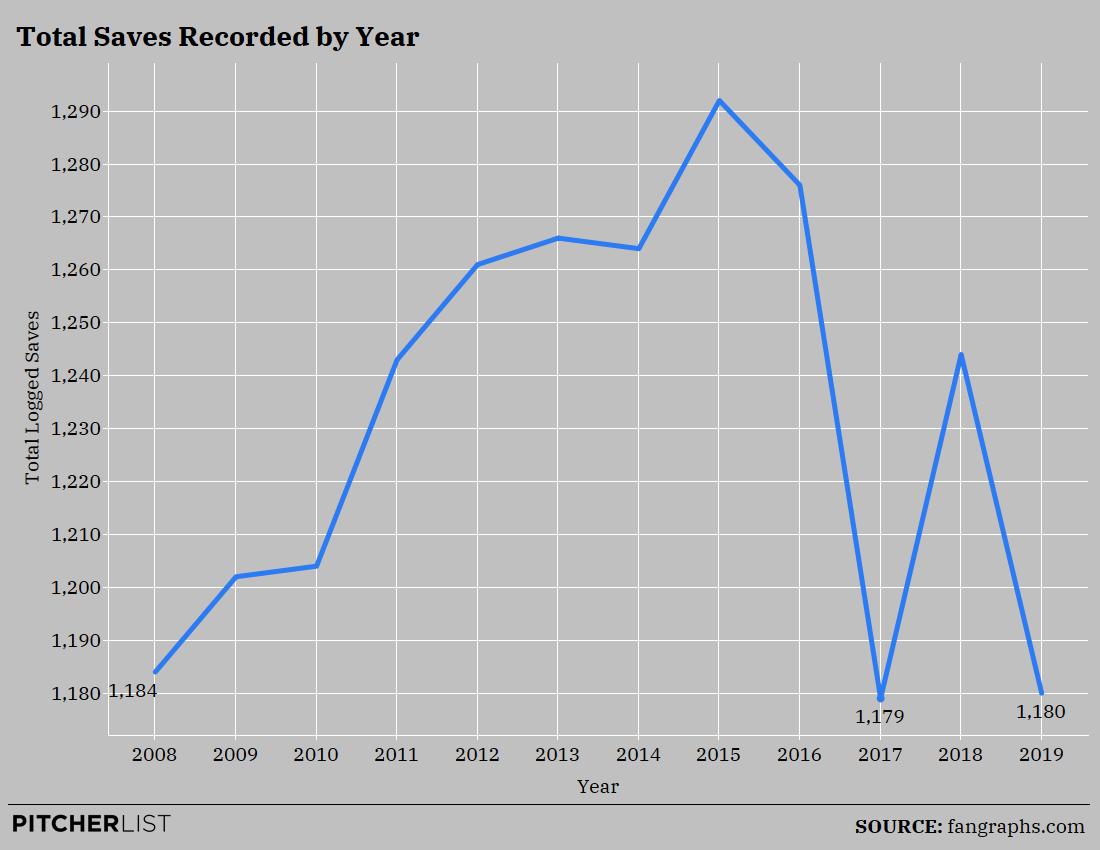
In 2019, not only did we see a career-high in RP’s that recorded a save, we saw virtually a 10 year low in terms of total saves.
A frequent comment I received when talking about this last year was, “Well there were likely more relievers getting 3 IP saves” and that’s true. In 2019, there were 32 3 IP saves, the highest total since the 2001 season. While that slightly lessens the severity of the 204 RP figure, it also means that, if we remove 3 IP saves, there were just 1,148 recorded saves last year. That’s the lowest recorded save number since the 2000 season and only further proves that regardless of 3 IP saves, total saves are reducing and the number of relievers recording them is increasing.
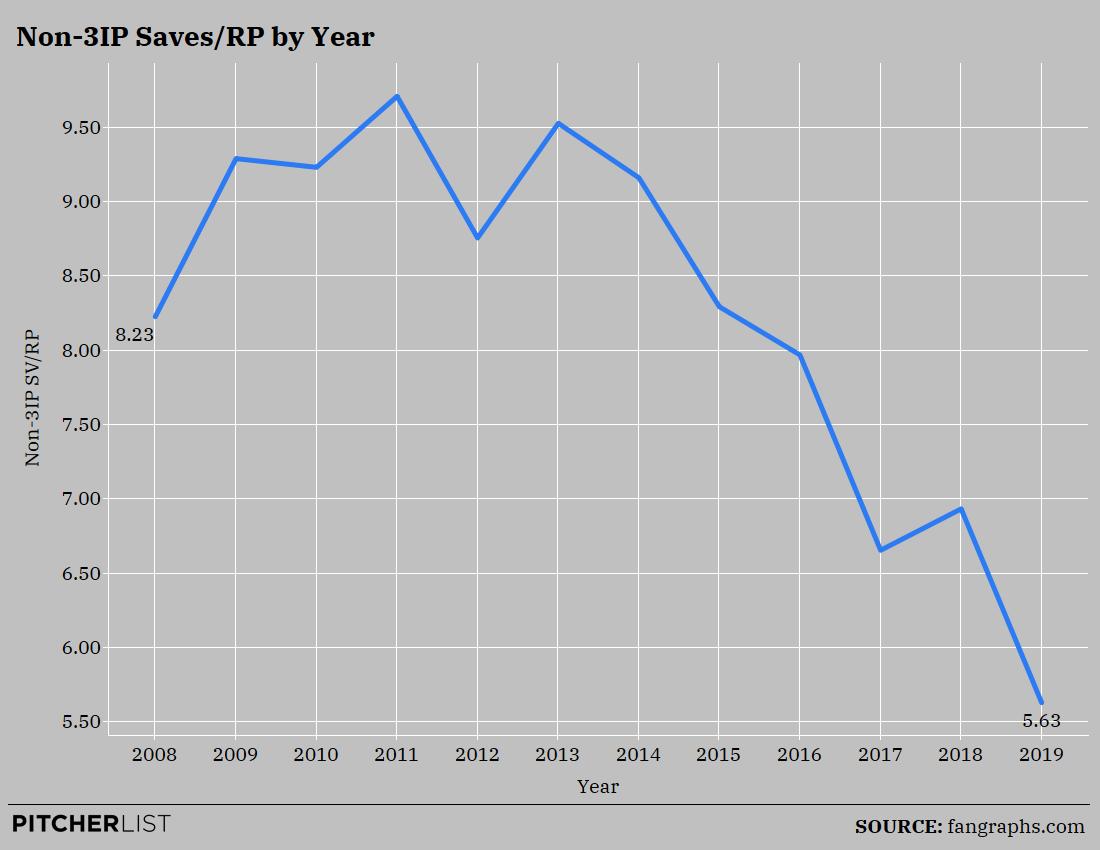
The above graphic is the number of saves by reliever per year when 3 IP saves are removed from the equation. That’s…not very good for us fantasy baseball players.
All of this information begs the question: If reliever utilization is continuing to evolve, why are we drafting them the same way year in and year out?
A Look at the ADP
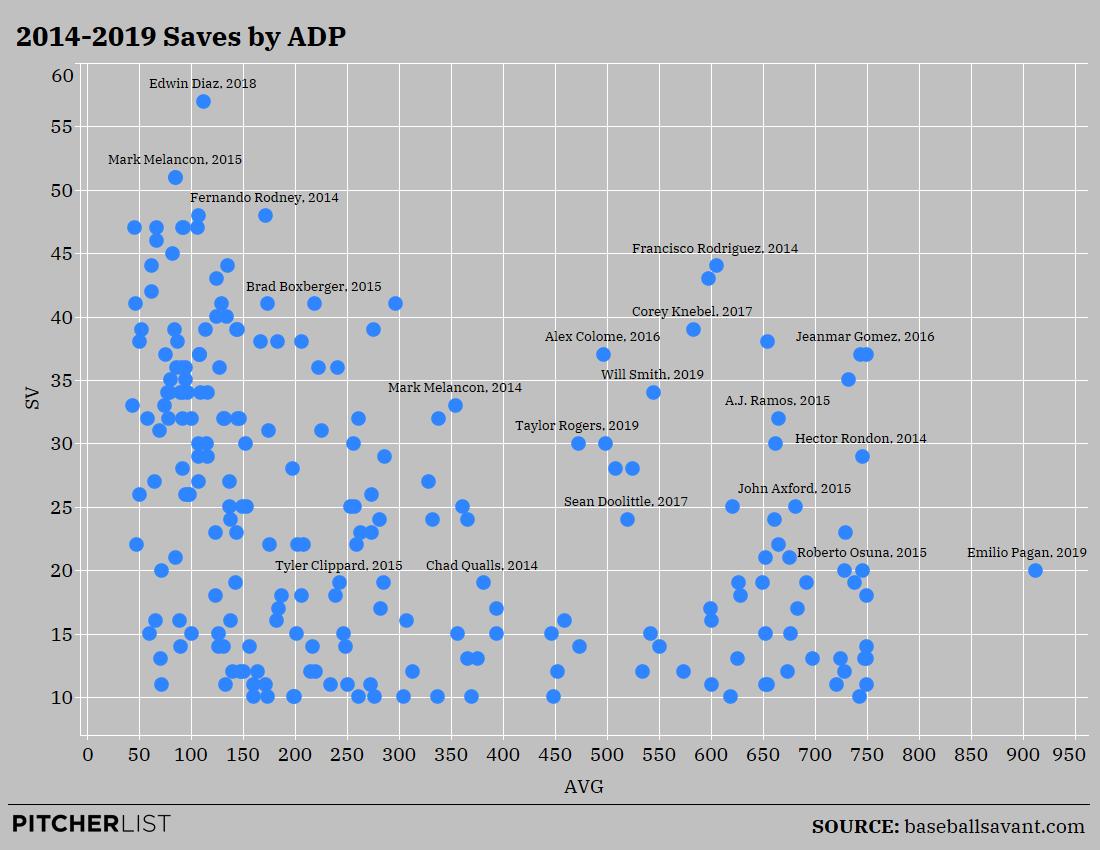
Last year, the first three relievers to go off the board by ADP* were Edwin Diaz, Blake Treinen, and Craig Kimbrel. They finished 15th, 27th and 32nd respectively in terms of total saves and were all top 100 picks.
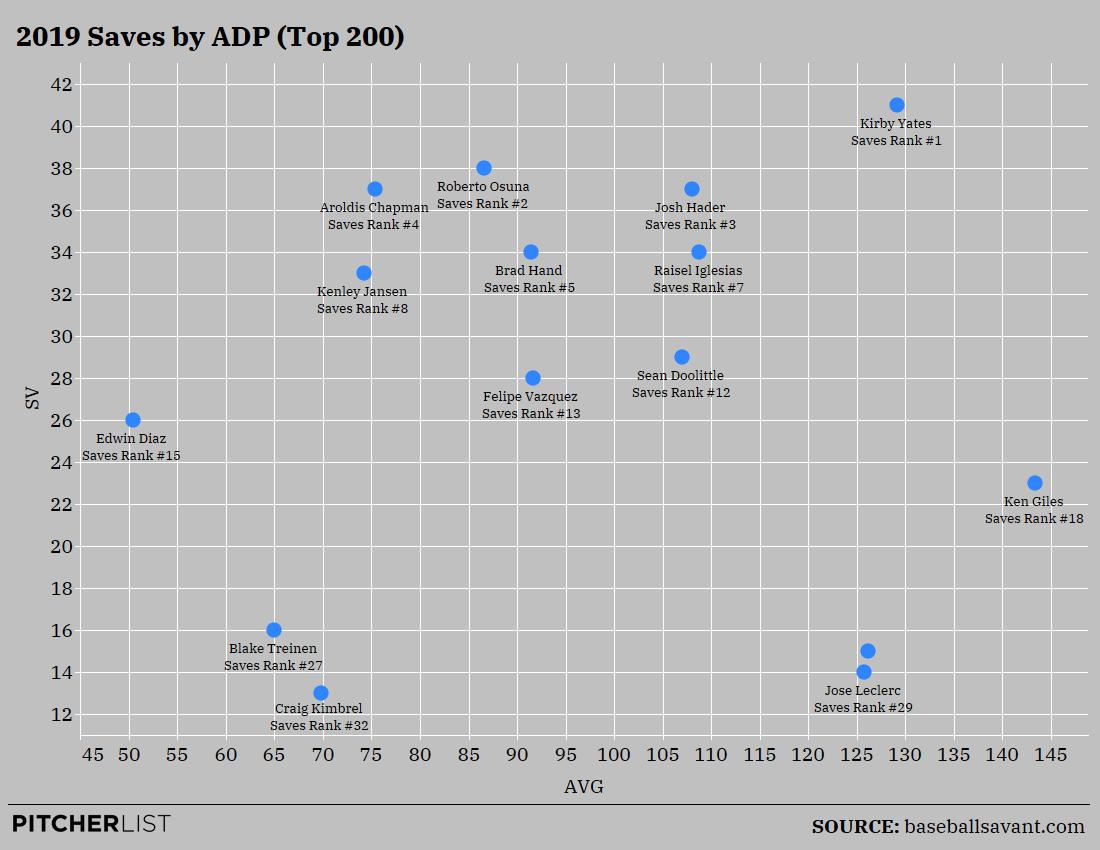
*This is an average of ADP data from ESPN, CBS, RTS, FT, and NFBC Data and only features RPs with 10+ SVs
Here are just a few hitters you could’ve taken in the top 100 instead of Diaz, Treinen, and Kimbrel: Nelson Cruz, Josh Donaldson, Edwin Encarnacion, Matt Chapman, Jonathan Villar, and Tommy Pham. Last year’s leader in saves went around pick 128 while arguably the most valuable RP in Josh Hader went at pick 108. As you can see there was a lot more safety in that area where other relievers like Brad Hand, Sean Doolittle, and Raisel Iglesias went before there was another steep fall off with Leclerc and Wade Davis. This doesn’t tell the entire story though so to get a better sense of how unnecessary it was to use an early draft pick for saves, let’s expand the ADP to the top 400.
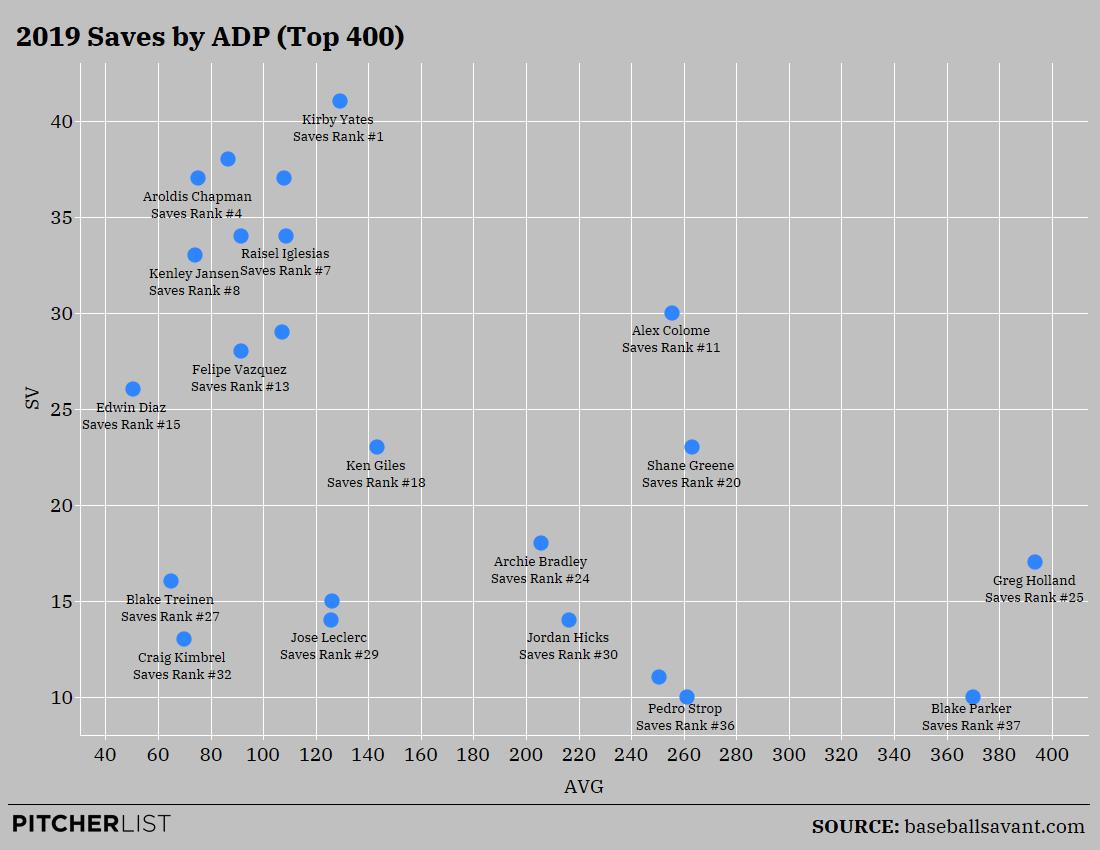
While there aren’t a lot of exceptions here, there are two important ones: Alex Colome who would’ve given you 30 saves and Shane Greene who would’ve given you 23. You might think to yourself, “Well yeah, but if I reached and took Edwin Diaz it was because he was supposed to give you a better WHIP or ERA.” True. He was supposed to do that. However, Alex Colome’s ERA was top 30 amongst qualified RP’s and nearly top 10 amongst those with 25 or more saves and his 1.07 WHIP certainly didn’t hurt. Also, Shane Greene’s ERA was even better and so was his WHIP. In hindsight, would you rather have had Kenley Jansen’s 33 SV’s, 3.71 ERA and 1.06 WHIP and paired that with Jackie Bradley – where Alex Colome was going in drafts – or have grabbed Alex Colome 150 picks later and spent that top 100 pick on Tommy Pham?
Let’s say you preferred taking Pham at pick 100 and Bradley at pick 250 because you wanted to be risky and wait on saves. Would that have paid off for you if you waited until the very last pick to grab an RP to get the bulk of your saves? Or even crazier, would it have paid off to not take a 2nd RP at all and instead gone another hitter or pitcher?
Yes.
Yes, it would have.
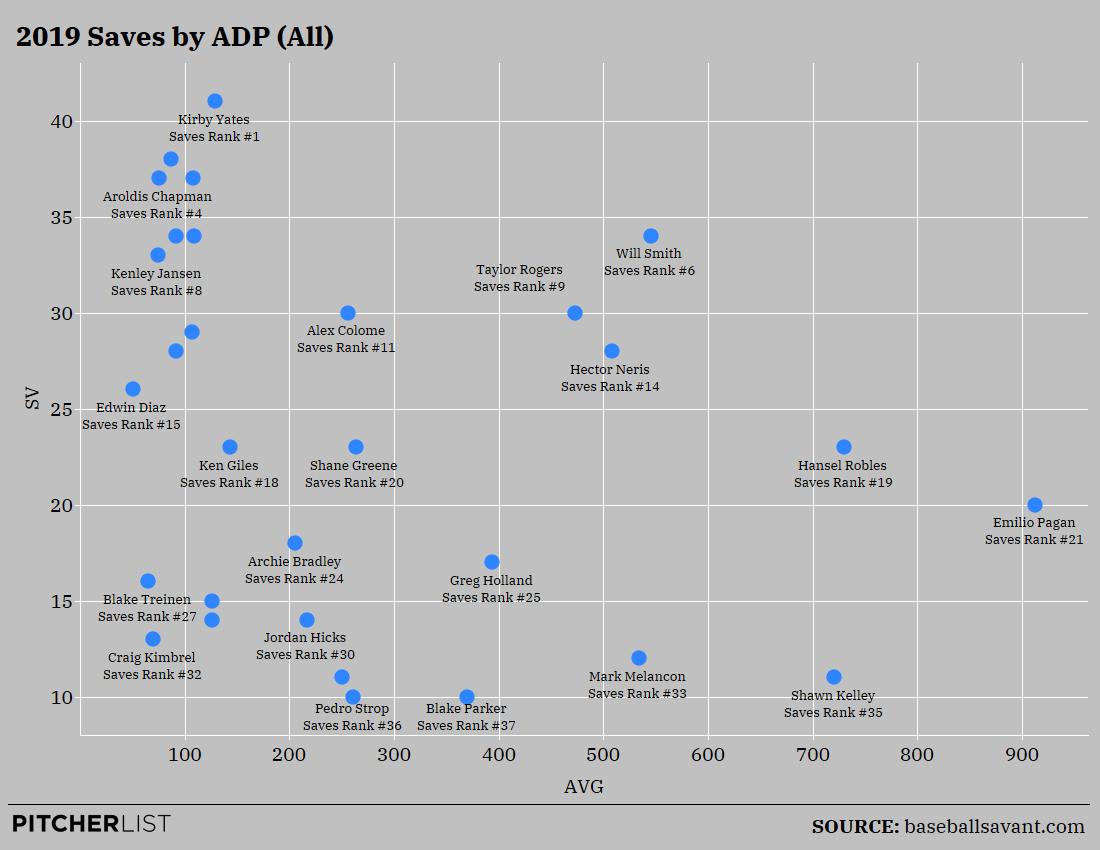
There were five pitchers after pick 300 that earned you 20+ saves, and two that earned you over 30. Taylor Rogers, Hector Neris, Will Smith, Hansel Robles, and Emilio Pagan. Will Smith had the 10th best K% over ALL qualified RP’s, Pagan had a top 15 ERA along with the 4th best WHIP among active relievers. As a matter of fact, every one of those RP’s just mentioned had a WHIP that was top 30 among qualified relievers.
This is just one year of data though, and as was mentioned above, this trend really started to occur in the 2014 season, so let’s take a look at the ADP data for the past year 6 years.
That’s a lot to process here so here are a few takeaways: There are dozens of instances in which taking an RP early paid off. Jeurys Familia and Mark Melancon are one of three RP’s to record over 50 SVs in this time frame and both were taken in the top 100. As a matter of fact, 12 of the 13 highest SV totals in the last 7 seasons were taken in the top 100 but … of those 12, 0 happened last year and 1 happened in 2018. So a majority of those happened at the earlier part of this sample as this trend of SV distribution was continuing to develop.
Another interesting takeaway: 40% of the relievers who earned 20 SVs or more came after pick 200, 24% came after pick 300 and 20% came after pick 400.
According to a must-read piece from Al Melchior over at the Athletic, “two out of every five saves were left on the waiver wire once [NFBC 12 and 15 team] drafts were done”. That, in my mind, is a lot of evidence to support the fact that a good strategy would be to not overspend, take a reliever that falls to you after pick 100, wait until the final rounds to take other relievers and keep very active on the waiver wire.
With that said, the reason you may have come here isn’t to be inundated with numbers and graphs but to better assess who those relievers you should be drafting are. If we’re really going to do that, we need to be getting granular with how we think about saves. We need to be thinking not just of which RP’s are likely to have the best performances but how different organizations are going to utilize their RP’s differently. We also, need to be taking a look at more numbers and graphs.
Historical Trends by Organization
When I wrote that article back in 2018 I broke down saves by organization. I saw how many relievers got at least 3 saves, 5 saves and 10 saves per team. I saw how many relievers got 40% of the teams saves, 50%, 60% and so on. I did that for every organization for the past 12 years because I don’t have a life. If you’d like to see/use this data for your own research it’s all right here.
For the purposes of this piece, we’re only going to be looking at the past four seasons of data as this is where the trend has really been in full force. This also helps us get a bit more specific. For example, by narrowing the scope from 12 seasons to 4 we have fewer manager changes, though it should be said we also exacerbate the data affected by injury. In certain instances, when pertinent, I’ll comment on how the more recent sample size correlates to the 12-year sample.
Let’s start with the AL East.
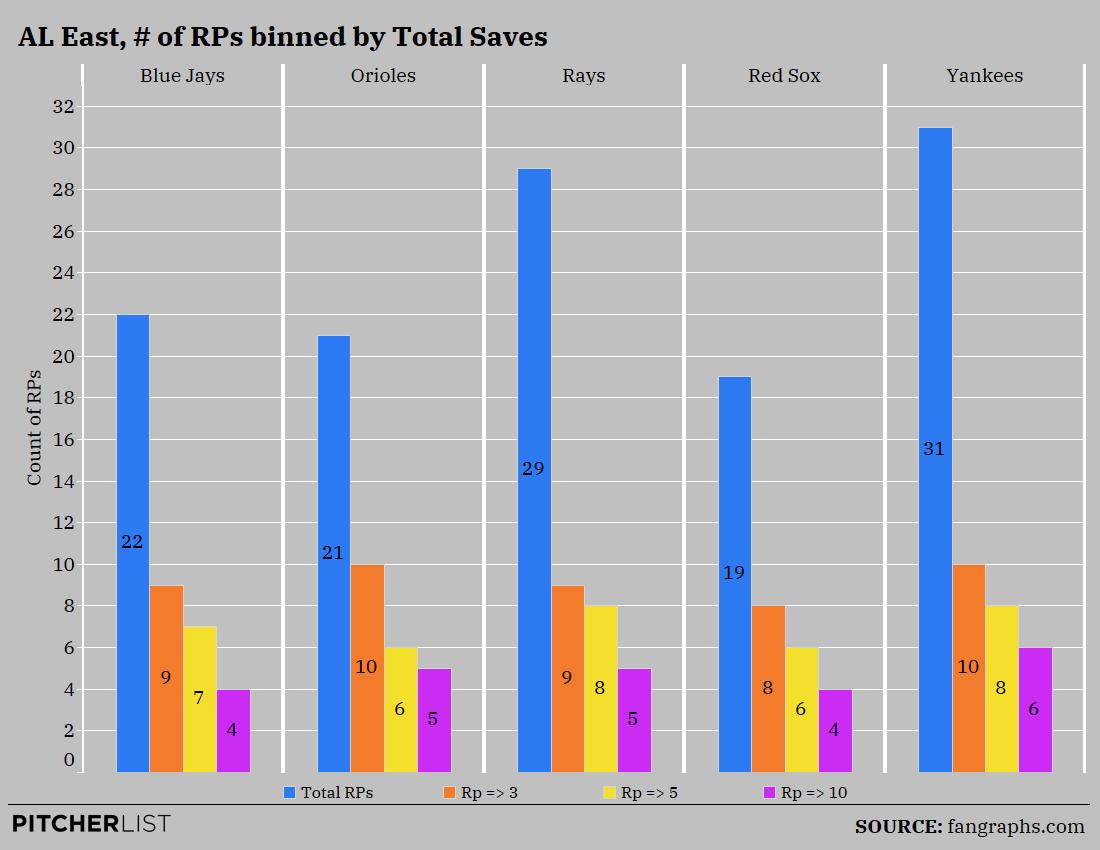
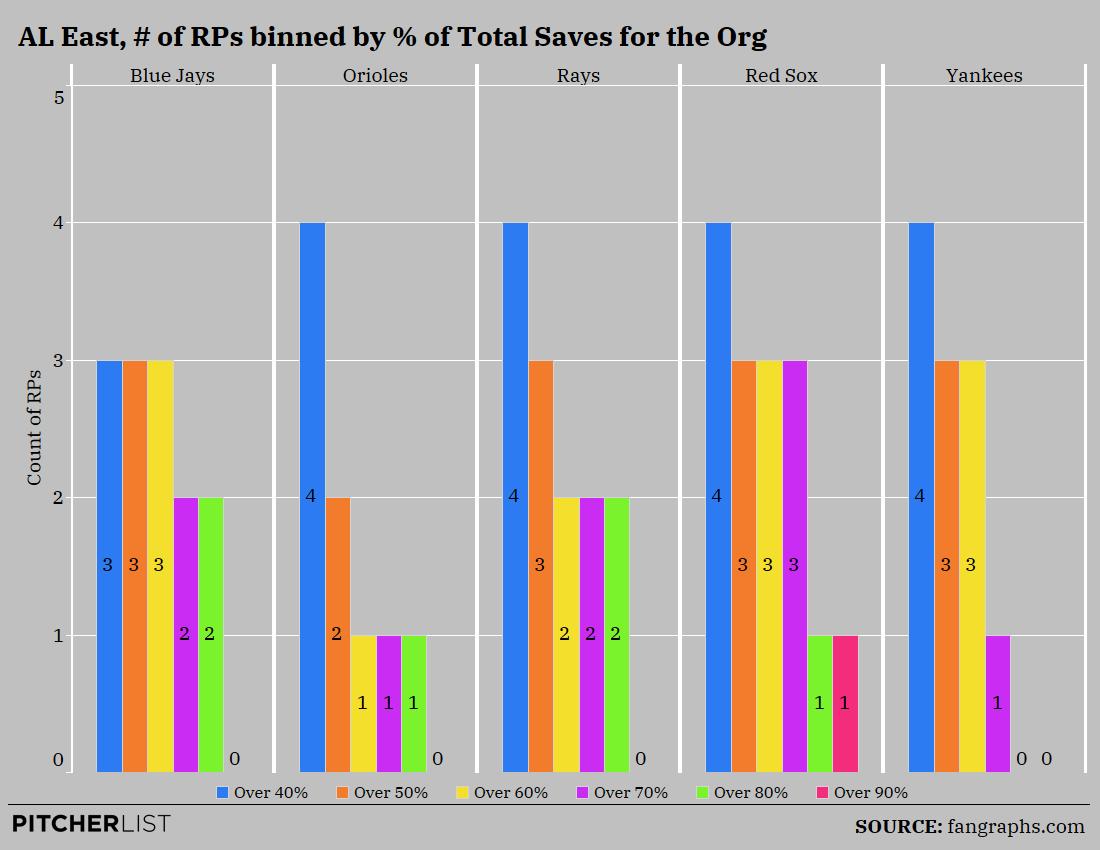
So what are we looking at here? For the chart on the left, the blue figure represents how many total RP’s have gotten saves over the past four years for an organization. The orange represents how many RP’s got at least three saves, the yellow represents how many RP’s got at least 5 save and the green represents how many relievers got at least 10 saves. The chart on the right effectively shows us how saves were distributed by organization while weeding out relievers who recorded below 5 saves. The blue line is how many RP’s in the past four seasons have gotten over 40% of a team’s saves, the higher the number the more saves were essentially being taken from a lead closer. The orange line is how many relievers got 50% of a team’s saves. Yellow is 60%, purple is 70%, green is 80% and the very rare magenta is 90%.
Let’s start with some takeaways from the chart on the left. The first thing that surprises me is how many total relievers have gotten saves for the Yankees, especially considering that Aroldis Chapman’s average ADP in this sample size is 71. The Rays also pop out a bit here. Ever since Alex Colome left the Rays via trade, the team has drastically increased how many relievers get a save. Between 2008 and 2014, the Rays averaged about 5 relievers a year getting saves. From 2014 on that shot up to 7. What happened in 2014? Kevin Cash was hired as the manager. It’s also important to note that since 2012 no team has had more relievers record at least one save than the Rays at 75 different relievers. The Red Sox and Orioles don’t seem to stick out quite so much, which makes sense considering Kimbrel and Britton’s tenure.
In regards to the chart on the right, it stands out that only ONE of the AL East teams have had a reliever get 90% or more of their teams saves: the Red Sox; Kimbrel did it in 2018. I will say, it is very, very rare that you’ll see a reliever get 90% of a team’s saves – it’s happened only 9 times in the past 4 seasons which would be about less than 1% of the time – so I feel that threshold is more important to note when it does happen as to when it doesn’t happen. The more crucial percentages for me are 70 and 80%. For example, it doesn’t shock me that Aroldis Chapman has never earned 90% or more of the Yankees saves in his tenure there. What does shock me? He’s never earned over 80% and has only once surpassed 70%. The Blue Jays also stick out to me as an organization that seems to stick with its closer a little more faithfully. While they haven’t had a single closer record over 90% of their saves in 12 years, it seemed that Osuna was the go-to guy when he was there and Giles only had saves poached from him when he was injured. If you’re willing to bank on Giles’s injury history, he seems like a good bet (and before we make jokes about him punching himself in the head; he has 1 blown save in the past two years).
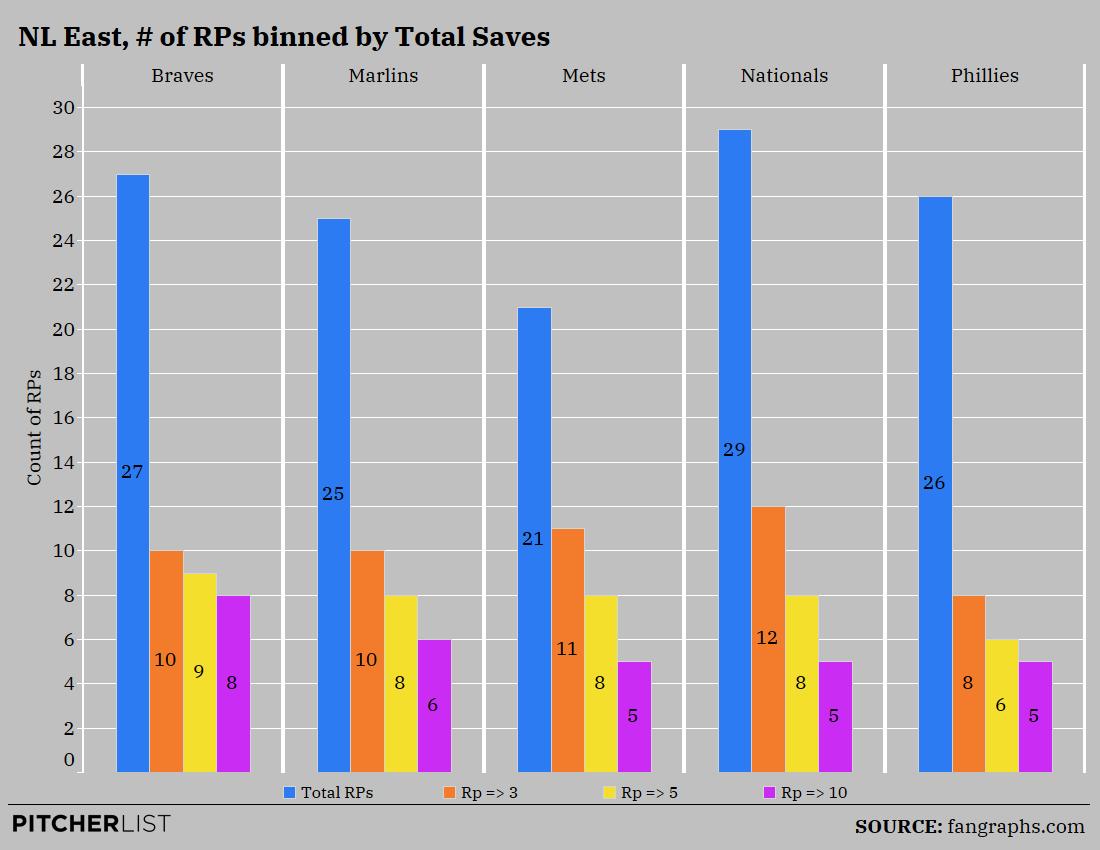
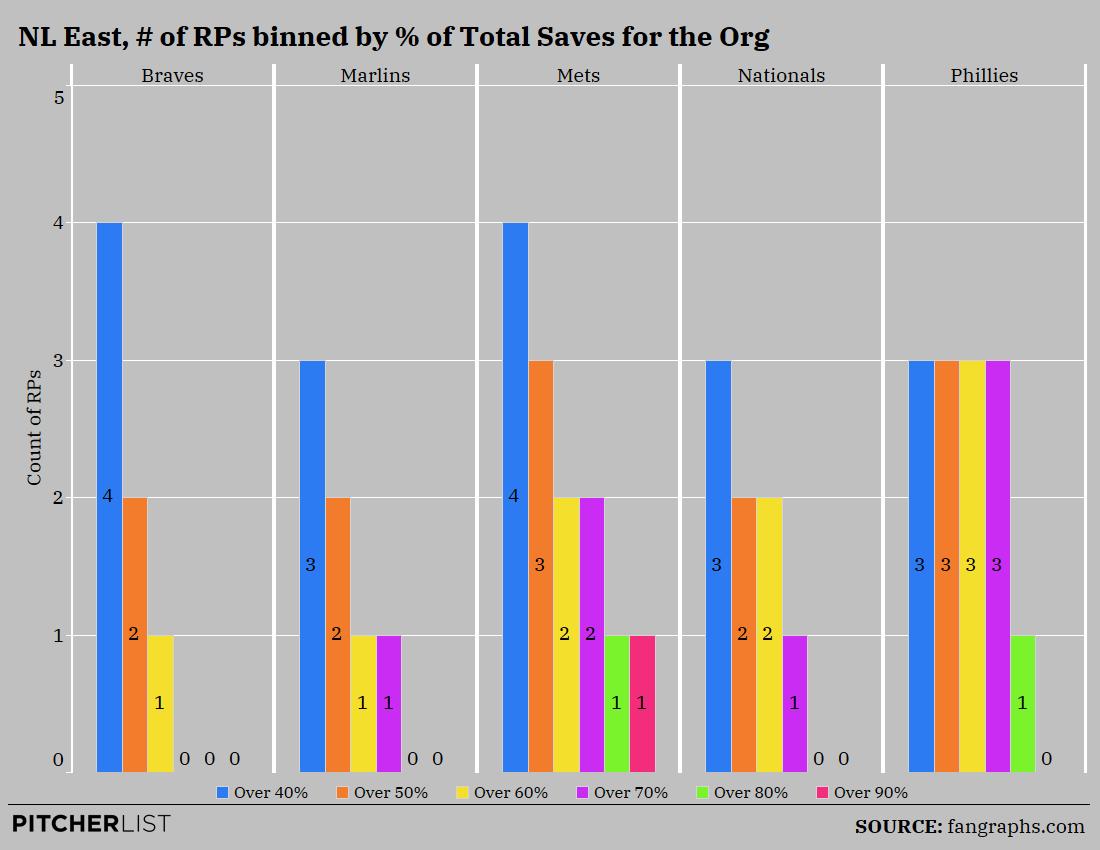
Overall, this is a bit different than the AL East as there isn’t a single team that has eclipsed 30 RP’s recording a save like both the Rays and Yankees did. The Nationals lead the division with most relievers recording a save which makes sense considering the injury woes of Sean Doolittle and carousel they utilized in ‘16 with Melancon/Papelbon and ‘17 with Glover/Treinen. I don’t foresee that being any different this year considering Sean Doolittle’s injury history though last year was the first time he reached 60 IP since 2014 (hello Daniel Hudson and his 300+ ADP). The Mets have stuck with their guy a bit – for better or worse – while the Phillies drastically increased their save distribution with the hiring of Gabe Kapler (more on him later). The Braves are an interesting example as 50% of their relievers who earned saves since 2016 came last season. In 2019, 11 different relievers recorded a save last year for the Braves though things settled down once Mark Melancon got there. Let’s take a look at how distributed these saves were for the past couple of years.
When we look to the chart on the right to see how those saves were distributed though we see that not only do the Braves lack a reliever who has earned more than 90% of their teams saves in the past three years, they also don’t have a single reliever who earned 70 or 80% of their teams saves. One would think that between Will Smith and Mark Melancon – as well as Shane Greene, Darren O’Day, Chris Martin, and Luke Jackson – this year will likely be no different for the Braves. The last time the Braves had an RP record more than 70% of their teams saves? Craig Kimbrel in 2014. The Mets are the only organization to have a 90% candidate but it should be mentioned that that was Jeurys Familia in 2016. As was mentioned the Phillies have evenly distributed saves for quite some time. In 2018, they didn’t have a single RP record more than 40% of their teams saves. It’s important to recall however that Joe Girardi, when with the Yankees, didn’t use too many guys. Now that’s easy to say when he had the number one closer in the history of baseball but even when Mariano left, Girardi stuck with a closer. While it’s easy to say, “Well of course he did, he had Chapman”, Aroldis hasn’t had near the same utilization with Brian Cashman – er, I mean Aaron Boone – managing the team. Lastly, the lone RP who recorded over 70% of Marlins saves was back in 2016 with AJ Ramos, since then the Marlins have distributed saves.
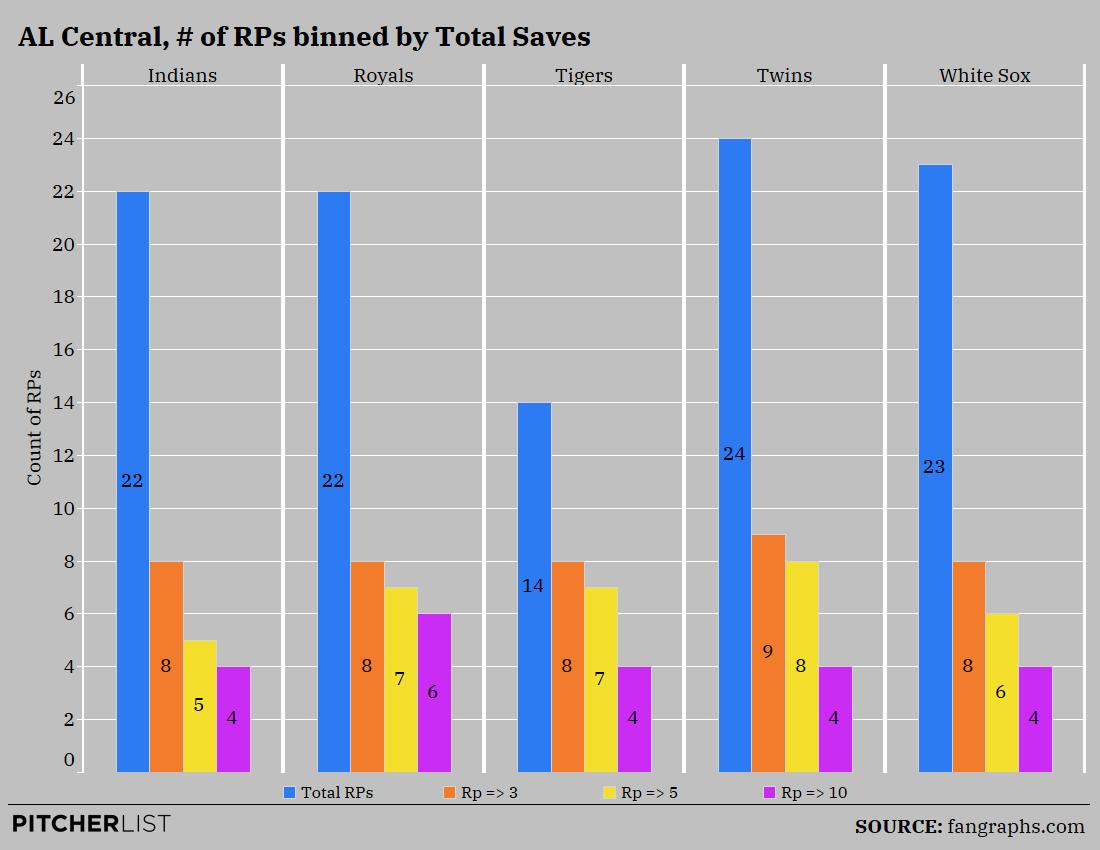
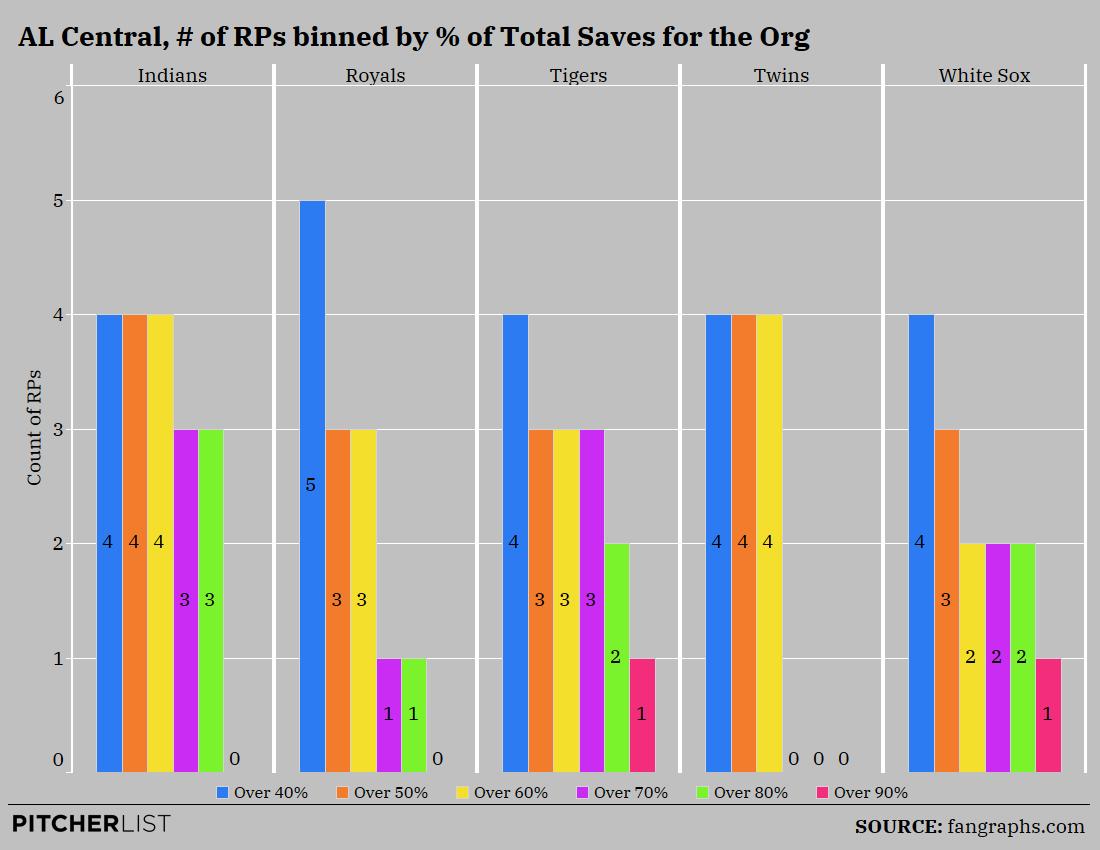
Of all of the divisions, the AL Central has had the least volatility in terms of total relievers earning saves in the past four seasons. Only two other organizations have utilized fewer closers in the past 12 seasons than the Tigers have. Whether it was Leyland, Ausmus or Gardenhire, the Tigers don’t seem to like to spread it around too much. Remember, even when Greene was traded last year, Joe Jimenez got all of those opportunities. The Indians also seem to stick with their guy which in the past four years has been Cody Allen and Brad Hand. The Twins are the polar opposite however as they lead the division with 24 different relievers getting a save and 9 different relievers getting at least 3 saves. The White Sox are a bit misleading. In 2016, 2017, and 2019 they averaged about 4 RP’s earning a save. Due to Joakim Soria and Luis Avilan trade in 2018, that number jumped up to 10. When you look at the chart on the right, you can see that the White Sox are one of the 10 teams to have a reliever get 90% or more of their saves: Alex Colome in 2019. Considering their willingness to stick with a closer, I wouldn’t be surprised to see him get the bulk of chances again until he proves ineffective.
Other takeaways from the chart on the right: the Twins are a bit more worrisome, especially when you consider Taylor Rogers is a near top 100 pick by ADP. The Twins haven’t had a reliever get over 70% of their teams saves since 2015 when Glen Perkins was their closer, he’s also the last person who recorded more than 80% of their teams saves. The fact that this trend has repeated over both Molitor and Baldelli’s tenure could mean this is Thad Levine’s doing or that this is just too small a sample size to really consider this an issue. The Royals are also interesting to note as before Ian Kennedy, no one had earned more than 70% of their teams saves since Greg Holland in 2014.
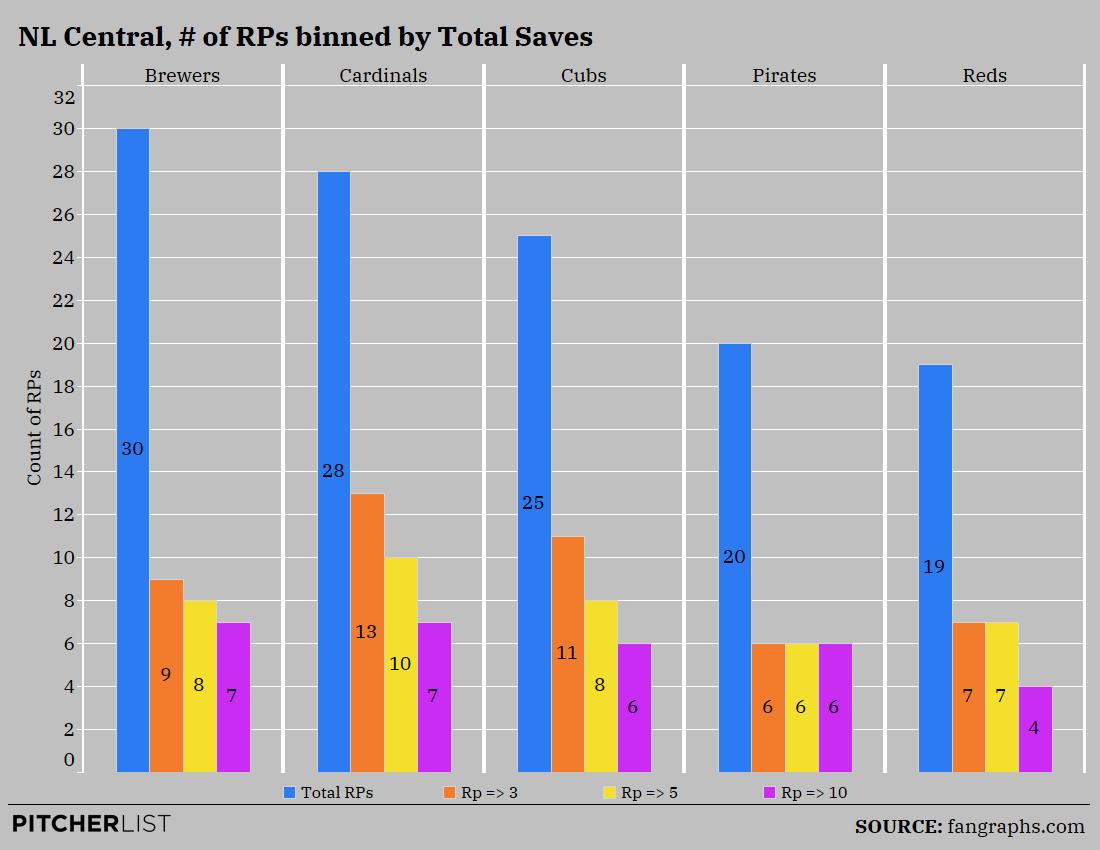
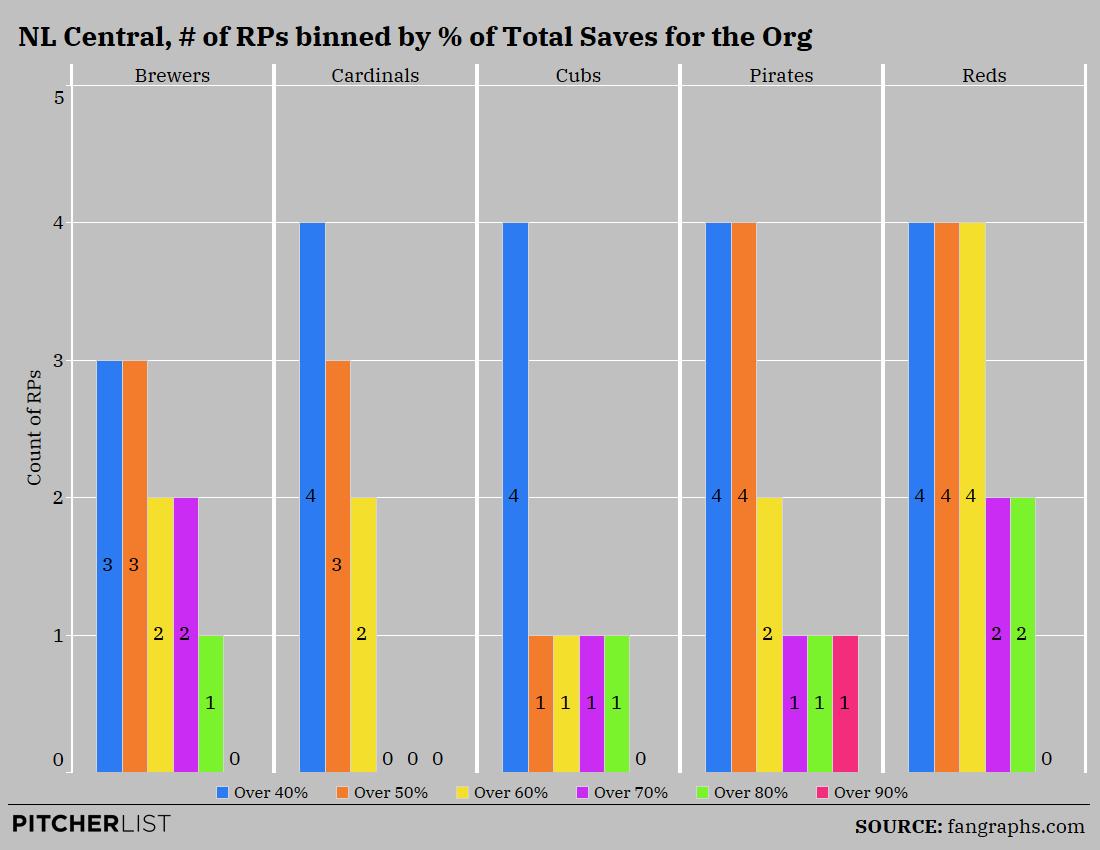
This is a pretty stark jump from the AL Central. The Brewers lead the division in how many relievers recorded a save which makes sense considering the committee they used in both ’16 and ’18 before sticking with Josh Hader. It’s important to remember however that Corey Knebel’s injury and Jeremy Jeffress decline played a part in Hader’s solidification of the closer role. While Hader’s emergence as an elite closer makes me think the trend established in ’19 of giving him the lions share will maintain, I’m curious to see if he returns to the fireman role when Knebel returns. The Cardinals, however, are moving in the opposite direction of the Brewers. While the Cardinals are second to the Brewers in how many relievers recorded a save, they lead the division in how many relievers recorded at least 3 saves with 13. This doesn’t bode well for Gallegos. The Cubs are a bit nuanced. In ‘16 Chapman was acquired who promptly stole the role from Hector Rondon. Then Wade Davis was the go-to in ‘17. There was a committee in ’18 followed by a mini committee in 19 until Kimbrel’s return. The Pirates seemed to be pretty consistent but I’d caution against trusting in that with Felipe Vazquez and Clint Hurdle gone. The Reds also seem pretty sure of sticking with their guy. This is also historically true of the organization as in the past 12 years, they’ve had 5 relievers get 90% or more of a team’s saves which is tied for first in MLB.
The stability within the Reds organization is also showcased in the chart on the right. While the Reds haven’t had an RP receive over 90% of their saves in the past 4 years, they seem historically likely to stick with Iglesias. Back to the Cardinals, we see further proof that they like to move things around as they’re yet another team to not have an RP record more than 70% of their team’s saves. I’ve heard analysts swear it will be Ryan Helsley who gets the job. Roster Resource says it’s Gallegos. The record shows it could be both of them.
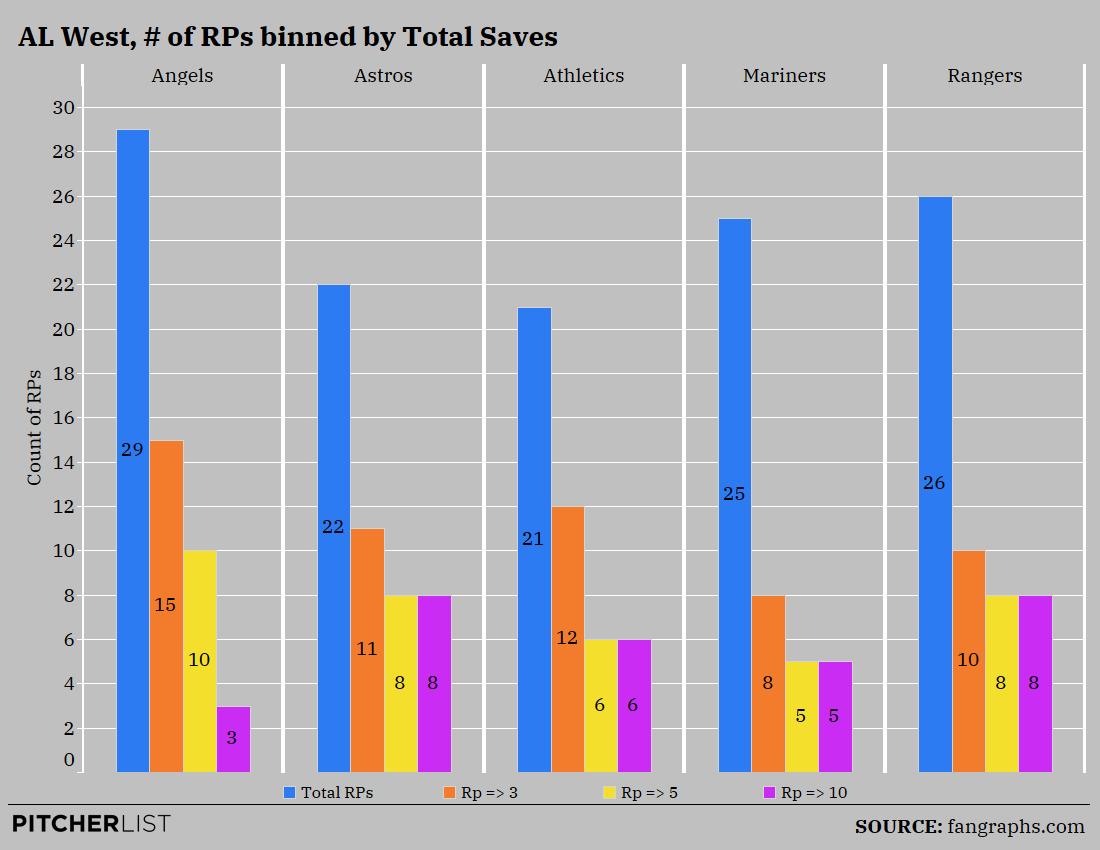
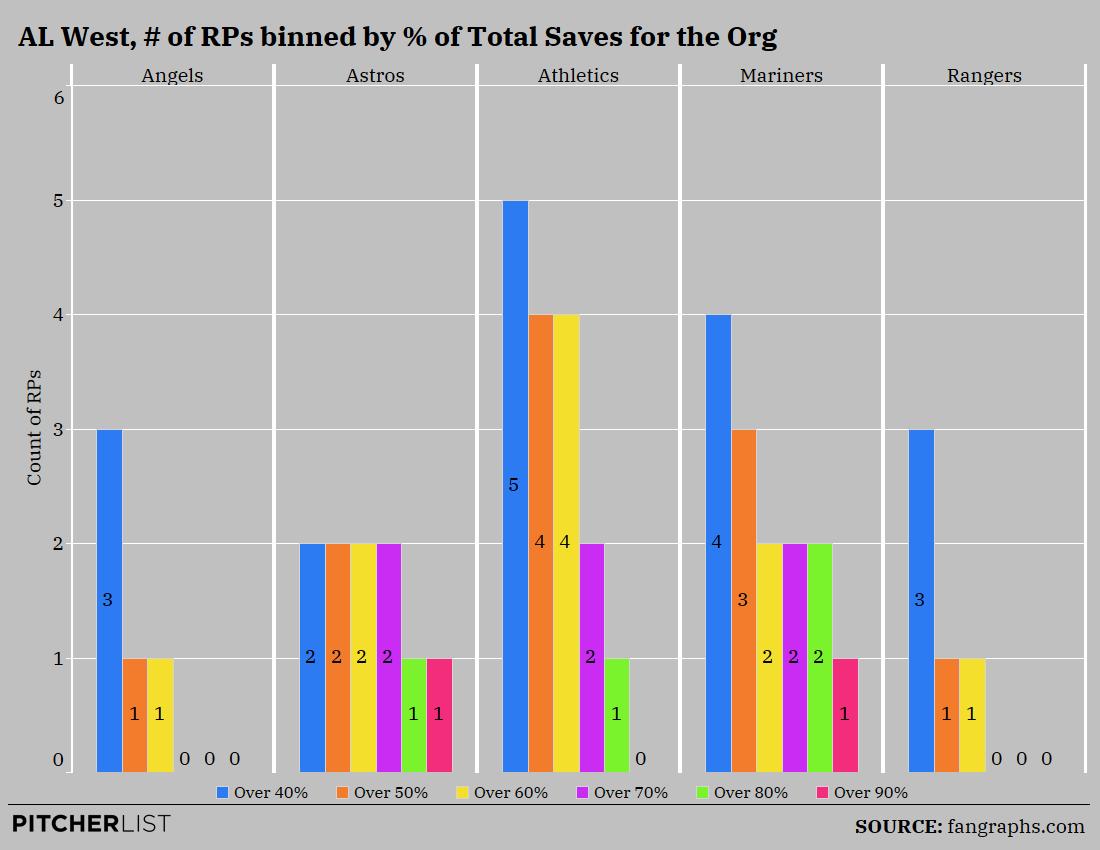
It doesn’t take long to see that Angels like to utilize a few different relievers. In the past four seasons, only the Yankees, Rays and Brewers have utilized more relievers than the Angels have. The Astros’ data is a bit skewed as Osuna was acquired mid-season in ’18 before receiving the bulk of the Astros saves. The Rangers and Mariners seem to like to move the saves around and while the 21 relievers who recorded saves for the Athletics makes it seem like they like to stick with a guy, the chart on the right very much proves this to be false
The last time the Oakland Athletics had back-to-back saves leaders was in 2012 and 2013 when Grant Balfour did it. Since then, they have not had a single RP lead the team in saves in consecutive years. So think about that when you’re about to draft Liam Hendriks. The exact same fact is true for the Rangers; they haven’t had a back-to-back saves leader since Joe Nathan in ’12-’13. While Jose Leclerc did get a four-year contract extension in ’19, he also had an 8+ ERA to start off last season and finished with the 2nd lowest SwSt over his career. While I would also think twice about taking Robles considering the Angels haven’t had a reliever record more than 70% of their team’s saves since Huston Street, they do have a new manager in Joe Madden who did seem to like to stick with a guy in his tenure with the Cubs and the Rays. The Mariners will be a coin toss as their data is a bit skewed going from a sure thing in Edwin Diaz to whatever a Matt Magill is.
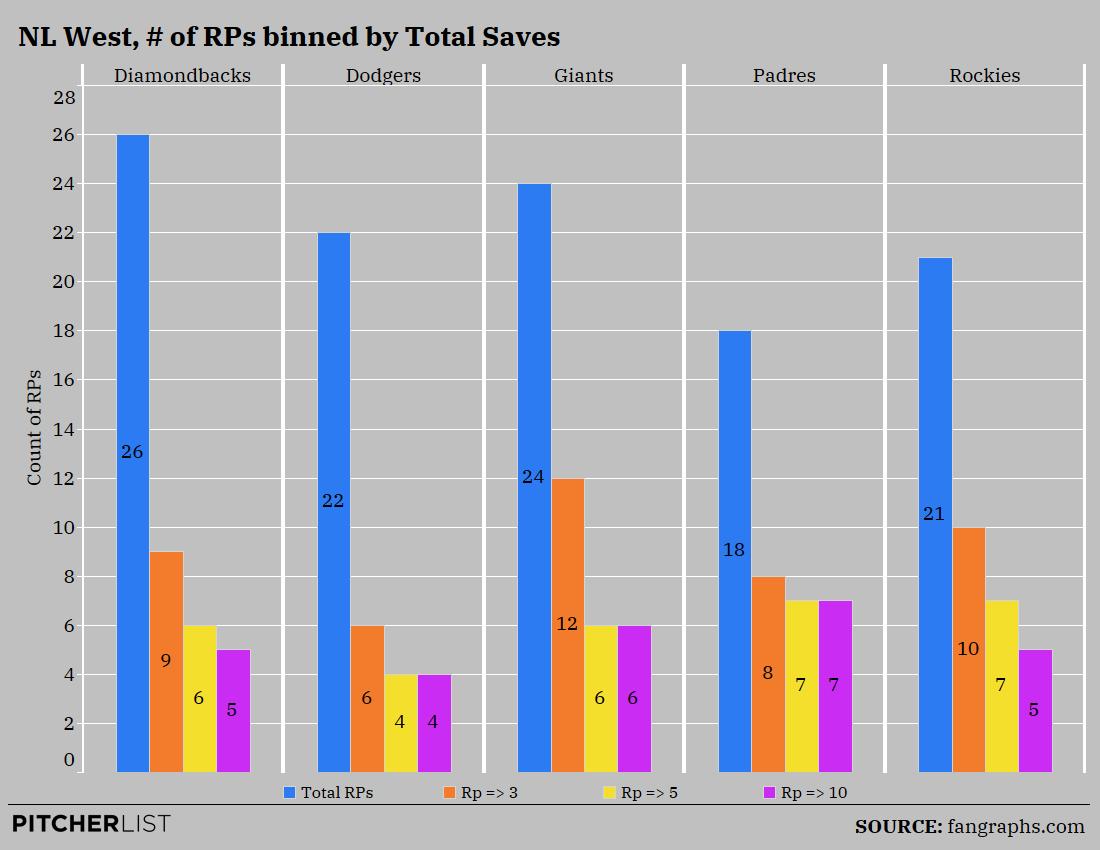
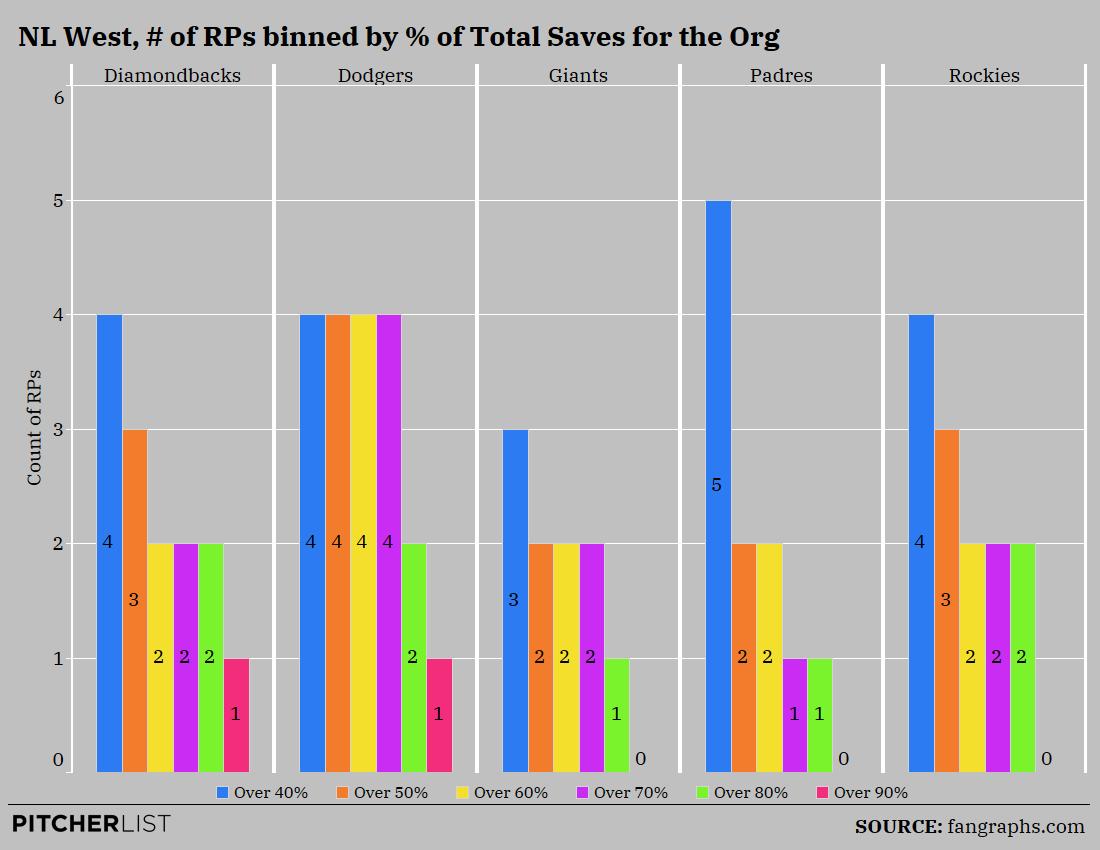
We wrap up with the NL West. The Diamondbacks and Giants seem to like to move their saves around while the Dodgers, Rockies, and Padres like to stick with a particular reliever. The Dodgers make sense considering they’ve had a top 3 RP for the past three years but the Padres are a bit different, especially when you expand the sample size a bit. Since 2008 the Padres have had just 42 relievers record at least one save which is the fewest of any team in the league. Remember the Rays led this category as they’ve had 75 different relievers record a save in that same time period.
Not reflected in the raw numbers here is the Padres’ gradual transition from not a lot of closer distribution to really not a lot of closer distribution. They went from Fernando Rodney and Brandon Maurer to Brad Hand and Maurer before shipping him off to the Royals, then to Hand and Kirby Yates before finally just giving the job to Yates. It’s important to note that along with the Reds they’re the only organization to have 5 RP’s get 90% or more of their teams saves. While I don’t see that happening in ‘20, I expect Yates will still lead the pack. The Dodgers have stuck with Kenley and will likely continue to do so. The Rockies have shown some volatility and will likely continue to do so between Wade Davis and Scott Oberg and the Giants are also going to keep spreading the saves around as well as was confirmed in spring training.
Phew. That was a lot. Let’s focus on some overarching takeaways.
Conclusions
- Saves are being more evenly distributed around bullpens. A lot of organizations have sort of moved away from that proven closer role and are looking at matchups or are looking at who has the best stuff of on a given day.
- The days of a reliever getting 90% of a team’s saves are gone. The new mark is pretty much 80% and if you’re noticing certain organizations not hit that threshold they may not be likely to move in the other direction any time soon.
- Reds and the Padres historically like to stick with their guys.
- Rangers, Rays, and Athletics tend to distribute
- Wait. There will be value late. But where?
I totally get that people will read this piece and still want to take a closer early in drafts. While I don’t necessarily agree with the strategy, I can certainly understand it. In my opinion, the data shows that it’s ok to take a Josh Hader, Roberto Osuna, Brad Hand or Kirby Yates. Yet, it also shows that, despite Raisel Igelasias’s blown saves, the Reds are historically likely to stick with their guy. What I would advise against is overspending on situations that are historically linked with more volatility. Before 2019 drafts, people would’ve sworn up and down that Blake Treinen was “the guy”. Now they’re doing the same with Liam Hendriks – a guy whose velocity hasn’t proved sustainable year over year yet – and ignoring 12 years of data. The same could be said of Taylor Rogers, Nick Anderson, Jose LeClerc, Giovanny Gallegos and more. Instead, why not use that earlier draft spot for a batter/pitcher with a lot of upside and, when the draft starts to wind down, focus on a reliever likely to poach some saves. Guys like Hunter Harvey, Brandon Kintzler, Yoshihisa Hirano, Tony Watson/Tyler Rogers, Trevor May and Aaron Bummer. All guys have an ADP over 250+ and, in my mind, have a solid chance of earning you 15-30 saves.
Feature Graphic Designed by Zach Ennis (@zachennis) and data viz by Nick Kollauf (@Kollauf)
