


Not much has gone right for the Cincinnati Reds this offseason. They knew they would lose Trevor Bauer, but they also took a step back in other areas by trading their closer Raisel Iglesias and didn’t come up with a shortstop of much significance when they had a huge hole at that spot. So yeah, not too great.
It’s probably been frustrating for fans of the Reds to watch, especially after they seemed so committed to winning just a year ago, but the games must go on. When they do start up this spring, Jesse Winker will be playing a vital role for the team as they’ll need some players to take a step forward and elevate their games to replace the wins they lost this offseason.
For Winker, it feels like we’ve been waiting for a breakout from him for a while, and to be fair, we have. He’s already 27 years old, and he has played in parts of four Major League seasons, but the most plate appearances he’s had in a single season is 384, which he set in 2019. Some of that is due to injuries, some to his issues facing left-handed pitching, and some due to a little weirdness with the Reds and playing time. However, there really shouldn’t be anything holding Winker back, and maybe this will be the season we can finally see what Winker can do in a full season.
We did see Winker play a “full” season last year, as full as a 60 game season can be. He played in all but six games for the Reds last year and was on pace for somewhere around 550 plate appearances over a regular 162 game season. Winker was outstanding in 2020, which does come with the usual caveats that we’ve been talking about all offseason regarding the shortened 2020 season. There will always be doubts about just how real a .255/.388/.544 (146 wRC+) will be in such a small sample, and there will always be question marks about Winker specifically until he can prove it over a full season.
Still, when evaluating him, it would appear unwise to dismiss his strong offensive showing from last season. Yes, it was just 183 plate appearances, but Winker’s 2020 season looks a lot different from his prior campaigns. Allow me to explain.
Let’s start with how he hit the ball. Do you have a favorite measure of contact quality? Chances are that Winker set a new career-best in it last season:
| Season | PA | AVG EV | Hard-Hit% | Barrel% | wOBACON | xwOBACON |
|---|---|---|---|---|---|---|
| 2017 | 137 | 88.0 | 32.7 | 7.1 | .431 | .399 |
| 2018 | 334 | 90.9 | 42.2 | 6.3 | .372 | .382 |
| 2019 | 384 | 89.1 | 41.1 | 4.3 | .372 | .379 |
| 2020 | 183 | 92.1 | 49.0 | 13.5 | .465 | .454 |
You name it, and he set a new career-high in it. Not only are these new career-highs, but they also shatter anything he’s done previously.
Those are definitely nice, but those are just the most readily available Statcast metrics. There is even more to like when diving in a bit deeper. Let’s move to his average exit velocity on fly balls and line-drives. That seems like a good place to go to, considering those are the batted-ball types we care most about. You may already be able to guess where this is going, but we see that, yet again, Winker set a new career-high:
| Season | EV FB/LD |
|---|---|
| 2017 | 91.5 |
| 2018 | 95.4 |
| 2019 | 93.5 |
| 2020 | 96.0 |
While this one isn’t as much of a standout as compared to the previous table, the jump from 2019 to 2020 is rather encouraging and probably more important. Some additional context also shows that Winker was one of the best hitters in the league last season in this department, as he ranked 26th out of 203 total hitters with at least 150 plate appearances. In 2019, he was much closer to the pack, as he placed 116th out 273 hitters with a minimum of 300 plate appearances. It’s definitely an encouraging sign to see him trending up here.
Next up, let’s examine maximum exit velocity:
| Season | Max EV |
|---|---|
| 2017 | 107.2 |
| 2018 | 114.1 |
| 2019 | 110.8 |
| 2020 | 113.0 |
While Winker didn’t set a new career-high here, getting beat just by just a smidge in 2018, we see a significant improvement from 2019 to 2020, just as we did with his exit velocity on fly balls and line-drives in the last table. Not only did he eclipse his 2019 mark by a mile, but he also, once again, ranked towards the top of the league at 34th out of 193 hitters with at least 100 batted-balls in this area. Winker’s 2.2 miles-per-hour improvement in max exit velocity was also one of the top-15 largest improvements from 2019 to 2020, which is quite nice to see.
Max exit velocity is useful, without a doubt, but some may feel inclined to discount it, as it is just one single data point. Even better then, we can calculate the average exit velocity for the top-10%, or 90th percentile, of his exit velocities for each season of his career to not only get a larger sample of batted-balls but to also get a better look at his top-of-the-line batted-balls. Doing this exercise with Winker shows yet another career-high:
| Season | Top-10% EV |
|---|---|
| 2017 | 100.5 |
| 2018 | 105.0 |
| 2019 | 104.2 |
| 2020 | 106.3 |
Again we see a new career-best, but we also see that Winker had a huge jump from 2019 to 2020. Just for good measure, let’s take a look at one last aspect. How about the rate of balls hit at least 100 miles-per-hour? This should be a lot simpler and more straightforward. Keeping with the theme of the last four tables, we again see Winker with a new career-best:
| Season | 100+ MPH% |
|---|---|
| 2017 | 15.3 |
| 2018 | 24.1 |
| 2019 | 24.1 |
| 2020 | 26.0 |
For additional context, the league-average for this measure within the last two years is right around 22%, so not only was Winker better than he was in previous seasons, but he is also better than league-average, a pleasant sign to see.
All told, the point is to show that Winker has just generally been hitting the ball much better, and in pretty much every aspect. Both the surface-level Statcast metrics as well as the ones that require a little bit more digging all paint Winker in a much more favorable light than in earlier seasons.
Obviously, this is all quite good. However, within all this talk about hitting the ball harder, the one thing I want to draw attention to regarding Winker is actually his rate of soft contact. It’s important to hit the ball hard—we all know that—but one that perhaps gets a bit overlooked within a player’s profile is how well a hitter is able to limit their rate of soft contact. For Winker last season, not only did he make a lot more hard-contact, but he was also much better at cutting down on bad contact, which arguably, made a bigger impact on his game than anything else.
Before I dive into this phenomenon, I must make a pedantic note. I’m shifting from using the contact-quality measures from Baseball Savant to the ones used by FanGraphs. It doesn’t change all that much in terms of hard-contact measures (for example, Winker has exactly the same 49% hard-contact number on both systems) as the top hard-contact hitters in the Baseball Savant set are the same as the FanGraphs set, but the numbers will be different.
The reason I am doing this is for the sake of simplicity more than anything else. Baseball Savant doesn’t have a pure definition of “soft-contact”; rather, they break out their contact-quality measures into six different categories, whereas FanGraphs simply has three measures, appropriately named “soft,” “medium,” and “hard.” It’s probably just easier to measure using these three descriptors and probably easier to understand as well. It’s not all that important in the grand scheme of things, but I figured I should clarify myself before moving on.
With that now out of the way, we can finally get into it. Let’s start this by taking a look at the difference between Winker’s hard-contact and soft-contact throughout his career (let’s effectively call this “Net Hard%,” just to get some clear and concise language about what we’re talking about):
| Season | Hard% | Soft% | Net Hard% |
|---|---|---|---|
| 2017 | 35.7 | 12.2 | 23.5 |
| 2018 | 43.9 | 11.8 | 32.1 |
| 2019 | 41.4 | 15.5 | 25.9 |
| 2020 | 49.0 | 10.6 | 38.4 |
From this, we see Winker’s impressive gains in both hard contact, but now we also see the major improvement in his rate of soft contact, which also shows up in his Net Hard rate, which was also a new career-best for him in 2020. Winker has actually been pretty good at getting hard-hit balls in the past. In 2019 specifically, though, he paired a good hard-hit rate with a soft-contact rate around the 16% league-average. Another good sign for sure, but we are missing some context. For instance, we don’t know how Winker compares to the rest of the league. Let’s find out then. Here is a look at the top hitters from last season (minimum 100 plate appearances) in Net Hard%:
| Player | Hard% | Soft% | Net Hard% |
|---|---|---|---|
| Fernando Tatis Jr. | 54.9% | 7.9% | 47.0% |
| Corey Seager | 52.0% | 8.5% | 43.5% |
| Jesse Winker | 49.0% | 10.6% | 38.4% |
| Gregory Polanco | 47.4% | 9.5% | 37.9% |
| Justin Turner | 48.8% | 11.2% | 37.6% |
| Miguel Sano | 47.9% | 10.4% | 37.5% |
| Teoscar Hernandez | 48.8% | 11.6% | 37.2% |
| Wil Myers | 47.9% | 11.3% | 36.6% |
| Travis d’Arnaud | 45.7% | 10.3% | 35.4% |
| Tommy Pham | 47.6% | 13.4% | 34.2% |
We see that Winker ended up placing third overall in this measure last season. He’s alongside some pretty good company, although not all of these are great names. This does provide another explanation as to how hitters such as Tatis, Seager, Hernandez, Myers, and d’Arnaud were able to take their performance levels to new heights during the 2020 season. Now, this isn’t a perfect stat, but it is useful. We know that hitting the ball hard is good, and making less bad contact on top of that is good as well.
Not all hard-contact gains are created equal, as a jump in hard-contact doesn’t necessarily mean a decrease in weak contact. For Winker in 2020, though, he managed to do both extremely well, which played a considerable role in his performance reaching new levels. Winker was also one of the biggest improvers in Net Hard rate from 2019 to 2020, as shown in the below scatterplot:
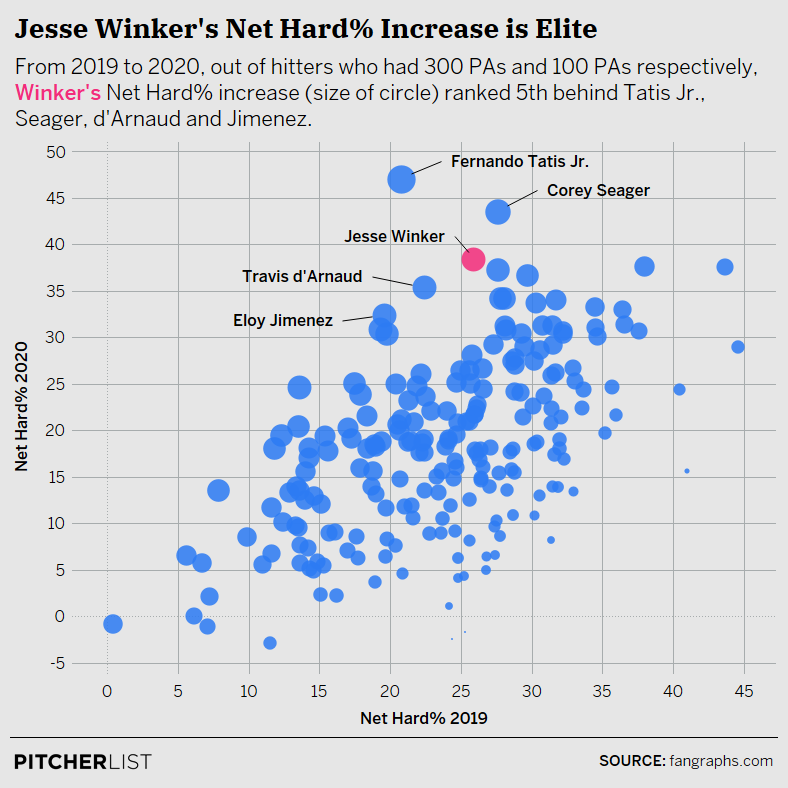
Data Visualization by @Kollauf on Twitter
Winker has always been a good hitter, but a hitter like this wouldn’t exactly be the first type of hitter one would imagine when describing Winker. He’s not in the traditional group of hard-hitters that gets brought up very frequently, but in 2020, he was in that class of hitter while also doing a superb job of limiting his weaker contact.
All of these changes in the batted-ball department from Winker certainly seem like a positive step in the right direction, but the question then shifts to: how did Winker accomplish this? These new strides in his power output likely came with a few other changes in his profile as well.
It appears that this shift by Winker last season was a conscious decision by him to sell out for more power. One of the biggest signals of a player opting for more power is pull rate. In 2020, Winker’s pull rate spiked and ended up at a level it had never been previously:
| Season | Pull% |
|---|---|
| 2017 | 34.7% |
| 2018 | 35.9% |
| 2019 | 36.0% |
| 2020 | 44.2% |
Not only was his pull rate last season by far the highest of his career, but Winker was also one of the hitters with the biggest increase year to year, ranking 16th in positive pull rate difference from 2019 to 2020. Knowing this, it is then worth it to take a look at his results when going to that direction of the field. Fortunately for Winker, this change in approach seemed to pay off, as his pull-side stats were quite strong:
| Season | AVG EV | SLG | xSLG | wOBA | xwOBA |
|---|---|---|---|---|---|
| 2017 | 89.5 | .912 | .644 | .515 | .413 |
| 2018 | 91.9 | .494 | .542 | .370 | .389 |
| 2019 | 89.5 | .410 | .445 | .295 | .336 |
| 2020 | 92.6 | .913 | .909 | .504 | .526 |
Again, what immediately stands out is how much of an improvement Winker made from 2019 to 2020 in this area. What also really stands out is that Winker, last season, had the outstanding expected results when going to the pull side that matched up with his actual ones, a sharp difference from his 2017 season, for instance, and matches up with the general takeaway that Winker was just hitting the ball so much better last season.
It is also encouraging that Winker stacks up quite well to the rest of the league when looking just at his pull-side batted-balls. His actual SLG and wOBA marks were both towards the top of the league leaderboard, but the expected versions of those metrics were both towards the tip-top of the leaderboards, with Winker’s xSLG ranking 12th and xwOBA 15th.
The other thing that must be brought up, though, is that this apparent selling out for power from Winker also lead to more strikeouts. His 25.1% strikeout rate last season is a near-ten percent increase from 2019. It’s due to more whiffs, as he whiffed 11% more last year at 29%. That makes sense intuitively, as Winker was likely taking bigger hacks at the plate than previously, thus resulting in more whiffs.
That part isn’t great. We would ideally like to see fewer strikeouts, but there is something positive to take away from this, as Winker still showcased excellent plate discipline last season. With a new shift to a power profile, a hitter may be more eager to try and show it off and start swinging at suboptimal pitches, such as those out of the zone or ones outside of the hitter’s preferred zones.
For Winker, though, he actually set a new career-high in walk rate at 15.3%. Winker is still not chasing much at all, as his chase rate dropped in 2020 to 19.3%, a rate that is nine percent better than the league average. That drop in chase rate should explain some of the decreases in overall swing rate of four percent from Winker last season. Still, we can see, based on the handy Statcast swing/take tool, that Winker was swinging more at pitches in the heart of the zone, which are pitches that he can (and rightfully did) do damage on:
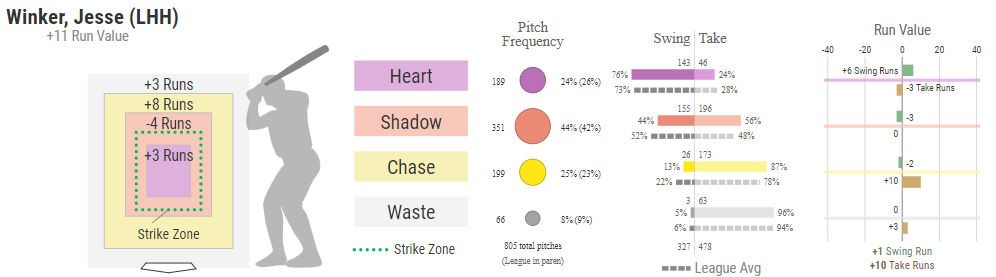
Overall, it appears that Winker, despite an increased strikeout rate, was still getting things right when it comes to plate discipline. He wasn’t chasing, and he was more aggressive at pitches in the heart of the zone, and he got good results on them. Yes, we would like to see less swing and miss, and perhaps that comes down some in the future, but for the most part, we can live a jump in strikeouts if it comes with better power, and definitely so if it comes with still excellent plate discipline, as Winker displayed last year.
All of this still does not make Winker a perfect player. As mentioned back in the introduction of this post, he hasn’t shown he can both consistently hit left-handed pitching and stay on the field for a full season, so you may still feel inclined to discount Winker’s strong 2020 season. I don’t need to rehash how 2020 did a lot of weird things to some players’ slash lines, and maybe Winker’s is super-inflated.
However, based on the adjustments he made and what those adjustments translated to on the field, it seems unwise to completely ignore what he did at the plate last year. Winker has long been a good hitter, but this was just something else, and when looking closer, it doesn’t look like it came out of nowhere. There is a lot to like about this version of Winker, and it is definitely worth it to see if he’ll continue down this path in the future.
Photo by Scott Kane/Icon Sportswire | Adapted by Doug Carlin (@Bdougals on Twitter)
Data Visualization by @Kollauf on Twitter
