


Photo by Wilfred Perez/Icon Sportswire
Back in May, I was thinking of trading for Zack Greinke, but at the time his hard contact rate was 44%, which scared me off. I went on my merry way and, as it turned out, Greinke wound up having a pretty nice season. More recently, while making my 2019 rankings, I was looking into Patrick Corbin’s 2018 to see whether he was deserving of the high rank he has received across various sites (Nick Pollack has him 14th amongst starting pitchers, for example). His 3.15 ERA, 2.47 FIP, 2.91 SIERA, 1.05 WHIP, 24.8 K-BB%, and 15.6 SwStr% all looked excellent to me. But then I noticed his quality of contact stats were out of whack. In spite of his excellent results, Corbin was giving up 41.7% hard contact.
And then I remembered my hesitation pulling the trigger on Greinke.
I decided to look at some of the other pitchers in Arizona to see if their hard contact rates were high, too. Zack Godley’s? 38.4%. Clay Buchholz’s? 38.1%. Robbie Ray’s? 44.4%. Those rates feel abnormally elevated, but are they?
Of qualified pitchers, Corbin ranked second overall in hard contact rate, Greinke was fourth, Godley tenth, and, if they qualified, Ray would have been first and Buchholz twelfth.
| Pitching Staff | Hard Contact% | Rank |
| Arizona Diamondbacks | 41.0 | 1st |
| Texas Rangers | 40.5 | 2nd |
| Kansas City Royals | 40.3 | 3rd |
| Los Angeles Angels | 38.9 | 4th |
| San Diego Padres | 38.6 | 5th |
It’s no surprise, then, that as a whole, Arizona’s pitching staff had the highest hard contact mark in the league. Is this anomalous, or par for the course for Diamondbacks pitchers?
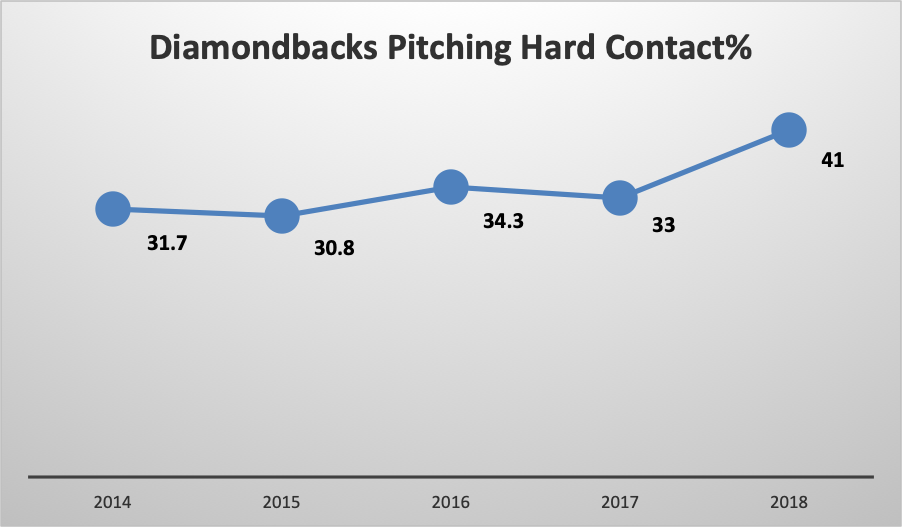
The hard contact rate for Arizona’s pitching staff hovered in the low 30s for four years, then jumped to 41% in 2018. Clearly, this season was an oddity. My next thought was, well, maybe it’s not just Arizona’s pitchers, maybe it’s something in Arizona that’s causing the increase in hard contact. To test that theory, I wanted to see how the Diamondbacks hitters fared against the rest of the league.
| Lineup | Hard Contact% | Rank |
| Arizona Diamondbacks | 39.8 | T-1st |
| Oakland Athletics | 39.8 | T-1st |
| St. Louis Cardinals | 39.1 | 3rd |
| Los Angeles Dodgers | 38.9 | 4th |
| Milwaukee Brewers | 38.5 | 5th |
It’s becoming clear that Arizona is the outlier. Yes, the Diamondbacks were tied with the Athletics, but neither the A’s nor any team in the top five on this list — other than the Diamondbacks, of course — were top five in hard contact allowed, too. In other words, no other team’s hitters were hitting the ball harder than the Diamondbacks, and no other team’s pitching staff was getting hit harder than the Diamondbacks’. No other team was even in the top five in both stats.
Is it possible their hitters were just making really good contact and their pitchers were getting hit that hard? Sure. Is it likely? Probably not, especially considering that the Diamondbacks 2018 roster was very similar to 2017, and yet, based on the graph above, 2018 was an outlier for hard contact relative to the prior four seasons.
As all contact is broken down by Baseball Info Solutions into Soft, Medium, and Hard, there are only two places that could be supplying the extra hard contact. For its pitching staff, Arizona had the second lowest medium contact rate at 42.7% and the fifth lowest soft contact rate at 16.4%. Similarly, Diamondbacks hitters’ medium contact rate was 43.1%, the second lowest in the league, while their soft contact rate was 17.2%, tied for 8th lowest in the league. Given these unusually low medium contact rates, Arizona’s increase in hard contact is likely coming from medium contact.
I previously noted a league-wide increase in hard contact rate and a corresponding decrease in medium contact rate, but the change in Arizona in 2018 was much larger than the change across the league. Therefore, if the increase in hard contact in Arizona was just attributable to the league-wide increase, I’d expect to see better power hitting and worse pitching ratios relative to the rest of the league to account for the larger increase in hard contact in Arizona. And that’s not the case.
| Statistic | Diamondbacks 2018 | MLB Rank |
| ERA | 3.73 | T-4th |
| WHIP | 1.25 | T-9th |
| HRs allowed | 174 | T-9th |
| HRs hit | 176 | T-17th |
| SLG | .397 | 22nd |
| ISO | .162 | 13th |
| Hard Hit% (as measured by Statcast) | 34.4 | 19th |
| Barrels% | 7.0 | 10th |
| Avg Exit Velocity | 87.4 mph | T-18th |
Despite its league-leading hard contact rate, Arizona’s pitching staff was actually quite good this season, earning top 10 marks in ERA, FIP, SIERA, WHIP, and HRs allowed. Similarly, even though Arizona’s lineup was tied for first overall in hard contact rate, it was mediocre across other power categories, only posting one top 10 mark in Barrels%.
Okay, so what’s happening in Arizona? Why is hard contact so high at Chase Field? To answer these questions, we need to consider where quality of contact data originates. It’s supplied to Fangraphs via Baseball Info Solutions. Since 2010, Baseball Info Solutions’ “video scouts recorded the amount of time the ball was in the air, the landing spot, and the type of batted ball (fly ball, ground ball, liner, etc) and the BIS algorithm determines if the ball was soft, medium, or hard hit.” Thus, the calculation is “based on hang time, location, and general trajectory.”
While I previously concluded that the increase in hard contact across the league could be attributed to changes in Baseball Info Solutions’ algorithm, that theory would not make sense in this case, because the algorithm, presumably, is applied equally across all teams. I can think of no reason why the algorithm would characterize an A.J. Pollock line drive in Chase Field differently from a Brandon Nimmo line drive hit with the same “hang time, location, and general trajectory,” just in Citi Field. And yet, Arizona produced more hard contact than any other team, despite not having done so in recent years, maintaining great pitching ratios, and showing mediocre power output.
My best guess, then, is that the notorious new humidor in Chase Field is the culprit behind this. The humidor helps the ball retain more water than it normally would in the dry Arizona heat, thereby weighing it down and decreasing exit velocity. It’s possible that some of the inputs for the BIS algorithm, as measured by the scouts (e.g., batted ball data), would be conducive to producing hard contact, without actually yielding corresponding results in power. For instance, imagine a scout notes a fly ball off the bat of David Peralta. After inputting a fly ball into the algorithm (among other things), the algorithm spits out a high hard contact rate for that hit. But the humidor has weighed down Peralta’s fly ball, and instead of leaving the park, he hits a double, or flies out. Therefore, due to the humidor, the corresponding power output could be lower than the measurements taken by BIS would suggest for the algorithm. Alternatively, perhaps the video scouts just made mistakes in Arizona this year.
What’s most important for you, however, is to take hard contact rates from Diamondbacks players with a grain of salt. Paul Goldschmidt may have posted the highest hard contact rate of his career in 2018 (46.2%!), but that doesn’t mean he’s going to continue hitting 30+ bombs in 2019. He actually hit more homers in prior seasons in which he had lower hard contact rates.
And all of that’s to say, I knew I should have traded for Greinke back in May…
Interesting article! I noticed something similar going on in Comerica Park in 2017.
However, I’ve pretty much given up on looking at hard / soft / medium contact at this point. The way it’s calculated is gives an indirect picture of the batted ball authority. Why not just go straight to baseball savant and get the real thing?
For what it’s worth, exit velo in Chase was 9th among MLB ballparks at 88.0 MPH. Away team exit velo in Chase was 87.4 MPH, which was 20th among ballparks. That doesn’t adjust for quality of Diamondbacks pitching assuming it’s significantly different than league average, however it’s enough evidence to show that balls weren’t getting hit harder in Chase.