


A few weeks after the conclusion of the truncated 2020 season, I published xRV: The best pitches and pitchers of 2020 while working for BaseballCloud. Here, I formally introduced my pitch quality metric, Expected Run Value (xRV). Since then, I’ve been utilizing the model’s results in attempts to explain the stories of pitchers’ pitch types, arsenals, and isolating the two major components that went into xRV 1.0: stuff and command. Such as:
Hendriks' fastball was in the 98th percentile of all pitch types by xRV in '20 – the 32nd best pitch overall (min. 50 pitches).
His SL, in a vacuum, was in the 49th %ile, but it undoubtedly plays off his elite FB. It doesn't have a .149 xwOBA over the last 2 years by accident. https://t.co/qDyI6KENw1
— Luke Smailes (@lukesmailes4) January 12, 2021
THREAD: (1/6)
xRV indicates that Ryan Thompson likely benefited the most from this arm slot differential, but Diego Castillo probably did as well.
Their combined 29 pitches collectively outperformed their xRV (a metric that doesn’t consider arm slot). https://t.co/2R5XYYoFYy
— Luke Smailes (@lukesmailes4) October 14, 2020
Through these examples, I’m alluding to something being missed here—some factor that plays a substantial role in what is pitching. That something is deception—a factor that I hoped would account for the residuals in my initial xRV model in this new version.
In a nutshell, xRV is built using a random forest algorithm that takes count, quality of contact, and pitcher/hitter handedness into account, and these qualities remain the same. Below, I address each of the attributes included in the model and also explain the 2.0 additions in more detail.
My first steps were to figure out how to quantify this phenomenon of deception, which by definition (in a baseball context), is “causing [a hitter] to believe something that is not true.” I then came across (former Indiana University baseball analyst and now Los Angeles Angels analyst) Jake Sauberman’s post (@jakesaub) where he outlines a three-pronged approach to attempt to quantify deception: indistinguishability, unpredictability, and unexpectedness. I now had my methodology inspiration, as Sauberman did a great job theorizing what exactly makes a pitcher deceptive. Rather than drum up new terminology to end up saying the same thing, I decided to reach out to Jake for his feedback on my application before moving forward with essentially his basic framework after some tweaks.
To better understand the foundation of xRV, which is still the same for the 2.0 version, I recommend giving 1.0 a read.
Indistinguishability
While Sauberman estimated indistinguishability as release point tunneling, I wanted to focus on the commit point of hitters to create a tunneling metric. In The Physics of Baseball, Yale physicist Robert Adair identifies the commit point as roughly 24 feet before home plate, which on a 90 mph fastball, equates to about 175 milliseconds.
In order estimate tunneling, I needed to have the probable pitch trajectories of every pitch at every .01 second (ten millisecond) interval. To do this, I utilized the pitchRx package in R and the getSnapshots function within. The function does what you’d expect given its name: It takes individual pitch metrics such as release point, velocity and acceleration, plugs them in to the kinematic equations from renowned baseball physicist David Kagan, and spits out a “snapshot” vector of the estimated coordinates at every ten-millisecond interval. I then just pulled out the point closest to where y = 24ft for each pitch thrown in 2020, and I then had my estimated commit points.
Back in 2017, Harry Pavlidis, Jonathan Judge, and Jeff Long wrote about pitch tunnels for Baseball Prospectus where they outline a Break:Tunnel Ratio that shows “the ratio of post-tunnel break to the differential of pitches at the Tunnel Point.” This was my foundational inspiration for how exactly to model what pitch tunneling is.
To effectively tunnel pitches, the goal is to minimize the distance of two pitches at the commit point (or tunnel point, point of no return, etc.) while then maximizing the distance between the pitch’s final coordinates. This simulates the “late break” that’s theoretically happening as the hitter is attempting to make contact. For the sake of my model, I simply took the Euclidean distances of the two pitches at their commit points and divided it by the pitches final Euclidean distances to create my tunnel metric. Thus, a smaller value was more favorable.
But how would I actually compare the pitches? Sauberman compares every pitch to the one thrown right before as the point of comparison. While I don’t necessarily disagree with the functionality of this method, I think comparing each pitch to a broader scope of the past better models hitter perception. A pitcher could get a whiff on a slider based on a well-tunneled fastball that he threw to that hitter two pitches prior, or even two at-bats prior. Plus, advance scouting and coaching staffs are feeding hitters information about the pitcher (including video) leading up to the at-bat, especially on their main pitch, and this affects their perceptions.
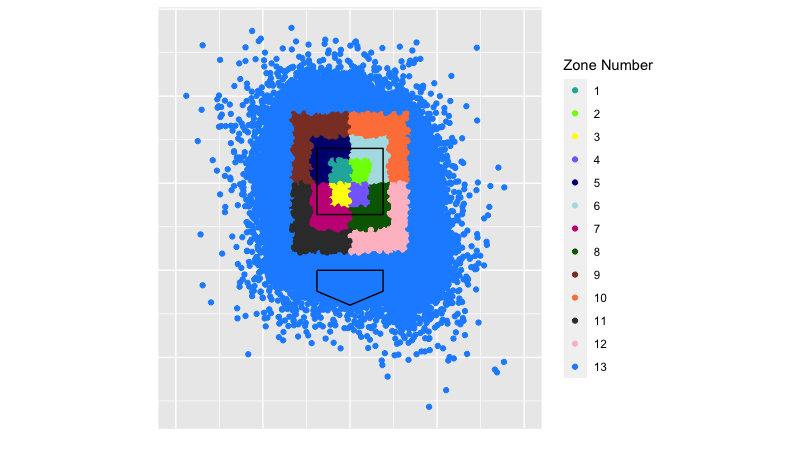
Therefore, I decided to compare each pitcher’s secondary pitches (all pitches he threw except for the most often-used pitch type) to the average commit and final locations of their main pitch type. The kicker is that I also took all the “main pitches” (roughly 80% of these are fastballs) and divided them up into 13 zones as defined by MLB’s heart, shadow, chase and waste zones to get more precise with the relationships. From there, I calculated how well each secondary pitch would tunnel with the pitcher’s main pitch when thrown in each of the 13 zones. Finally, I took a weighted average of those estimated tunnels based on where the pitcher located his main pitch in 2020 to construct my tunnel metric.
There’s no good way to explain that mouthful of a process, so maybe these visuals will help.
This is the breakdown of the zones from the catcher’s perspective:
To stick with Liam Hendriks as an example, this was his best tunneled slider in 2020 given where he threw his four-seam fastball on average. Elvis Andrus was completely off balance.
https://gfycat.com/repentantcolossaldrever
This pitch is in zone eight (shadow low left from the catcher’s perspective) and according to the model, it best tunnels with his four-seamers thrown in zone four, followed by (in order) zones three, one, two and seven. Since Hendriks spots his fastball in zone four 6% percent of the time, that’s effectively how much “tunnel credit” he gets for that slider thrown in zone eight. Furthermore, his fastball is thrown in zone three 10% of the time and zone one 14% of the time (and so on), so these zones are weighted more heavily and have more of an effect on the TotalTunnel metric.
For each pitcher’s primary pitch type, each pitch was compared to a usage-weighted average of the tunnel metrics for each of their secondary pitches. For instance, if my model tells me that Hendriks’ slider tunnels with his fastball in the 66th percentile of all secondaries, then it’s reasonable for me to conclude that his fastball’s tunnel metric is in the 66th percentile for the 22% of his pitches that are sliders. Finally, each primary pitch is scaled based on how often that pitch is thrown (1 – Usage%). Otherwise, pitchers who threw their primary pitches extremely often would be boosted, as their secondary pitches with low usage-weights would over credit the overall tunnel with the primary pitch type.
Enough nuts and bolts. Here are some leaderboards:
| Top-15 Tunneled Breaking Balls – min. 100 pitches | ||||||
| Name | Pitch Type | Team | Total Tunnel | Pitches | ||
| 1 | Blake Snell | Slider | Rays | .388 | 117 | |
| 2 | Will Harris | Cutter | Nationals | .399 | 245 | |
| 3 | Kevin Ginkel | Slider | D-Backs | .404 | 125 | |
| 4 | Ryan Yarbrough | Cutter | Rays | .405 | 277 | |
| 5 | Triston McKenzie | Slider | Indians | .410 | 103 | |
| 6 | Kyle Gibson | Slider | Rangers | .414 | 267 | |
| 7 | Mark Melancon | Cutter | Braves | .416 | 165 | |
| 8 | Trevor Williams | Slider | Pirates | .421 | 247 | |
| 9 | Cy Sneed | Cutter | Astros | .422 | 216 | |
| 10 | Corbin Burnes | Slider | Brewers | .424 | 119 | |
| 11 | Chris Stratton | Slider | Pirates | .427 | 134 | |
| 12 | Jose Urena | Slider | Marlins | .429 | 122 | |
| 13 | Tony Gonsolin | Slider | Dodgers | .431 | 103 | |
| 14 | Dylan Floro | Slider | Dodgers | .432 | 102 | |
| 15 | Brandon Woodruff | Slider | Brewers | .434 | 118 | |
Note: It’s personal preference for me to consider cutters to be breaking balls, not fastballs
| Top-15 Tunneled Changeups & Splitters – min. 100 pitches | |||||
| Name | Pitch Type | Team | Total Tunnel | Pitches | |
| 1 | Ryan Yarbrough | Changeup | Rays | .358 | 231 |
| 2 | Steven Brault | Changeup | Pirates | .421 | 175 |
| 3 | Martin Perez | Changeup | Red Sox | .435 | 249 |
| 4 | Carlos Carrasco | Changeup | Indians | .438 | 289 |
| 5 | Jon Lester | Changeup | Cubs | 438 | 129 |
| 6 | Tommy Milone | Changeup | Orioles/Braves | .442 | 258 |
| 7 | J.A. Happ | Changeup | Yankees | .443 | 119 |
| 8 | Zach Davies | Changeup | Padres | .444 | 409 |
| 9 | Max Scherzer | Changeup | Nationals | .452 | 182 |
| 10 | Alex Cobb | Splitter | Orioles | .457 | 242 |
| 11 | Noe Ramirez | Changeup | Angels | .461 | 101 |
| 12 | Evan Marshall | Changeup | White Sox | .462 | 125 |
| 13 | Shane Bieber | Changeup | Indians | .463 | 105 |
| 14 | Gio Gonzalez | Changeup | White Sox | .469 | 194 |
| 15 | Alex Young | Changeup | D-Backs | .472 | 148 |
| Top-15 Tunneled Arsenals – min. 500 pitches | ||||
| Name | Team | Total Tunnel | Pitches | |
| 1 | Mike Clevinger | Indians/Padres | .439 | 610 |
| 2 | Asher Wojciechowski | Orioles | .444 | 635 |
| 3 | Steven Brault | Pirates | .445 | 662 |
| 4 | Austin Voth | Nationals | .448 | 821 |
| 5 | Blake Snell | Rays | 450 | 805 |
| 6 | Zach Davies | Padres | .451 | 1,009 |
| 7 | Chris Stratton | Pirates | .452 | 511 |
| 8 | Tarik Skubal | Tigers | .456 | 530 |
| 9 | Tyler Mahle | Reds | .456 | 776 |
| 10 | Triston McKenzie | Indians | .458 | 506 |
| 11 | Andrew Heaney | Angels | .459 | 994 |
| 12 | Shane Bieber | Indians | .459 | 1,162 |
| 13 | Zac Gallen | D-Backs | .460 | 1,053 |
| 14 | Carlos Carrasco | Indians | .460 | 1,030 |
| 15 | Ryan Yarbrough | Rays | .463 | 772 |
Unpredictability
For this facet of the model, I made no tweaks to Sauberman’s process. As he puts it,
“The less a pitcher deviates from his usual pitch type frequencies no matter the count, the harder it will be for the batter to guess which pitch is coming.”
Having count-neutral confidence in your pitch types seems like a valuable aspect to a pitcher’s success, provided those pitch types are good enough to get major league hitters out.
For each pitch type, the process was to calculate its usage percentage in each count and then subtract that usage from the pitcher’s overall usage of the pitch. Finally, these calculated deviations are weighted given how often each count appeared in MLB in 2020.
Another way to think about the value of count unpredictability is to look at it through the lens of game theory, specifically a Mixed Nash Equilibrium. By being more diverse with pitch types in any given count, the pitcher is effectively reducing the hitter’s probability of maximizing their payoff by guessing the pitch type correctly. While hitting success is not purely based on guessing correctly, it’s reasonable to assume that when a hitter does guess the pitch type correctly, it has a substantial positive effect on the quality of contact, and thus the run value of that pitch.
Neil Paine dove into this idea more thoroughly back in 2015 for FiveThirtyEight where he asserts that we should expect a pitcher’s arsenal to “settle into the optimal mix for retiring opposing hitters: a mix of fastballs and change-ups that’s impossible for a batter to exploit” … “assuming the batter adapts accordingly.”
The existence of more tools in the toolkit for any given pitcher only extenuates the difficulty of exploiting pitch type selection.
With a minimum qualifier of 100 pitches of any pitch type, the most unpredictable pitch types in 2020 were, in order: Lance Lynn’s sinker, Zack Greinke’s slider, Alex Young’s four-seamer, Johnny Cueto’s curveball, and Aaron Civale’s slider.
The most predictable pitches were Dylan Bundy’s curveball, Richard Bleier’s sinker, Ryan Thompson’s sinker, Clayton Kershaw’s four-seamer, and Rich Hill’s four-seamer.
For an entire arsenal weighted by usage, here are the top-15 most unpredictable arms from 2020. A minimum of 500 pitches gives me a good subset of the mostly healthy starters from last season.
| Top-15 Unpredictable Arsenals – min. 500 pitches | ||||
| Name | Team | wUnpred | Pitches | |
| 1 | Brady Singer | Royals | .015 | 983 |
| 2 | Austin Voth | Nationals | .016 | 821 |
| 3 | Andrew Heaney | Angels | .017 | 994 |
| 4 | Josh Tomlin | Braves | .017 | 510 |
| 5 | Daniel Ponce de Leon | Cardinals | .019 | 558 |
| 6 | Gerrit Cole | Yankees | .019 | 1,011 |
| 7 | Lance McCullers Jr. | Astros | .019 | 807 |
| 8 | Jon Gray | Rockies | .019 | 616 |
| 9 | Triston McKenzie | Indians | .019 | 506 |
| 10 | Frankie Montas | Athletics | .020 | 853 |
| 11 | Zack Greinke | Astros | .021 | 967 |
| 12 | Derek Holland | Pirates | .022 | 660 |
| 13 | Lucas Giolito | White Sox | .022 | 1,089 |
| 14 | JT Brubaker | Pirates | .022 | 745 |
| 15 | John Means | Orioles | .022 | 660 |
Unexpectedness
The final addition to the model was unexpectedness, and Sauberman defines it as:
“…the deviation between the actual pitch movement (horizontal and vertical) based on the pitcher’s release point, and the expected pitch movement based on the pitcher’s release point”
This is a fascinating concept to me, and it makes perfect sense. Hitting has a lot to do with our brain making predictions, and everything the pitcher does prior to and during the delivery of the pitch generally helps in making those predictions more accurate. Major league hitters have seen millions of pitches in their lifetimes and they know (whether consciously or subconsciously) that release point is one of those clues that helps them predict what exactly that pitch will do.
In examples that Eno Sarris points out in his Attempt to Quantify Deception (a piece that Sauberman also references), Brad Ziegler’s release point clearly screams horizontal movement while Tyler Clippard gives off an impression of vertical movement. As a movement profile deviates from what is expected given release point, we find ourselves with another factor of deception.
Science Insider illustrates this process really well in this video, and it can also be applied to the indistinguishability section above.
To model what is “expected from a hitter”, Sauberman utilized a K-nearest Neighbor regression algorithm, and I followed suit. While Sauberman used season averages for the movement and release point data, my initial goal was to create this model using pitch-level data. This was because I wanted to attempt to capture the subtleties that some high-level major league hitters can detect in release point deviation from pitch-to-pitch. However, within the KNN algorithm (say with K = 500), each pitch was compared mostly to the same pitch type of that same pitcher, and this didn’t help me model the release point/movement deception factor that I was going for. This was specifically not doing the “unicorns” justice—such as James Karinchak and Tyler Rogers who have such unique release points.
I therefore followed Sauberman in running the algorithm with the pitch type season averages, and as a result, my unexpectedness model’s RMSE was reduced by one-third.
Sauberman also showed that different KNN models for each pitch type were necessary. For each model with populations between 15,662 pitches (cutters) and 79,590 (four-seam fastballs), I found the optimal value for k (150 for four-seamers, 75 for sinkers and sliders, 55 for curveballs, 50 for cutters, and 25 for changeups and splitters), feature scaled the results, and ran each algorithm.
| Top-15 “Unexpected” Movement Pitch Types – min. 100 pitches | |||||
| Name | Pitch Type | Team | PredMovDiff | Pitches | |
| 1 | Tyler Rogers | 4-Seam | Giants | .724 | 229 |
| 2 | Adam Ottavino | Slider | Yankees | .579 | 146 |
| 3 | Yohan Ramirez | Slider | Mariners | .561 | 158 |
| 4 | Ryan Thompson | Slider | Rays | .554 | 152 |
| 5 | Jakob Junis | Slider | Royals | .542 | 163 |
| 6 | Sonny Gray | Slider | Reds | .539 | 149 |
| 7 | Brad Hand | Slider | Indians | .525 | 172 |
| 8 | Tim Hill | Fastball | Padres | .516 | 132 |
| 9 | Trevor Bauer | Slider | Reds | .515 | 182 |
| 10 | Josh Lindblom | Slider | Brewers | .498 | 126 |
| 11 | Rich Hill | Curveball | Twins | .495 | 239 |
| 12 | Sergio Romo | Slider | Twins | .483 | 204 |
| 13 | Paul Fry | Slider | Orioles | .471 | 162 |
| 14 | Derek Holland | Knuckle Curve | Pirates | .447 | 250 |
| 15 | Adam Wainwright | Curveball | Cardinals | .447 | 338 |
Adding These Factors to xRV
With these three additions plus the addition of spin direction values, my xRV model had 13 attributes: velocity, horizontal movement, vertical movement, raw spin rate, spin direction, x location, z location, unpredictability, predicted movement differential, and total tunnel metrics plus dummy variables for batter handedness, pitcher handedness, and whether or not the pitch was a fastball.
Here are the top-15 pitch types and top-25 arsenals according to xRV 2.0
| 2020 Top-15 Pitch Types by xRV 2.0 – min. 100 pitches | |||||||
| Name | Pitch Type | Team | xRV/100 | xwOBA | Usage | Pitches | |
| 1 | Tyler Clippard | Changeup | Twins | -2.99 | .285 | 34.6% | 138 |
| 2 | Richard Bleier | Sinker | Orioles/Marlins | -2.60 | .322 | 50.9% | 103 |
| 3 | Adam Kolarek | Sinker | Dodgers | -2.58 | .246 | 79.8% | 193 |
| 4 | Sixto Sanchez | Changeup | Marlins | -2.42 | .192 | 26.7% | 131 |
| 5 | T.J. McFarland | Sinker | Athletics | -2.40 | .363 | 59.8% | 189 |
| 6 | Brandon Woodruff | 4-Seam | Brewers | -2.35 | .222 | 34.5% | 362 |
| 7 | Nik Turley | 4-Seam | Pirates | -2.35 | .274 | 55.5% | 190 |
| 8 | Aaron Loup | Sinker | Rays | -2.29 | .296 | 49.9% | 154 |
| 9 | Marco Gonzales | Sinker | Mariners | -2.24 | .272 | 45.2% | 442 |
| 10 | Zach Eflin | Slider | Phillies | -2.23 | .287 | 20.3% | 173 |
| 11 | A.J. Cole | Slider | Blue Jays | -2.22 | .193 | 45.4% | 163 |
| 12 | Framber Valdez | Curveball | Astros | -2.12 | .189 | 33.5% | 318 |
| 13 | Robert Stephenson | Slider | Reds | -2.09 | .200 | 65.9% | 105 |
| 14 | Walker Buehler | 4-Seam | Dodgers | -2.08 | .199 | 53.8% | 290 |
| 15 | Zack Greinke | Curveball | Astros | -2.07 | .225 | 14.8% | 108 |
| 2020 Top-25 Arsenals by xRV 2.0 – min. 300 pitches | |||||
| Name | Team | xRV/100 | FIP | Pitches | |
| 1 | Dylan Floro | Dodgers | -1.43 | 2.66 | 331 |
| 2 | T.J. McFarland | Athletics | -1.31 | 6.34 | 320 |
| 3 | Caleb Baragar | Giants | -1.31 | 4.04 | 301 |
| 4 | Trevor Rosenthal | Royals/Padres | -1.17 | 2.22 | 339 |
| 5 | Kenley Jansen | Dodgers | -1.16 | 3.03 | 378 |
| 6 | Raisel Iglesias | Reds | -1.08 | 1.84 | 302 |
| 7 | Brent Suter | Brewers | -1.07 | 3.00 | 474 |
| 8 | Cy Sneed | Astros | -1.06 | 4.75 | 300 |
| 9 | Zach Eflin | Phillies | -1.00 | 3.39 | 845 |
| 10 | Walker Buehler | Dodgers | -0.99 | 4.36 | 548 |
| 11 | Tyler Matzek | Braves | -0.92 | 1.92 | 440 |
| 12 | Nik Turley | Pirates | -0.91 | 3.88 | 348 |
| 13 | Tyler Glasnow | Rays | -0.88 | 3.66 | 882 |
| 14 | Blake Taylor | Astros | -0.88 | 4.55 | 317 |
| 15 | Trevor Bauer | Reds | -0.88 | 2.88 | 1,073 |
| 16 | Ryan Pressly | Astros | -0.85 | 2.81 | 327 |
| 17 | Aaron Slegers | Rays | -0.83 | 3.04 | 356 |
| 18 | John Means | Orioles | -0.78 | 5.60 | 660 |
| 19 | Brandon Woodruff | Brewers | -0.78 | 3.20 | 1,100 |
| 20 | Gerrit Cole | Yankees | -0.76 | 3.89 | 1,011 |
| 21 | Pete Fairbanks | Rays | -0.72 | 3.04 | 444 |
| 22 | Marco Gonzales | Mariners | -0.71 | 3.32 | 954 |
| 23 | Zack Wheeler | Phillies | -0.71 | 3.22 | 983 |
| 24 | Clayton Kershaw | Dodgers | -0.71 | 3.31 | 733 |
| 25 | Diego Castillo | Rays | -0.68 | 4.53 | 304 |
The “Deception Factor”
To isolate the “Deception Factor” of three metrics on different scales, I took a weighted average of their percentile rankings, with the weights determined based on how important they were to the model. The breakdown turned out as: .457 × Tunnel + .382 × PredMov + .162 × Unpred.
With a stricter pitch minimum, lets look at the top-15 pitch types in terms of overall deception.
| 2020 Top-15 Pitch Types by Overall Deception – min. 200 pitches | ||||||||
| Name | Pitch Type | Team | Mean Deception %ile | xRV %ile | xwOBA | Usage | Pitches | |
| 1 | Cy Sneed | Cutter | Astros | 87.9 | 96.3 | .327 | 69.6% | 266 |
| 2 | Carlos Carrasco | Changeup | Indians | 87.1 | 54.6 | .284 | 28.0% | 289 |
| 3 | Gerrit Cole | 4-Seam | Yankees | 86.7 | 92.2 | .305 | 52.8% | 539 |
| 4 | Andrew Heaney | 4-Seam | Angels | 86.0 | 90.1 | .335 | 57.8% | 566 |
| 5 | Ryan Weber | Sinker | Red Sox | 85.7 | 57.1 | .337 | 50.9% | 313 |
| 6 | Ty Buttrey | 4-Seam | Angels | 85.1 | 29.4 | .315 | 58.2% | 231 |
| 7 | Matt Barnes | 4-Seam | Red Sox | 84.2 | 12.0 | .337 | 54.1% | 223 |
| 8 | Aaron Nola | Knuckle-Curve | Phillies | 83.7 | 75.3 | .247 | 26.7% | 278 |
| 9 | Max Fried | 4-Seam | Braves | 82.9 | 33.2 | .280 | 41.8% | 352 |
| 10 | Trevor Rogers | 4-Seam | Marlins | 82.9 | 29.0 | .304 | 54.2% | 287 |
| 11 | Tejay Antone | Sinker | Reds | 82.4 | 27.2 | .353 | 40.6% | 232 |
| 12 | Triston McKenzie | 4-Seam | Indians | 81.8 | 22.0 | .285 | 53.1% | 261 |
| 13 | Blake Taylor | 4-Seam | Astros | 81.5 | 93.4 | .249 | 76.5% | 245 |
| 14 | Tyler Glasnow | 4-Seam | Rays | 80.5 | 92.1 | .330 | 60.6% | 527 |
| 15 | Zac Gallen | 4-Seam | D-Backs | 79.6 | 69.0 | .295 | 39.0% | 415 |
… and in terms of pitcher arsenals (weighted by usage):
| Top-15 Deceptive Arsenals – min. 500 pitches | ||||
| Name | Team | Mean Deception %ile | Pitches | |
| 1 | Andrew Heaney | Angels | 77.8 | 994 |
| 2 | Jon Gray | Rockies | 74.0 | 616 |
| 3 | Trevor Rogers | Marlins | 73.4 | 520 |
| 4 | Sean Manaea | Athletics | 73.0 | 763 |
| 5 | Triston McKenzie | Indians | 72.2 | 506 |
| 6 | Tyler Mahle | Reds | 71.7 | 776 |
| 7 | Asher Wojciechowski | Orioles | 70.6 | 635 |
| 8 | Ryan Weber | Red Sox | 69.6 | 608 |
| 9 | Zac Gallen | D-Backs | 69.6 | 1,053 |
| 10 | Griffin Canning | Angels | 68.8 | 888 |
| 11 | Max Fried | Braves | 68.5 | 827 |
| 12 | Tarik Skubal | Tigers | 68.1 | 530 |
| 13 | Austin Voth | Nationals | 68.1 | 821 |
| 14 | Gerrit Cole | Yankees | 67.7 | 1,011 |
| 15 | Mike Clevinger | Indians/Padres | 66.7 | 660 |
To revisit Liam Hendriks one final time—I initially made the assertion that his slider “undoubtedly plays off of his elite fastball” back in January just based on his results. As it turns out, Hendriks’ slider is in the 66th percentile of pitch tunneling, the 67th percentile of overall deception (74th percentile movement unexpectedness and 57th percentile unpredictability), and the 57th percentile of xRV which is eight percent better than what xRV 1.0 had it at. While not as elite as I originally predicted, his slider is still in the top third in overall deception. xRV 2.0 better tells the story of why Hendriks’ slider was so effective.
What’s interesting is that his curveball, the pitch that better mirrors his fastball’s spin and has more robust 70th percentile vertical movement, was the league’s best tunneled pitch in baseball in 2020 when the pitch minimum is dropped to only 25. It had a 60% whiff rate which was fifth best and also had a movement unexpectedness in the 84th percentile. xRV has it as a 78th percentile pitch, or -.456 xRV/100.
While his slider has been lethal over the past two seasons, there’s some evidence that his curveball should be used more often given its relationship with his fastball. The GIF below shows Hendriks’ second-best vertically breaking curveball of 2020 and correspondingly, his third-best tunneled curve when compared to his fastball profile (high vertical break, steep vertical approach angle) and where he typically locates it.
https://gfycat.com/aggressiveuncomfortabledutchshepherddog
That’s absolutely filthy.
Model Diagnostics
The new model returned a mere two percent RMSE improvement from version 1.0 which is sort of disappointing on the surface, but this effort has helped further explain what exactly is going on in the art of pitching I’ve been able to improve my estimation, but I can conclude that even with these additions, I can’t explain 100% of the residuals from xRV 1.0, nor is it realistic to try to. The model features I selected are clearly not perfect representations of stuff, command, and deception. There’s also some variation in the results within the game of baseball that are sometimes inexplicable.
From the Boruta library in R, I was able to determine the importance of each of the model’s attributes which helped me confirm my weights for the “Deception Factor” stat.
| Attribute Importance | |
|---|---|
| 1 | Spin Direction |
| 2 | Velocity |
| 3 | Vertical Movement |
| 4 | Total Tunnel |
| 5 | Vertical Location |
| 6 | Spin Rate |
| 7 | Horizontal Movement |
| 8 | Horizontal Location |
| 9 | Pred. Movement Diff |
| 10 | Fastball Dummy |
| 11 | Count Unpredictability |
| 12 | Pitcher Handedness Dummy |
| 13 | Hitter Handedness Dummy |
Moving forward, I plan to further interpret the implications of this model. For example, looking at how certain pitchers can better optimize their pitch locations based on pitch tunneling, or even expanding on the game theory application regarding pitcher unpredictability. Finally, there’s a certain way in which, stuff, command and deception play a role in pitching success, so figuring out that exact necessary trade-off in this three-dimension realm should be valuable.
For any further results of the model for a certain pitcher or any questions on my process, shoot me a mention or DM on Twitter @CoeSoxMetrics.
Photos from Icon Sportswire | Adapted by Doug Carlin (@Bdougals on Twitter)
