


There are few choices that get discussed more frequently, and more passionately, than the choices of bullpen management. Scrutinizing (read: usually disagreeing with) the pitching change decision-making of the manager of the local nine is perhaps only surpassed by complaints about the batting order among baseball followers.
Despite our relentless nit-picking, bullpen management has come a long way in the age of analytics. Most teams have moved away from the rigid, color-by-numbers approach of locking relievers into a prescribed inning or saving their “proven closer” only for save situations. Now, almost everyone is trying to deploy their best relievers in the highest leverage spots, even if those situations happen to come before the ninth inning.
Rob Arthur and Rian Watt, writing for FiveThirtyEight in 2016, showed how teams had gotten better over time at matching their relievers’ skill with the weight of the game situation. Arthur and Watt analyzed every full season from 1988 to 2015 by ranking relievers on each team by their run prevention numbers (earned run average (ERA), fielding independent pitching (FIP), and Baseball Prospectus’ deserved run average (DRA)) and comparing those with those relievers’ average leverage index when they entered the game.
Using Spearman’s Rank Correlation Coefficient, the writers evaluated how well those two indices tracked with each other over time. They found an increasingly strong relationship as the seasons progressed, suggesting that managers were getting better about using their strongest relievers in the toughest spots.

Credit: Rob Arthur and Rian Watt, FiveThirtyEight
Accessed from: Link
Arthur and Watt found in a follow-up piece that this kind of bullpen management was a repeatable, statistically significant managerial skill, albeit a weak one. A few veteran skippers who were graded in the analysis in 2016 – Bud Black, Bruce Bochy, Buck Showalter, and Dusty Baker – are still at it in dugouts today.
Writing in 2016, right near the advent of Statcast, Arthur and Watt were limited to using run prevention results as a proxy for reliever “skill.” We’ve come a long way since then. Thanks to the granular measurements of Statcast and the amazing work of folks like Eno Sarris, Max Bray, Harry Pavlidis, and Cameron Grove, we have Pitching+ and PitchingBot pitch quality metrics, and they are now publicly available on FanGraphs. Here at Pitcher List, thanks to the amazing work of Nick Pollack, Kyle Bland, and several others we have our own Pitch Level Value (PLV) metric.
These new stats help us move beyond using the output of a play to quantify pitch quality and toward using things that pitchers have more influence and direct control over, like pitch type, velocity, velocity differential, spin rate, spin efficiency, spin direction, location, movement, and release points. These measurements break down the process of throwing a pitch and enable us to more objectively measure the pitcher’s skill and the quality of their offerings.
Moreover, pitch quality is something that can be measured and analyzed outside of gameplay, such as in bullpen side sessions or in the pitch design lab in the offseason and spring training. As a result, we can think of these metrics more as leading indicators, especially relative to the more traditional stats based on on-field results. This means managers and front office teams have this data at their disposal without necessarily needing large samples of on-field results, and therefore have the opportunity to deploy their relievers more effectively right from the jump.
With that in mind, I thought it might be interesting to revisit Arthur and Watt’s approach using today’s pitch quality metrics. Which teams have done the best job deploying their relievers’ stuff according to the game situation?
Pitch Quality Metrics Correlation
Before we get too far into results, it’s worth taking a beat to talk about the predictive ability of these types of tools.
In the explainer about Pitching+, Owen McGrattan points out that before the season Pitching+ out-predicts any current projection system for relievers. In addition, all of these pitch quantifier metrics begin to stabilize with just a few hundred pitches. These measures correlate well with other common measures of reliever performance, like FIP, Win Probability Added (WPA), and the ever-powerful K-BB%, as you can see below:
Methodology
With those strong relationships in hand, we can turn our attention to following the lead of Arthur and Watt’s study. Pitching+, PitchingBot, and PLV metrics are publicly available beginning with the shortened 2020 season. I pulled together a data set of those three pitch quality data points by season for each reliever that was qualified in 2020 and each that threw at least 20 innings in 2021 or 2022. These filter points worked out so I had roughly 300 relievers per season or about ten per team.
From there, I followed the same steps as Arthur and Watt, calculating each pitcher’s rank on their team by the three pitch quality data points, and their average leverage index when the reliever entered the game (the gmLI stat on FanGraphs). I then used correlation analysis to compare those rankings.
For example, the Astros had seven pitchers meet the thresholds last season and you can see their PLV and leverage data, ranks, and analysis in the table below. I repeated this exercise for each team, season, and for each pitch quality metric.
League Level Results
The first question to explore from the analysis is how the league deployed its bullpen stuff by leverage. The chart below illustrates that for the three pitch quality measures and three seasons in our data sample:
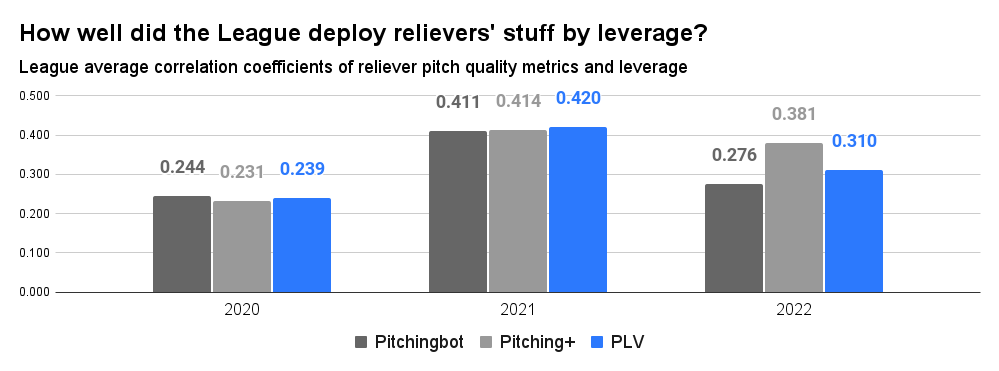
Data courtesy of FanGraphs and Pitcher List
In rough terms, the correlation coefficients are in the same range as those shown for ERA and FIP in Arthur and Watt’s plot shown earlier. Clearly, the 2020 season remains a challenging thing for data analysis. At first glance, 2022 looks like it was worse than 2021 for bullpen decision-making, but only time will tell if that’s part of a trend one way or the other, and with only two full season data points, is too early to tell if managers will continue the improvement trend found by Arthur and Watt.
Team Ranking 2020-2022
To assess how the teams stacked up, I took the correlation results for each pitch quality metric and aggregated them to come up with a composite ranking within each season. For example, in 2022, the Pirates’ correlations between the three pitch quality measures and average leverage ranked 9th (PitchingBot), 4th (Pitching+), and 1st (PLV) among the 30 teams.
Adding those ranks together equals 14, which was tied for the second lowest (best) aggregate rank with Houston. I repeated that exercise for each team and each season from 2020-2022 which you can see in the table below:
Perhaps not surprisingly, we find some of the teams that we typically think of as on the leading edge of innovation and analytics at the top of the list. Not only are the World Champion Astros leading the way in terms of matching their best reliever stuff with the highest leverage opportunities, but they also did so the most consistently across the three years in the sample.
Interestingly enough, Houston manager Dusty Baker was one of the managers that scored very poorly in Arthur and Watt’s study in 2016. Then, as Baker had managed the Giants, Cubs, and Reds in their study’s timeframe, Baker graded out as the fourth-worst bullpen manager. It seems that working with Houston’s analytically-oriented front office has helped him modernize his approach.
Seeing the Mets, Padres, Rays, and Yankees near the top of this list also seems to track well with our general understanding of how those clubs tend to operate. That said, Buck Showalter might be a bit of the opposite case from Baker. Showalter famously left then-Orioles closer Zack Britton in the ‘pen in a 2016 extra-inning playoff game and scored more in the middle of the pack of the 2016 study. Here, the Mets led baseball by our correlation measure in 2020 and 2021 but dropped to 10th last season after Showalter took the helm of the New York dugout.
Rockies manager Bud Black was among the best-graded bullpen managers back in the 2016 study and it’s interesting to see Colorado rank among the top ten in my update, despite the fact that they’ve had an average (at best) bullpen the past three seasons.
Seeing the Tigers, Phillies, Rangers, Royals, and Diamondbacks in that section of the results also seems to pass the sniff test. It was a little surprising to see the Orioles down at the bottom, as their new front office is thought to be pretty analytic given its Houston pedigree.
Here though it’s worth re-emphasizing that management decision-making is not everything when it comes to this analysis. Sometimes a team could rank lower in this kind of analysis because it does not have clear high- and low-leverage relievers to consistently turn to.
That is perhaps exemplified best by Oakland. You can see in the table that they scored quite well in 2020 when they had Liam Hendriks, Jake Diekman, and Joakim Soria at the back end of their pen. Fast forward to the 2021 and 2022 rebuilding campaigns that did not have strong options in the bullpen and you can see they struggled to line up relievers to situations.
As with any other baseball analysis, the answers are not likely to be clear-cut and isolated to any specific variable. That’s the beauty of this game. Nonetheless, it largely seems that the teams we might expect are out in front in bullpen management and it will be interesting to see how this progresses over the next several seasons.
Thanks to Kyle Bland for data assistance. Photo by David J. Griffin/Icon Sportswire and Mike Meyers/Unsplash | Featured Image by Ethan Kaplan (@DJFreddie10 on Twitter and @EthanMKaplanImages on Instagram)
