


A couple of weeks ago, my Pitcher List colleague Casey Drottar examined Twins right-hander Kenta Maeda’s struggles last season. After Maeda challenged for the AL Cy Young in his first season in Minnesota, he suffered through a Murphy’s Law kind of season last year, battling a nagging groin injury and inconsistent performance on the way to a 4.66 ERA in 106.1 innings before the big blow – a major elbow injury that required reconstructive surgery – ended his season early. Now, Maeda is expected to miss the majority of the 2022 season.
Given that Maeda is unlikely to be much of a factor this season, it might seem odd for us to be analyzing him twice in the course of a month. However, like a lot of good baseball writing, Casey’s piece, which focused on Maeda’s fastball, got me thinking.
It has been well documented, including by Cole Bailey here at Pitcher List, that much of Maeda’s stellar 2020 campaign was enabled by a significant pitch mix adjustment that saw him feature his slider (38.7% usage) and split-changeup (29.3%) more often than his fastballs (28.5% four-seamer, sinker, cutter combined) and more often than he had previously with the Dodgers.
Pitch-level performance data backed up this adjustment. By Statcast’s run values, Maeda’s slider had long been his best-performing pitch, generating above-average results each season since 2017. Pitchers throwing their best pitches more often has been the rage in recent seasons, Maeda jumped right on board that trend and had his best season as a starting pitcher to date.
But, as Casey noted, he reverted back to relying more heavily on his fastball last season, especially when he fell behind in the count:
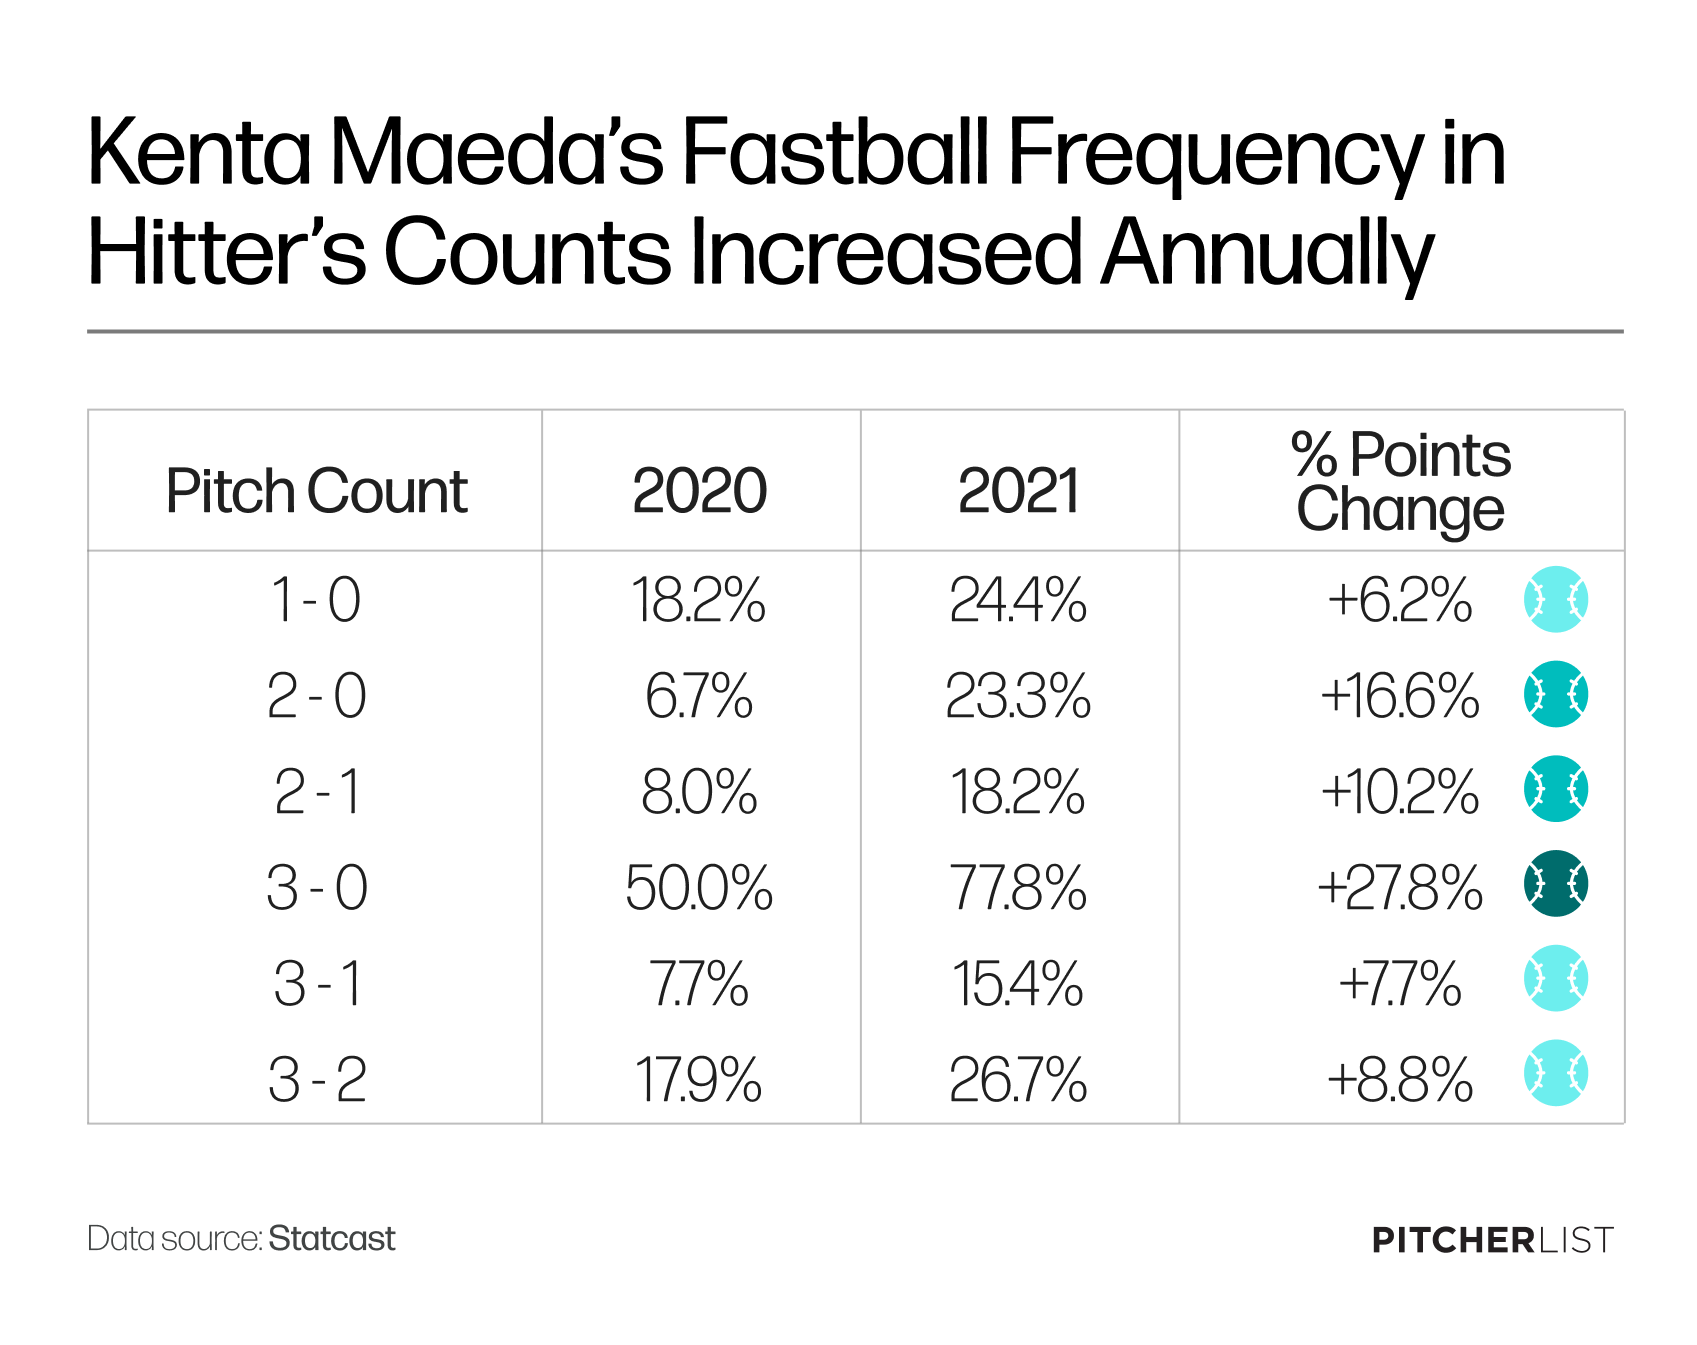
Created by @visual_endgame on Twitter.
My question is why? The Twins have been one of the most breaking ball reliant organizations the past couple of seasons, including when their pitchers are behind in the count. Maeda’s pitch level performance data from his excellent 2020 shows that his fastballs performed better when he was throwing them less often. Given their general philosophy, it seems unlikely the Twins would take that new data point to mean he should return to his previous ways and rely more heavily on the fastballs again. Doing so would run counter to their organizational strategy and the plan they had for Maeda when they targeted him in trade. To me, it seems obvious that something else had to have been going on. But what?
Working Ahead
I decided to start by looking at his overall ability to throw strikes and work ahead in the count. In general, pitchers command their fastballs best and we saw above that Maeda went to his fastball more frequently when behind last season. Perhaps he was experiencing poorer command of his breaking and offspeed pitches, causing him to get in unfavorable counts where he really needed to throw quality strikes?
Confoundingly, Maeda threw more pitches in the strike zone last season (zone rate 45.2%) than he did in 2020 (43.8%). At the same time, though, Maeda fell behind in the count to begin at-bats more frequently than he ever had before last season. His 2021 first-pitch strike rate was just 59.8%, down from 64.5% the season prior, and a fair bit below his 62.9% career average.
Due in part to that, Maeda threw the lowest percentage of pitches while he was ahead in the count (28.3%) and the highest percentage of pitches while he was behind in the count (27.4%) of his career. In both cases, those rates were about three percentage points worse than they were the season before.
We know that Maeda turned to his fastballs more often when he was behind. I was curious if he also chose to work more with his fastball to begin counts, which might indicate a strategic change instead of one of circumstance.
The table below shows which pitch types Maeda selected in 0-0 counts for the past two seasons:
In general, Maeda operated pretty similarly to start-off plate appearances last season. During his two years as a Twin, he’s thrown a first-pitch other than a fastball 55-56% of the time about half of those have been sliders.
This suggests that, at least in terms of his strategy to start off a batter, he had the same approach last year.
We already know he didn’t throw as many first-pitch strikes last season, so he must not have executed that approach as well as he did in 2020. If we broadly assume that a pitcher intends to throw a strike on the first pitch of the at-bat, looking at called ball rates in 0-0 counts might be informative for understanding if a pitcher is struggling to execute a preferred strategy.
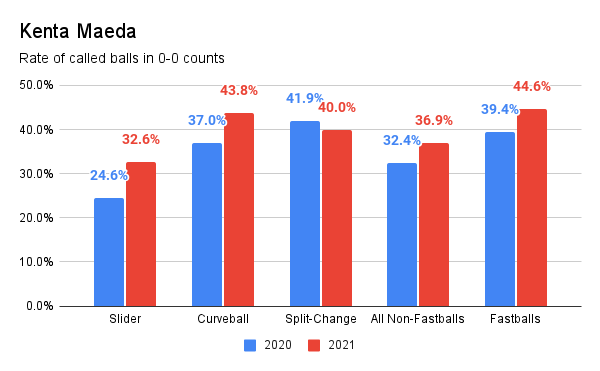
Data from Statcast
That data is pretty telling. Maeda’s rates of called balls on first pitches were noticeably up on all his pitch types, save for his split-changeup. That was especially true on the sliders he most often used to start off counts, which increased eight percentage points from 2020.
Slider Command
If Maeda was having trouble executing his slider the way he wanted that could have led him to return to his fastballs once he fell behind in the count. After all, you wouldn’t blame a pitcher for going to another pitch after frequently missing like this on 0-0:
To be fair to Maeda, I am cherry-picking illustrative examples there. All pitchers will have the occasional misfire that results in pitch locations like those in the video above. However, you can see in Maeda’s body language after some of those pitches that he’s frustrated with his slider command.
His overall pitch location data backs up the idea that he had reason to be. Relative to 2020, Maeda’s slider locations were much more variable last season.
You can see he sprayed his slider over a larger range of locations than he had previously. More of them ended up well off the plate to his glove side or were left unfinished up and to his arm side than in 2020 when he did a better job of more tightly spotting them on the edge down and to his glove side.
I should note that evaluating command is still a tricky proposition because of our lack of data about location intent and the sample sizes with the two seasons are different. Maeda threw 270 more sliders last season than he did in the shortened 2020 season, which could be skewing the visuals. As a way to test if his command of the pitch was truly more variable last season, I ran the summary statistics of the detailed pitch by pitch location data available from Statcast and calculated the standard deviations of the plate location data of Maeda’s sliders as a crude measure for evaluating if his command was as sharp as it had been:
Last season, the standard deviations of both the X and Z plate locations of his sliders were noticeably greater than they had been in 2020 and the F-tests show the differences between them are statistically significant. This supports, as the maps indicated, that he located his slider less consistently last season.
Pitch Movement and Release Points
One potential explanation for Maeda’s difficulty spotting his slider is a noticeable change in the pitch’s movement profile. On average, Maeda got about two more inches of vertical movement (35.5 inches with gravity vs. 33.4 inches) and two more inches of horizontal movement (5.2 inches vs. 3.2 inches) on his slider last year than the season before.
Perhaps more impactful than just having more movement was that the additional horizontal movement was quite variable, ranging from just an inch or two to eight or nine inches, from outing to outing:
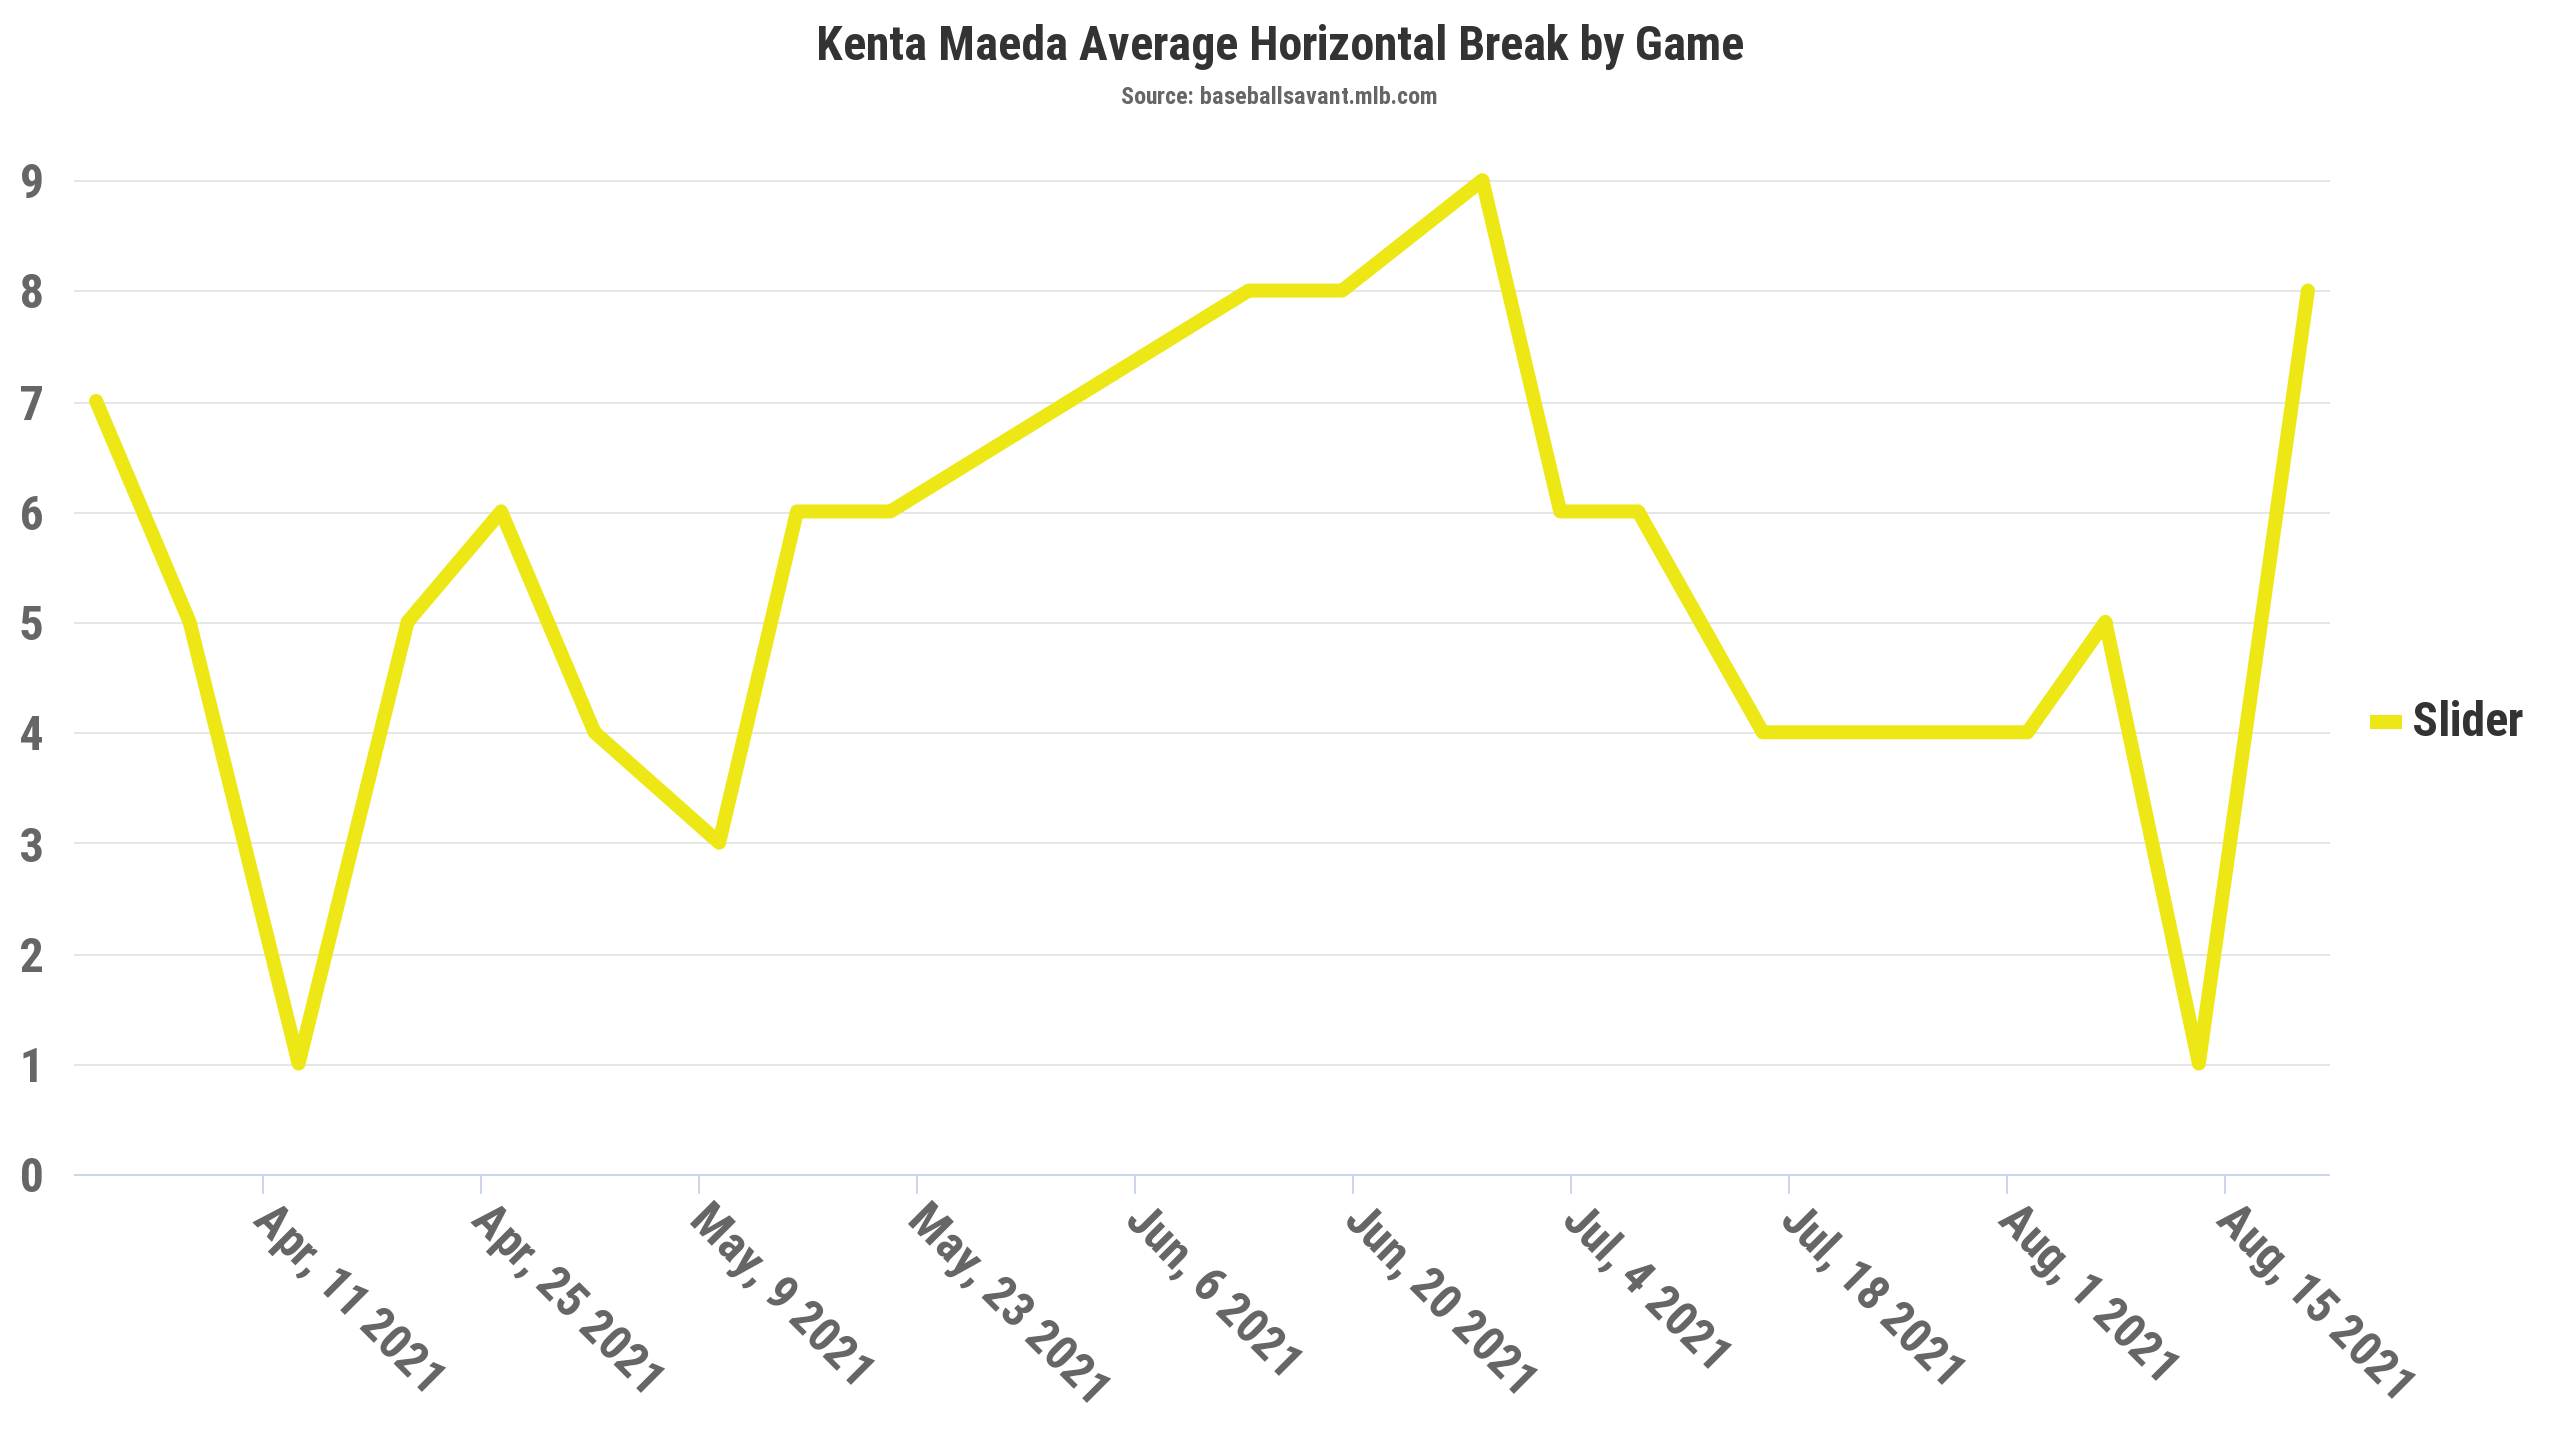
Data from Statcast
Some variation from game to game is natural and expected, but this variability seems high. Seemingly every time he threw his slider he got a different break. Given that, it’s no wonder he had difficulty consistently locating it where he wanted.
Here it’s worth mentioning that Maeda pitched through a nagging groin injury in early May for a couple of turns before spending three weeks on the injured list into June. It’s hard to know for sure how much weight to put into the injury affecting his ability to throw his pitches the way he wanted, but he admitted that it caused him to alter his mechanics. The data makes it seem reasonable that it had some negative effects.
The additional horizontal movement may also explain why he shifted his starting place on the pitching rubber toward third base mid-season (which Casey noted). That is a logical adjustment to make if he was getting more horizontal break and missing off the plate to his glove side more frequently than he wanted. (It’s also one the Twins had done in a similar situation with José Berríos a season earlier).
In the end, all of this makes for a plausible explanation for why Maeda went away from his slider-heavy plan and turned back to his fastball, especially in hitter’s counts. Given this data, that change seems to be the result of an inability to execute rather than a deliberate, strategic choice to feature his fastball. In any event, when he does return to the mound at Target Field, how he commands his slider will be a key thing to watch.
Photos by Icon Sportswire | Adapted by Doug Carlin (@Bdougals on Twitter) | Fastball Frequency Data Visualization created by @visual_endgame on Twitter.