


A while back, I was a guest on the Circling the Bases podcast with NBC Sports Edge’s D.J. Short and Drew Silva and I joked a little bit about doing a deep dive on hit-by-pitch trends cause, you know, we’ve all gotta do something with our time, right?
Little did I know that there’s actually been a pretty bizarre trend in hit-by-pitches over the last decade. Specifically, batters are getting clunked a lot, and they’ve been getting hit more and more in a pretty steady trend since around 2012.
Take a look:

Created by @visual_endgame on Twitter
There’s an extremely clear trend here, so I decided to take a dive into exactly why we’re seeing hitters get hit by pitches so much more than before. I’m not the first person to do this or to notice this trend, by the way. Back in 2019, The Athletic’s Eno Sarris wrote about this trend and noted a few factors that could be contributing to the rise in hit batters. Specifically:
- More breaking balls are being thrown than before
- Pitches are moving differently than they did before
- Fastballs aren’t being used in hitter’s counts like they used to
- There are more pitches being thrown up and in
He also mentioned the new ball at the time might have something to do with it, and it might have, though he’s able to quantify that better than I can. Plus, the ball has changed a bit even since 2019, and we’re still seeing the trend.
But I decided to dive a bit into these points he raised and expand upon them a bit to see if they can explain this really weird trend. So let’s dive in.
Everyone’s Getting Hit by Breaking Balls and Offspeed Pitches
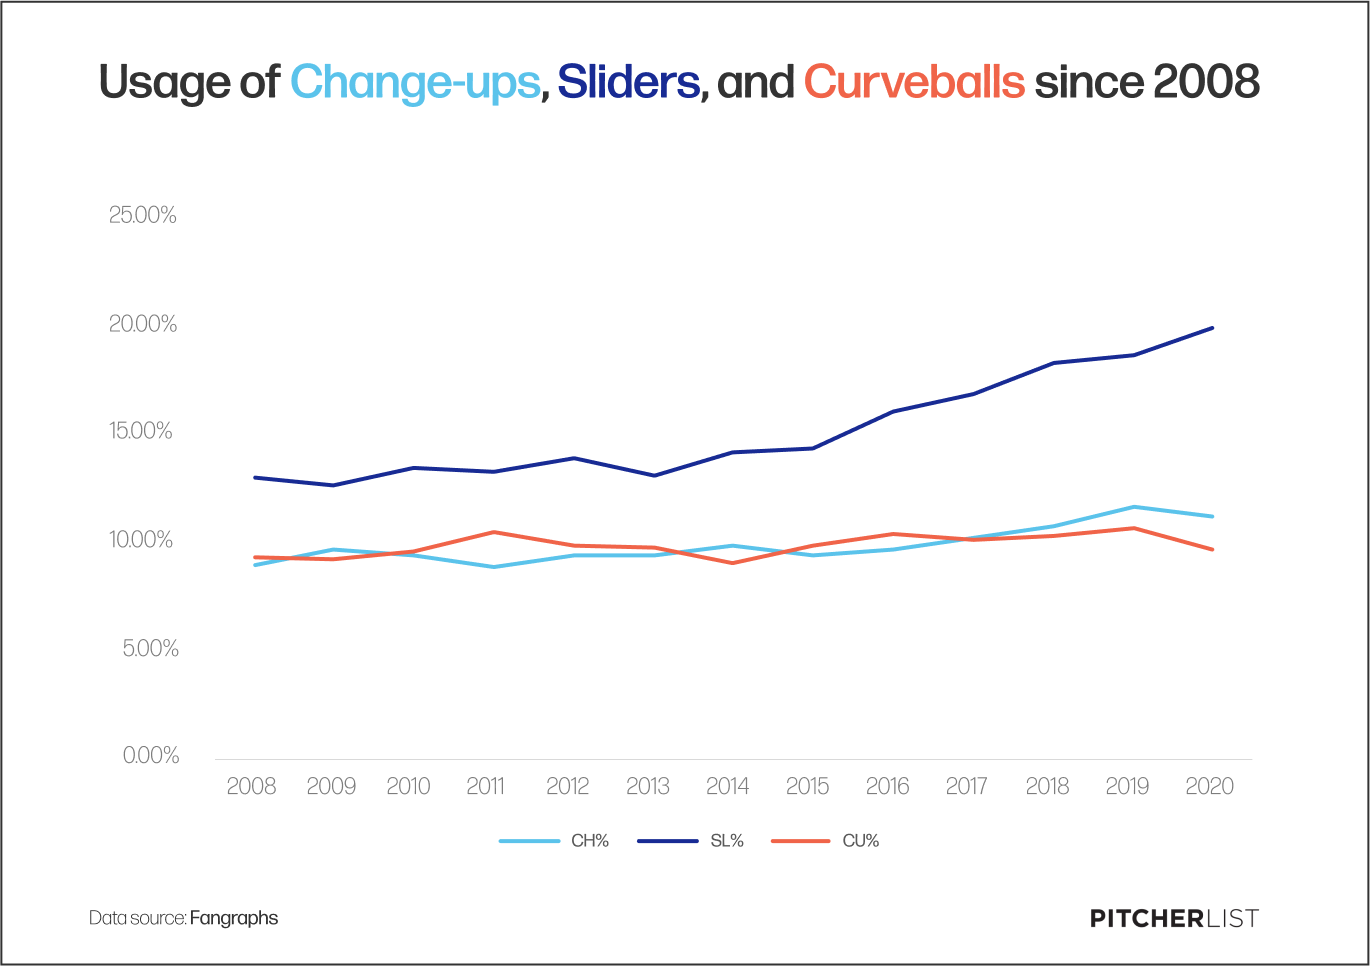
Sarris is 100% correct when he says that breaking balls are more common than ever before (not that I ever doubted him). Take a look at breaking ball and offspeed pitch trends since 2008:
Created by @visual_endgame on Twitter
Slider usage jumped from 12.3% to 19.9% last year, curveball usage jumped from 8.6% to 10.7% in 2020 (and then dropped to 9.7% last year), and changeups increased from 9.1% to 11.2% last year. On the whole, per Statcast, breaking ball usage has increased from 22.7% of all pitches thrown in 2008 to 29.5% of all pitches thrown last year.
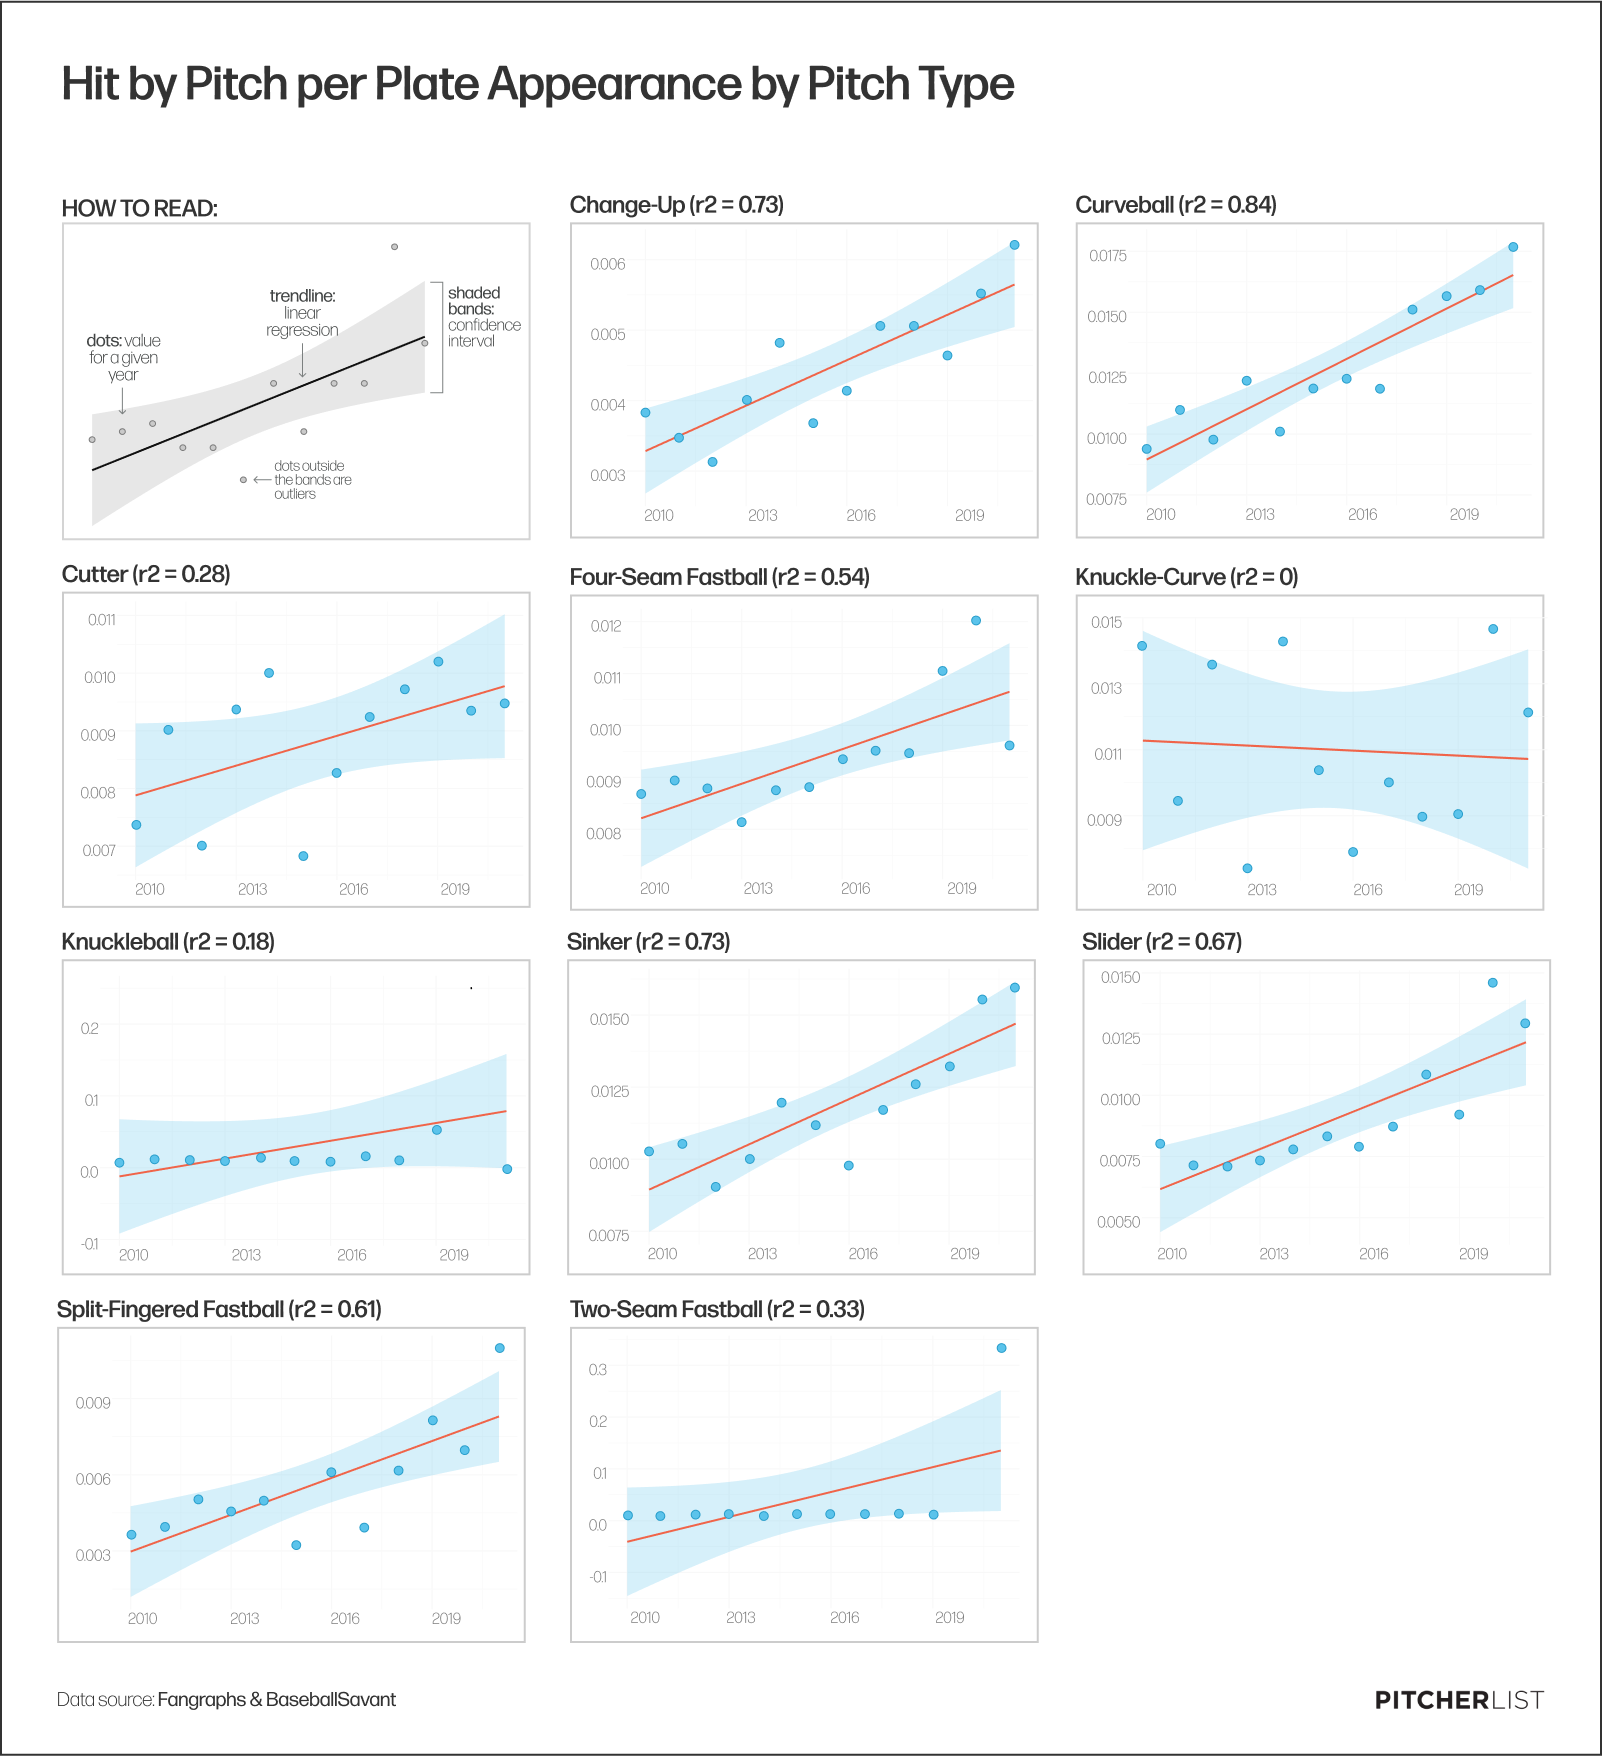
And if you take a look at HBPs per plate appearance since 2010 broken down by pitch type, you’ll see a pretty similar trend when it comes to sliders, changeups, and curveballs:
Created by @visual_endgame on Twitter
The trend in HBPs among changeups is fairly modest, but the trend among curveballs and sliders is a lot more pronounced. So the answer is yes, people are throwing breaking balls more than they have before, and they’re also hitting batters with those breaking balls (and also changeups to an extent) more than they ever have before.
Breaking Balls Are Being Used Differently Than They Were Before
We’re also seeing breaking balls used in different ways than we have in the past in a couple of ways. In part, the rise in breaking ball usage can be attributed to pitchers not being afraid to use breaking balls in situations where they “traditionally” wouldn’t. Specifically, when a hitter is ahead in the count.
In 2008, 13.9% of the time a pitcher threw a breaking ball in a hitters count. That number has steadily risen since then, jumping to 18.8% a decade later and hitting 21.3% last year.
On top of that, we’re seeing a rise of breaking balls being used in 0-0 counts. In 2008, pitchers threw a breaking ball in an 0-0 count 20.8% of the time. That’s also steadily risen and jumped to 30% of the time last year.
And as Sarris mentioned, we’ve seen more pitches being thrown up and in over time, but it’s not just the high and tight pitches that are becoming more common—it’s inside pitches in general.

Created by @visual_endgame on Twitter
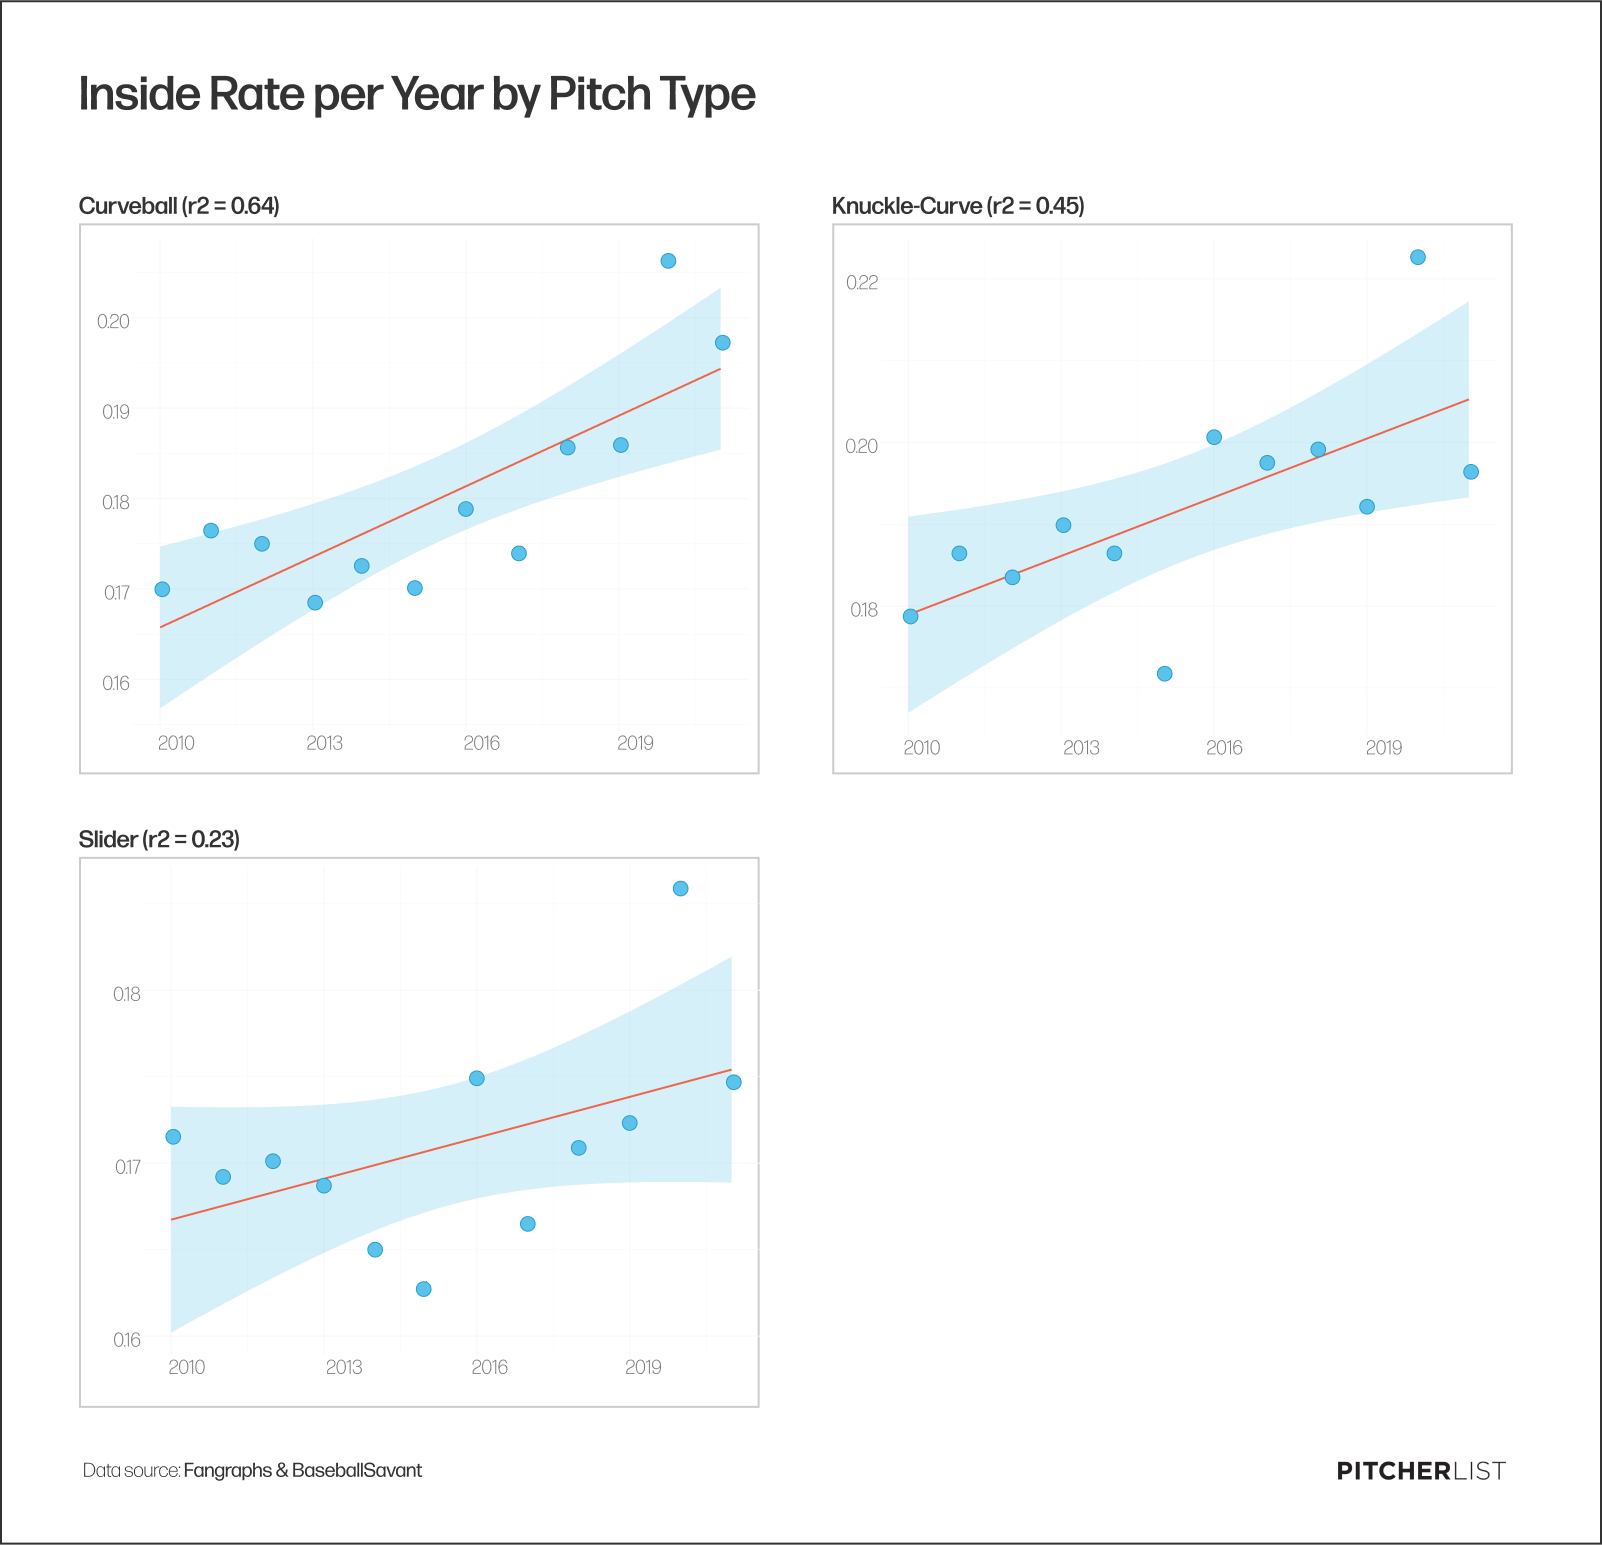
Since 2010, there’s been a pretty steady trend of inside pitches rising year after year. And not just any inside pitches, you guessed it, breaking balls:
Created by @visual_endgame on Twitter
Curveballs (both regular curveballs and knuckle curves) and sliders are being thrown inside more and more over the years, and when you’re throwing a pitch that moves and is harder to control inside, guess what’s going to happen? You’re going to hit batters more often.
Breaking Balls Are Moving Differently Than They Have Before
So we’ve established that breaking balls are being used differently as a whole, and more pertinent to the point of increased hit batters, breaking balls are being thrown inside more than ever before.
As I mentioned, breaking balls are generally harder to control than fastballs, I don’t think I’m breaking any new ground by saying that. And in general, if you’re throwing a higher quantity of those balls inside, you’re going to hit more batters. But when those breaking balls are also moving differently than they have before, specifically more horizontally, you’re going to see even more hit batters.
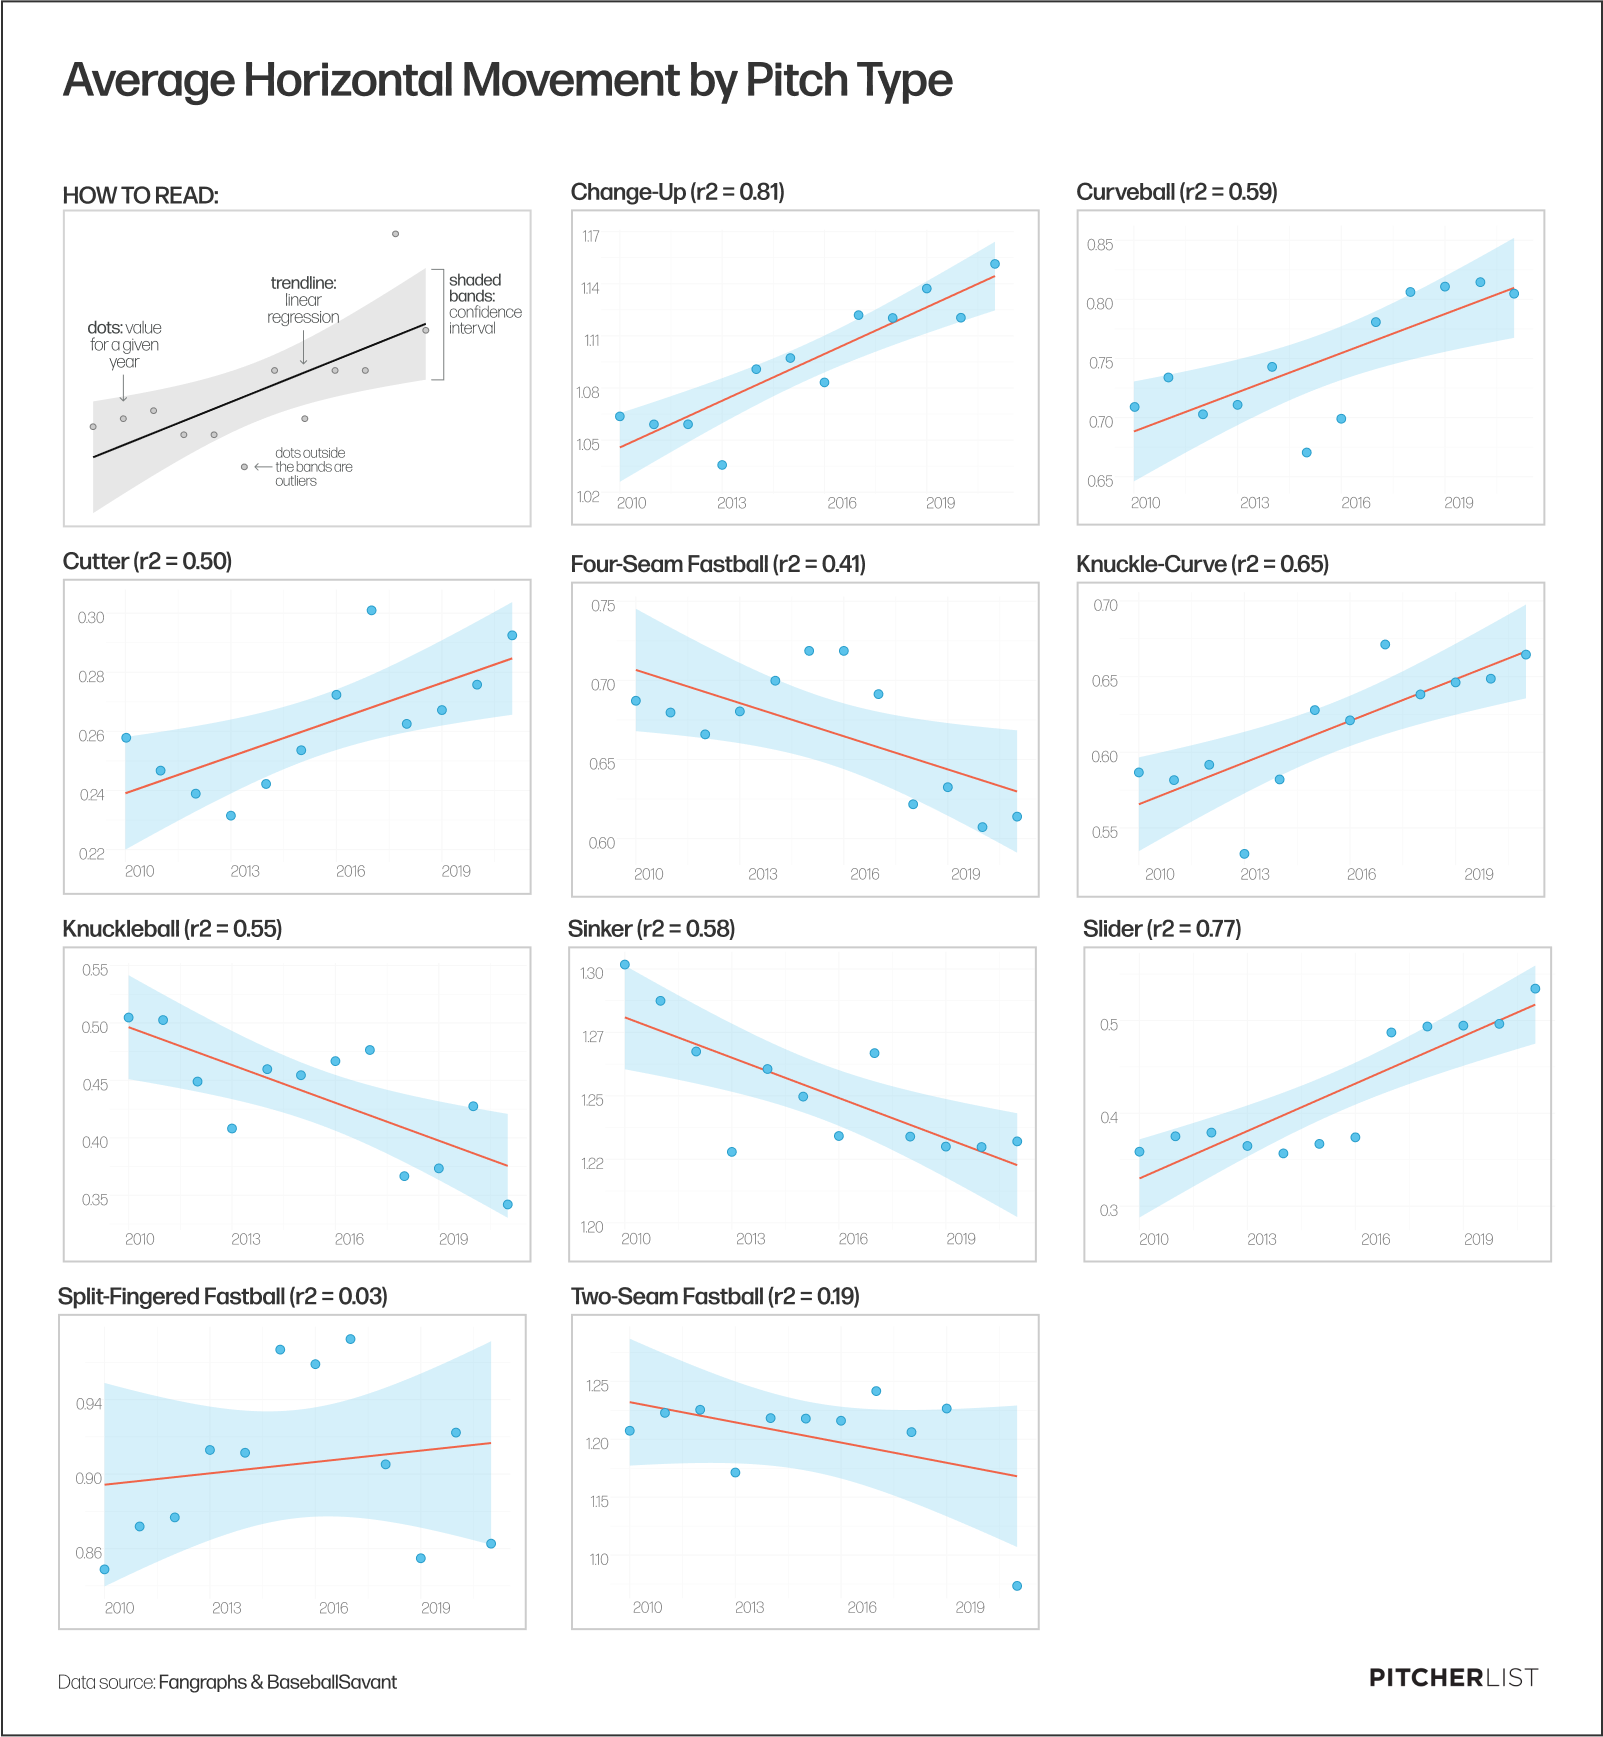
Take a look at how horizontal movement has changed in breaking balls and changeups over the years:
Created by @visual_endgame on Twitter
Curveballs, sliders, and even changeups are moving horizontally more than they ever have. And we’re seeing pitchers throwing breaking balls outside of the zone more than they have in the past. In 2008, pitchers threw breaking balls outside of the zone 24.6% of the time, a number that increased to 32.4% last year.
Conclusion
So to sum this sort of shotgun, scattershot series of data points up, why are hitters getting hit by pitches more and more each year?
Well, take a look at the following points we’ve covered:
- Breaking balls are being thrown more often
- Breaking balls are also being thrown inside more often than they have before
- Breaking balls are being thrown outside of the strike zone more often
- Breaking balls have more horizontal movement (i.e. more potential movement towards a hitter) than they have before
If you add up all of those factors, I think it’s pretty clear why hitters are getting clunked by pitches more and more each year. As pitching approaches change and more pitchers lean on their breaking pitches more frequently than their fastballs, and as pitchers are able to make those pitches dance around and move more than before, we’re also seeing hitters getting popped more often.
So in other words, it’s not looking like this trend is going to end any time soon.
Oh and complete aside, in case you were curious, the batter who’s been hit by the most pitches over the past 10 years? It’s Anthony Rizzo by a pretty good margin with 178 HBPs ahead of Starling Marte with 133.
(Photo by Icon Sportswire) Adapted by Shawn Palmer (@PalmerDesigns_ on twitter)
On HBPs:
Yes. Pitchers are being more aggressive inside
Yes, Sliders are becoming dominant and more Horizonte-laterally, crowding batters
However, you have ignored the velocity over control-command trend in pitching. It seems to me that as velocity has increased, pitchers’ control and ability to put the ball at a. Intended pout has decreased.
Young pitchers especially are being taught-groomed to be about velocity, not concerned with command or what is being called “pitchability.” Perhaps comparing the pitch velocity and HBP stats would reveal another, perhaps more significant factors in HBP INJURIES.
THe BEST PITCHERS in my mind are those who can use different speeds, have multiple pitches they can command and then rains to execute a sequence effectively, rather than 100mph “Wild Thing” guys who have clue where the ball ends up.
Have you considered scaling the graphs to show identical Y axes, or use some sort of standardizing or normalizing of the data before graphing? You spoke on HBP per plate by pitch type that sliders increased much more than change up, but at a glance the slope on the graphs is almost identical. I see this is because the y axis has been adjusted so that each graph is equivalent in size, but it distorts the data when it comes to comparing the rate of change between the two, in a way it forces the viewer to revert to making a comparison between raw data (comparing the scales of the y axis). I can understand not wanting a mish mash of huge and tiny plots and trendlines in the graphic, so maybe a zscore with a note on the calculation and it’s purpose, would help with the scaling and still preserve the visual impact. Really well written article.