


A Quick Introduction
Welcome to the PLV Primer, where I’ll go fully in-depth on our new metric, PLV – Pitch Level Value. It’s a new tool to shift how we look at baseball events by quantifying the pitch thrown and to grasp its importance, we have to first look at the makeup of a baseball event.
A pitch is thrown, a batter makes a decision, contact is made, a ball gets hit into play, and an out is recorded. This is the traditional timeline of a baseball event and how we’ve quantified them has felt so wrong to me over the years.
There are five different moments in the process of that event – Pitch, Hitter, Contact, Ball In Play, and Event – and yet most of the analysis available to us is solely on the latter three.
Initially, we just had the event. He’s good because he hits homeruns or strikeouts out a lot of batters!
Then we had sabermetrics show up and take us back a step, looking at how the event is made – via a ball in play or without contact. He’s good because he has a high flyball rate or a great walk rate!
Statcast is a wonderful thing that introduced more granular data to these events, including the quality of the contact involved. He’s good because he has a high exit velocity or constantly has a perfect launch angle!
But what if we had stats just on the pitch thrown? Instead of using the output to quantify an event, we could use its input and paint a clearer picture of what should have transpired. The hitter is reacting to a specific pitch, they are able (or not able) to make contact, the ball is put into play, and we watch the event unfold. If the pitch were a meatball or a perfect fastball on the corner, it would give a new perspective on the outcome. Maybe the hitter did a great job hitting a tough pitch or maybe they should have swatted that ball into the outfield. PLV gives us that answer.
I set out with the PL team to answer this question at the end of 2019. We worked through many different formulas, ways to frame a quantifier, prediction models, and weights to settle on the model we have now to create PLV.
Huge thanks to everyone involved across the years: Kyle Bland, Colin Charles, Cameron Grove, Jeff Nicholas, Zach Dobroff, Richard Dzeng, Ike Wade, and many others. This is very much the product of their brilliant minds coming together, with Kyle Bland taking the reins in 2022 and driving this home.
What is PLV?
PLV – Pitcher Level Value – is a pitch quantifier, not unlike Eno Sarris’ Pitching+ and Cameron Grove’s Pitching Bot. In incredibly simple terms, we look at many granular variables of a pitch (release point, count, pitcher/batter handedness, velocity, movement, location, etc.), shove it into a machine-learning prediction model, and based on what we’ve seen across 2020-2022, we can give an overall 0-10 score to say “this was a good pitch or a bad pitch.”
This is quite the loaded sentence and if you’d rather relax and watch a presentation about the creation of this, here are a pair of hour-long videos during our PitchCon event in January, including our Director of Research and Analytics Kyle Bland walking you through all the steps of PLV:
If that’s enough for you, skip the next section and go straight to the charts and tables. For those who want to understand how this is made and need verification that we’re not just making things up, this next section is for you.
Give Me The Technical Stuff
Please forgive me for utilizing plenty of Kyle Bland’s slides from the PitchCon presentation, but I couldn’t resist as he did a fantastic job outlining the process in a simple way.
First, we collect Stuff, Location, and Categorical data:
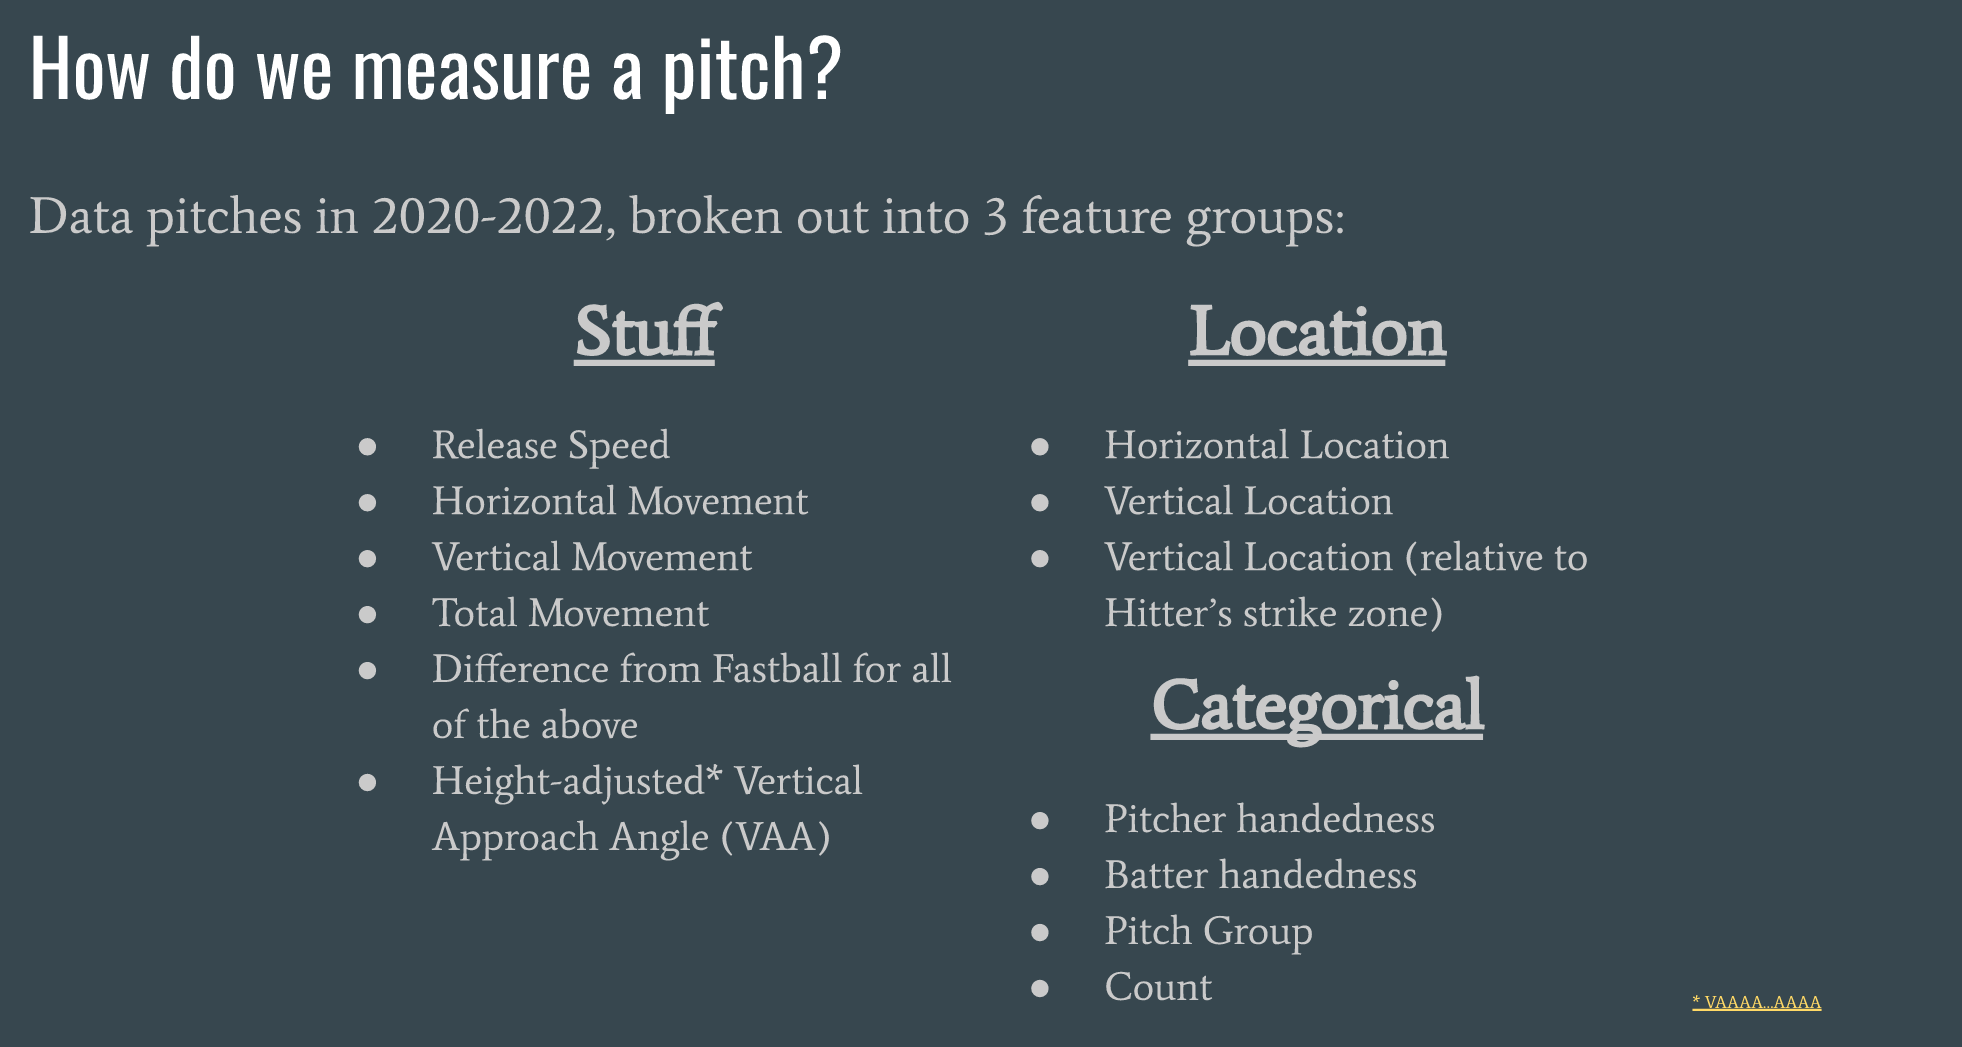
We explored other variables to utilize in the model, but context elements such as previous pitches, baserunners, and game states were removed as they pulled us away from the raw question of “how good was this pitch.” (Quantifiers like pVal and RAA utilize these factors and in my view, take away from the pitch itself in favor of the result – those metrics are event quantifiers, not pitch quantifiers!).
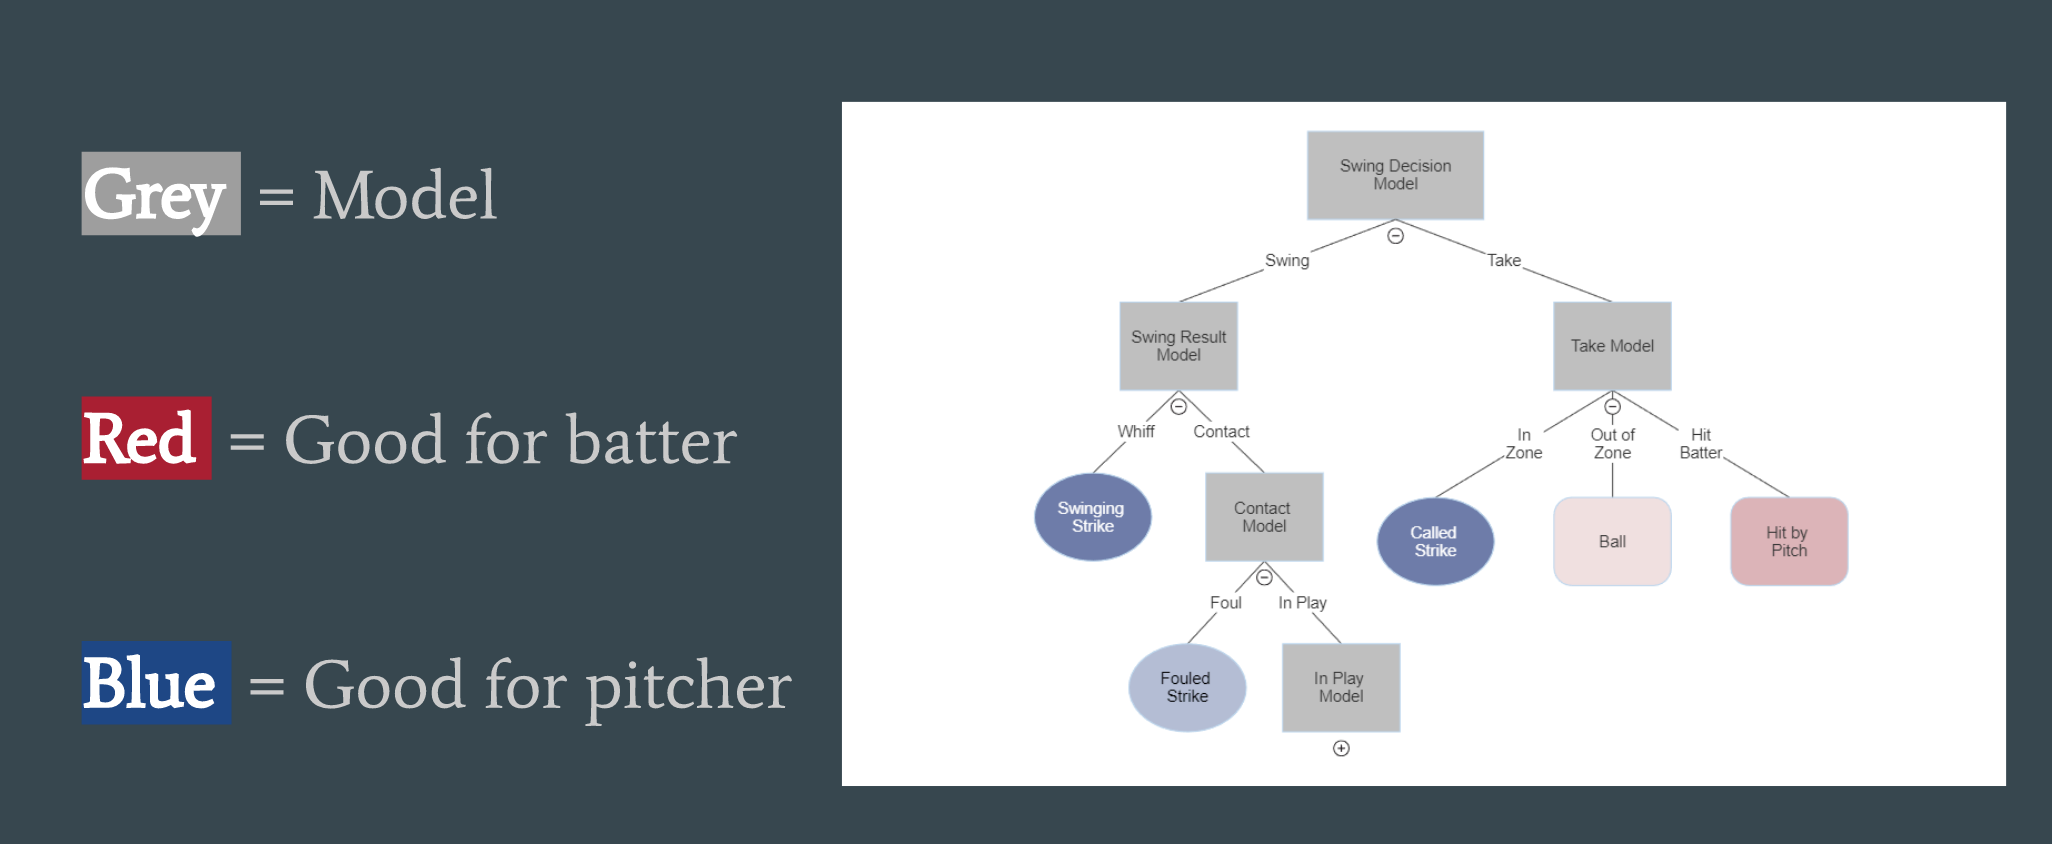
From there, we shove it all into a series of models to collect probabilities of events:
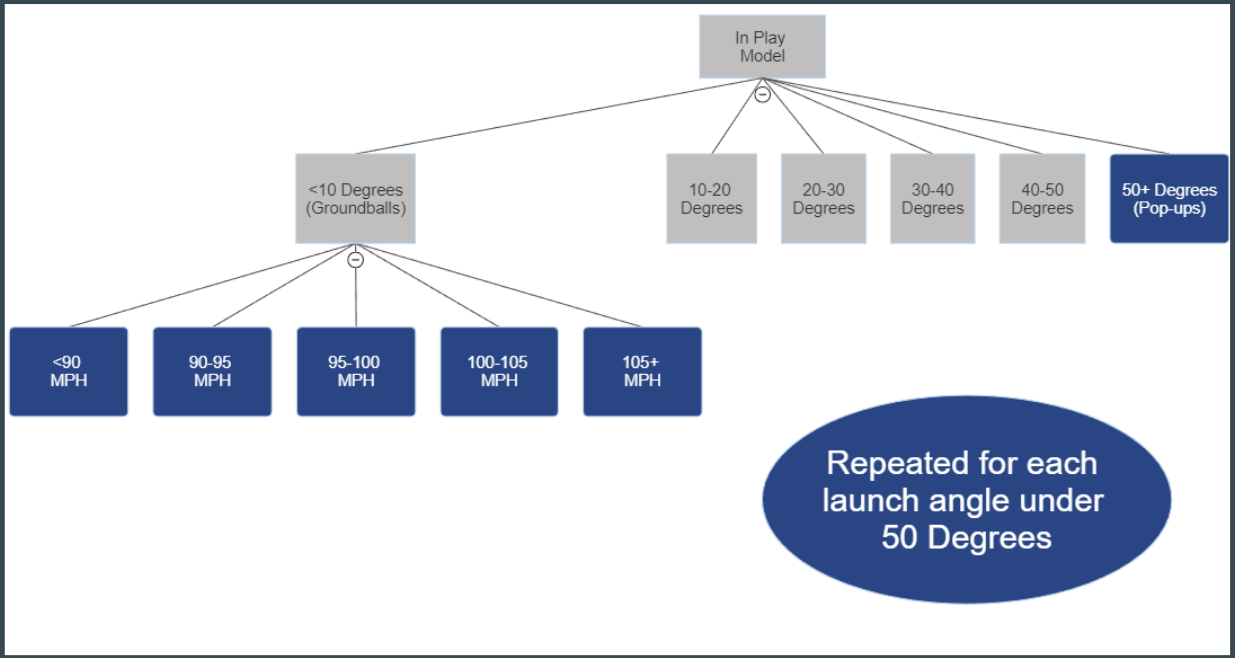
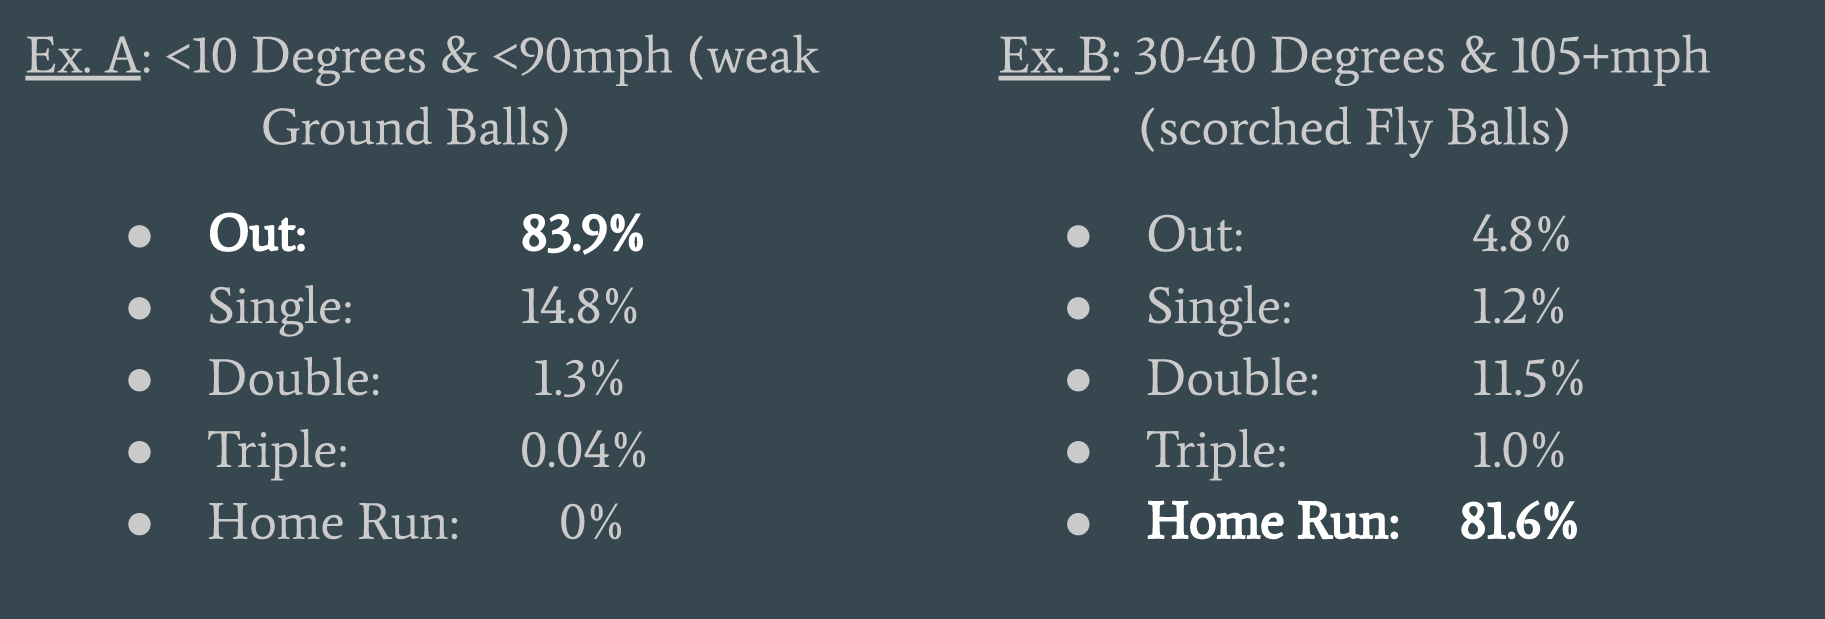
And for balls that are in play, we elected to bucket events into both launch angle and exit velocity buckets. These buckets have a league-average distribution of Out/Single/Double/Triple/Home Run applied them:
It’s a decision tree where at every point, we assign a probability of the outcome. For example, it could be a 70% chance of a swing, then 50% of contact, then 45% chance of the ball in play, and so on.
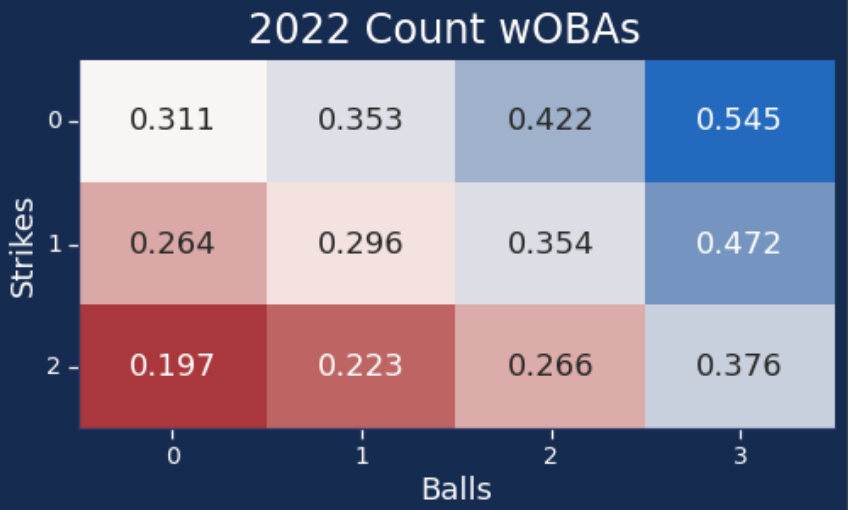
Each of these final events (Swinging strike, fouled strikes, ball, hit by pitch, 90-95 mph EV + 20-30 LA, etc.) has a wOBA value assigned to them. We smash all the probabilities together to get a predicted wOBA value and then compare that value to the wOBA value before the pitch. For example, let’s say it’s a 0-0 count and we’re looking at the first pitch Max Scherzer throws. 0-0 counts had a universal expected wOBA of 0.311 in 2022. Scherzer throws an excellent slider over the plate for a called strike. Our model runs through the probabilities of that pitch, and grants a wOBA value based on the expected new situation – a single, a called strike, a ball, etc. We then take that expected wOBA and subtract it from the previous state’s wOBA (here, .311), to essentially say “this is the wOBA difference based on the quality of pitch.” We then convert that wOBA difference into a run value, and voila! That’s the PLV of the pitch.
If you’re wondering how we create a run value, here’s a breakdown from Kyle’s slides once again:
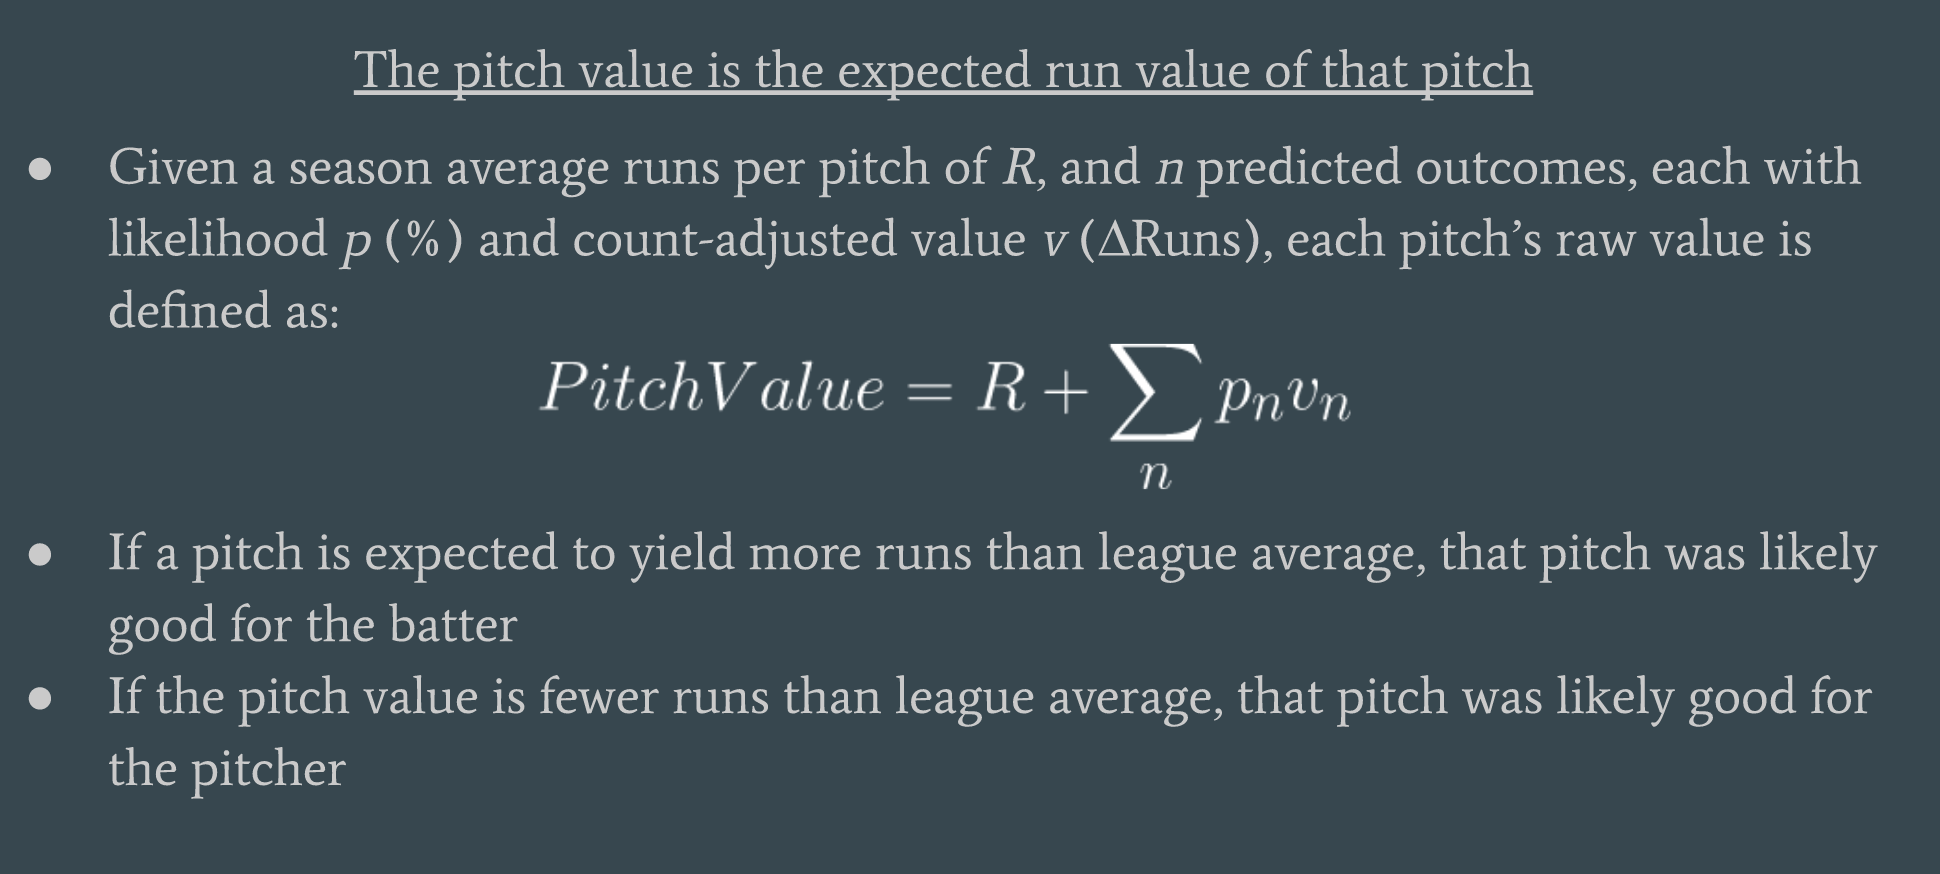
In the simplest of terms, we look at the average wOBA for any count, determine if this pitch should perform better or worse than that average wOBA, then assign a value based on that difference. “Did this pitch put the pitcher in a better or worse situation?” We call that value PLV – Pitch Level Value.
Correlations and Stabilizations
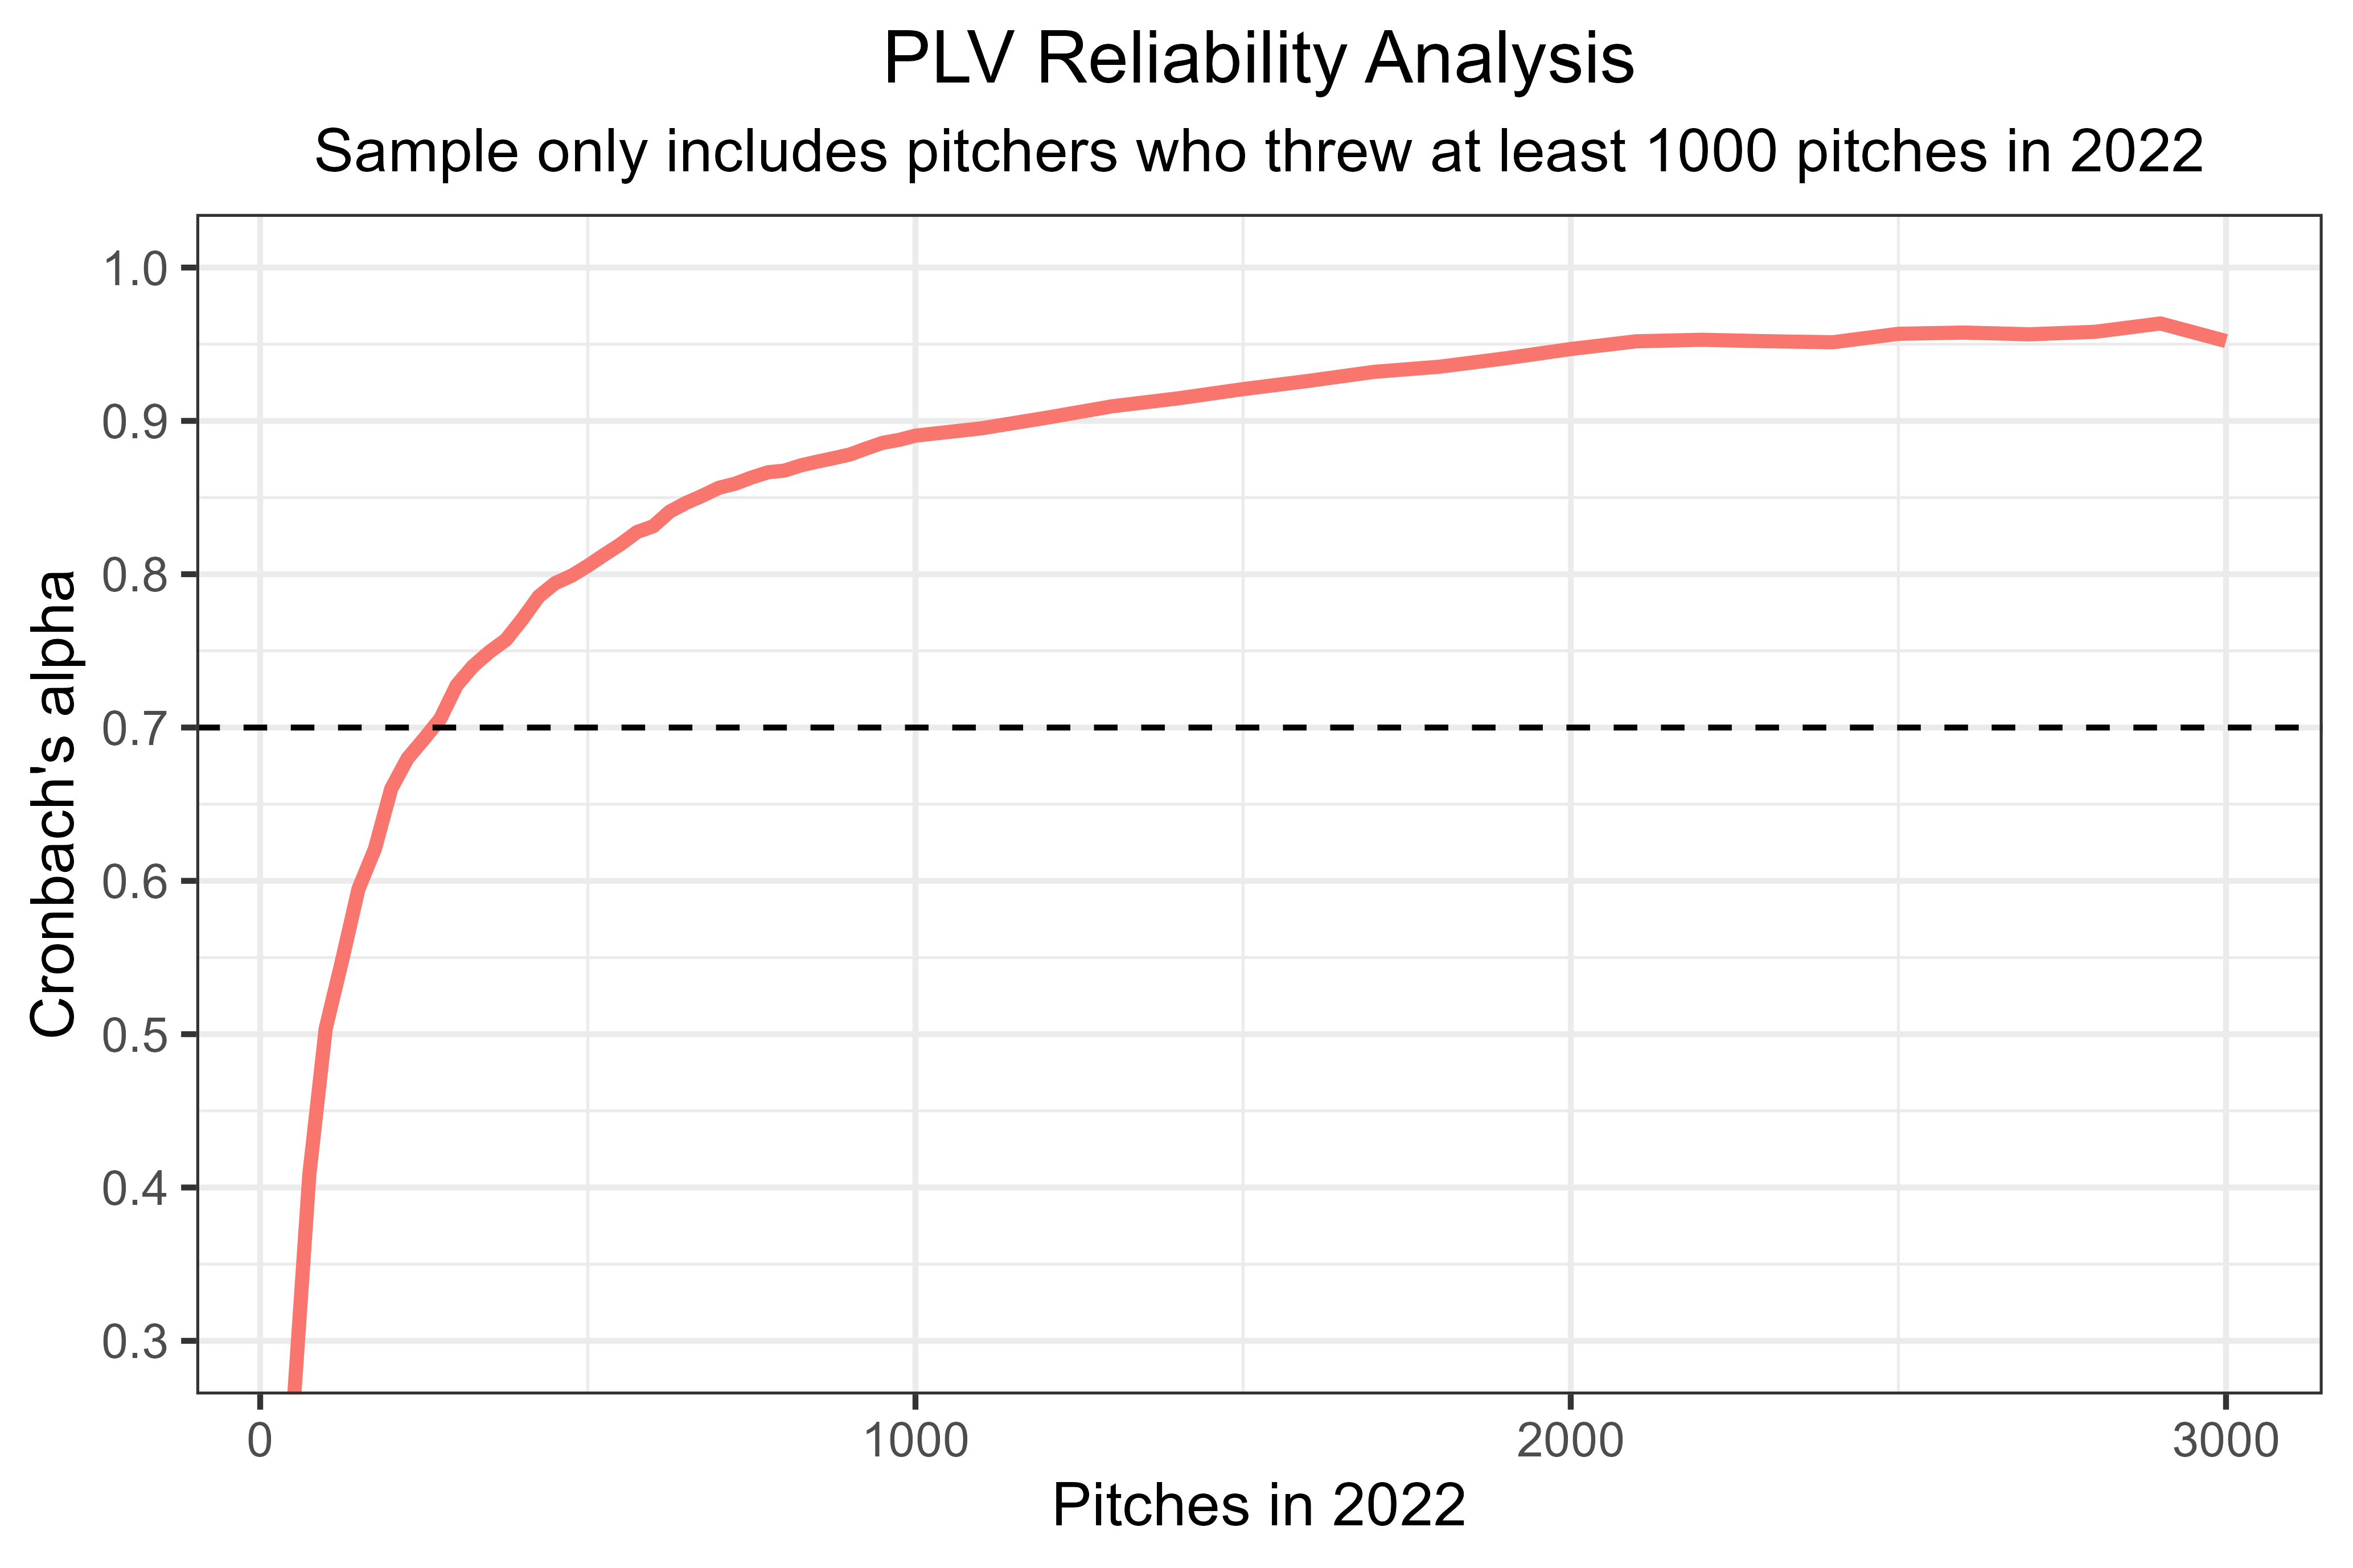
We’re not done with the technical stuff yet. First, here’s the stabilization point of PLV in-season, which is around the 275-pitch mark (thanks Colin Charles!):
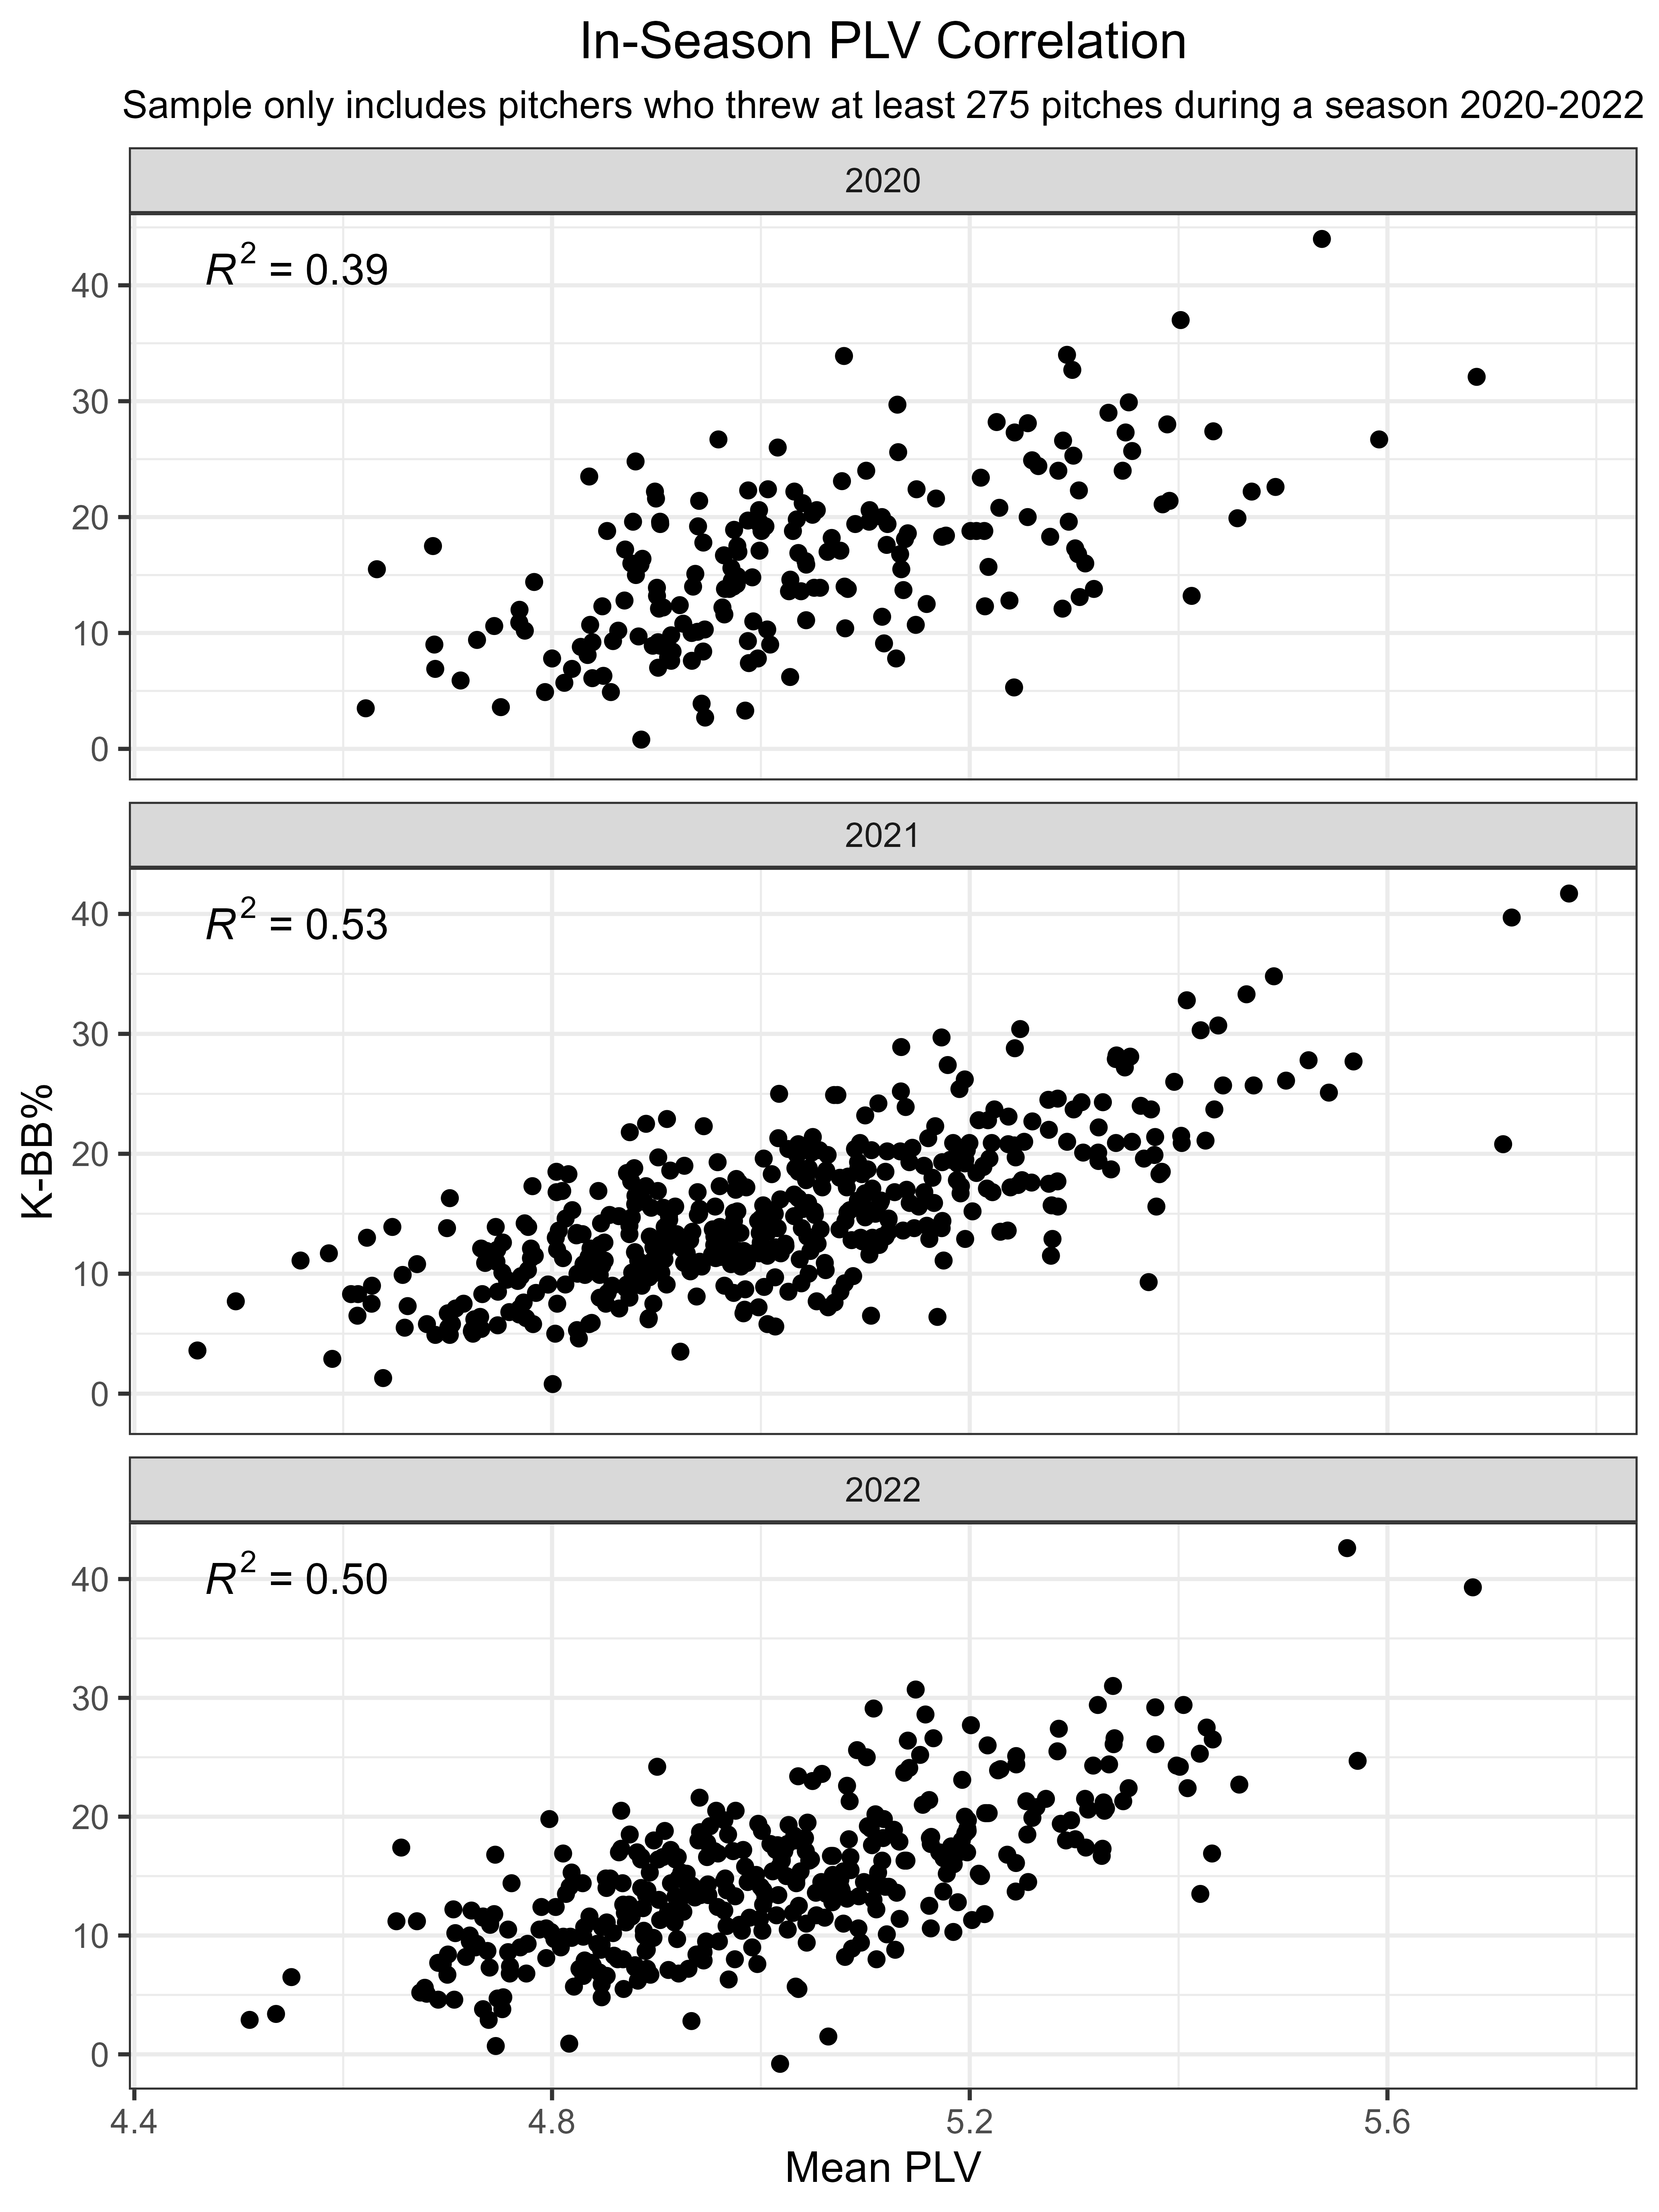
PLV in-season also correlates well to K-BB% in-season (2020, you fickle thing):
This is already a bloated article and I think that gives a good baseline for PLV to enjoy the findings below.
That’s it, you made it through the technical stuff. You’re doing great.
Small Tangent About Scaling PLV & PLA
There is a fun tangent to be had about the best way of scaling PLV, and if you find that interesting please send me a DM on Twitter or Discord. For the sake of being brief, I wrestled with the perfect way to present PLV. In the end, I wanted to avoid systems the baseball stat world was already familiar with (wRC+ percentile scales, for example) as I wanted PLV to be instantly understandable to non-sabermetric baseball fans.
At one point it was -3 to 3, but then I realized saying someone had a “1.23 PLV” wasn’t very fun or intuitive. So we settled on a 0-10 scale where the average settled around 5.00. We also introduced PLA, which takes the PLV of individual pitch types and transforms it into a value on the ERA scale. Saying a pitch has a relative ERA of 1.76 is as quickly translatable as you’ll find for your standard baseball fan, and I think that’s a pretty cool thing.
But why not a 0-100 scale instead of 0-10? Because then the numbers get too dang large when adding up the total PLV across a span of time (even a game would be in the 5,000+ range, let alone a full season). We had to shrink those down.
There are drawbacks of the 0-10 system, though, and we’re considering making a change at some point this year. One aspect is the lack of range in most PLV marks for pitchers, where the worst hover 4.50 and best sit around 5.50. We’re experimenting with a more aggressive range that flattens the middle of the value curve, creating pitchers with a 9.4 PLV and others with a 2.3 PLV, for example. We want to avoid the whole “percentile” value, though, since percentiles are not an even scale from start to finish.
That’s enough of that, let’s get back to it.
PLV Charts
Now that we understand how PLV is made, let’s look at some numbers and charts.
First, you want to see who lead 2022 in PLV. Here’s the Top 100 in PLV from 2022 (minimum 100 IP thrown):
Now let’s showcase general PLV marks by count and location:
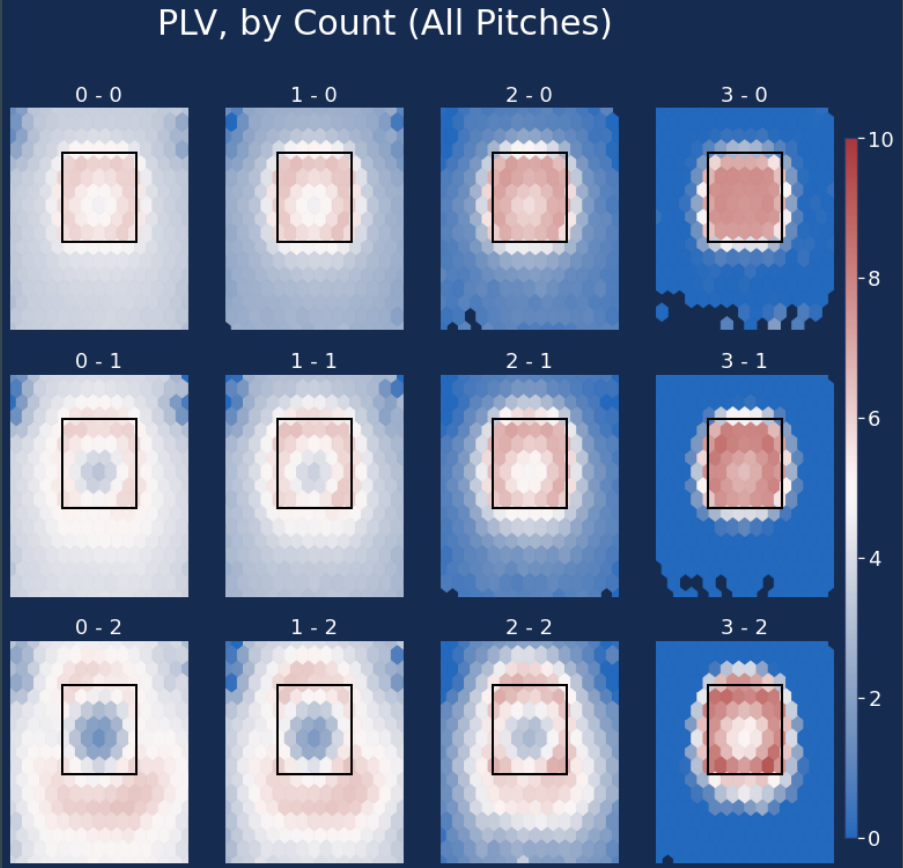
Our system analyzes swing decisions, outlining the horrific nature of pitchers throwing two-strike pitches down the middle (hitters are heavily inclined to swing at these and they are the easiest to punish, after all).
Our system also turns 3-2 counts into volatile PLV states – they can throw incredibly high PLV pitches or some of the worst as a perfect strike results in an out (the best outcome) or a poor pitch equates to a walk (one of the worst outcomes). Not all pitches outside the zone are so bad, though.
One flaw of our system is that it rewards 3-0 counts a bit more than we’d like. That said, if you’re getting into a 3-0 count in the first place, the gain from a 3-0 strike is dampened tremendously.
Here’s the same chart, but instead broken down by fastball, breaking ball, and off-speed:
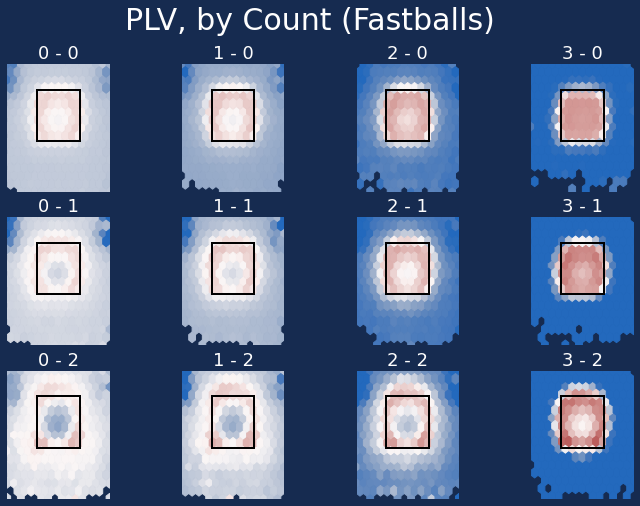
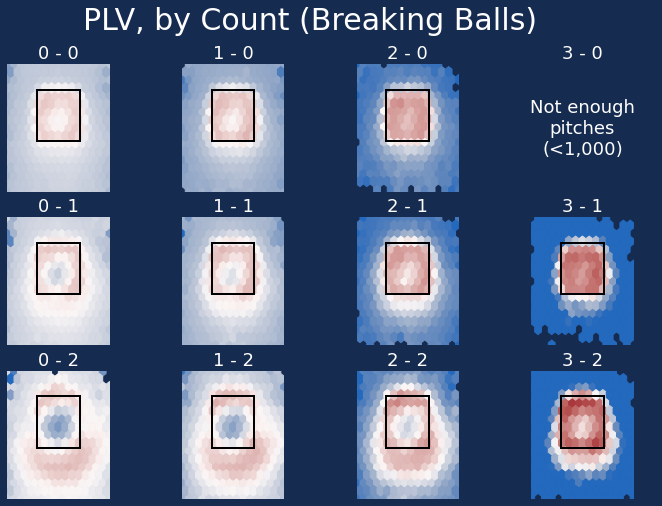
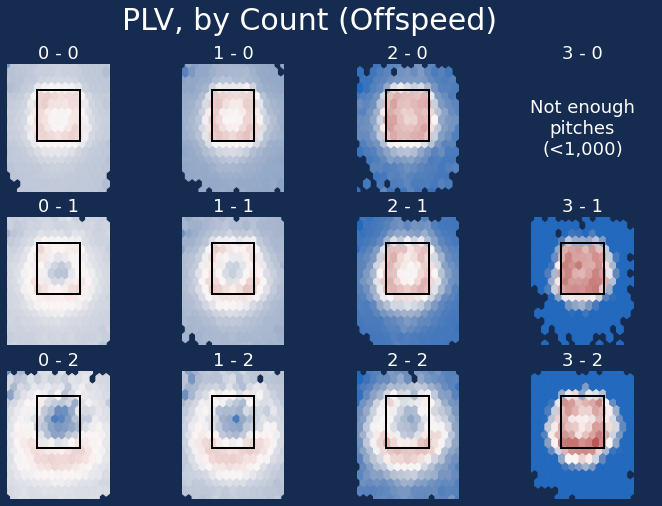
Please don’t throw a mistake changeup in two-strike counts. Get that dang thing down.
Let’s look at some more charts. Here’s Hunter Greene’s PLV by pitch:
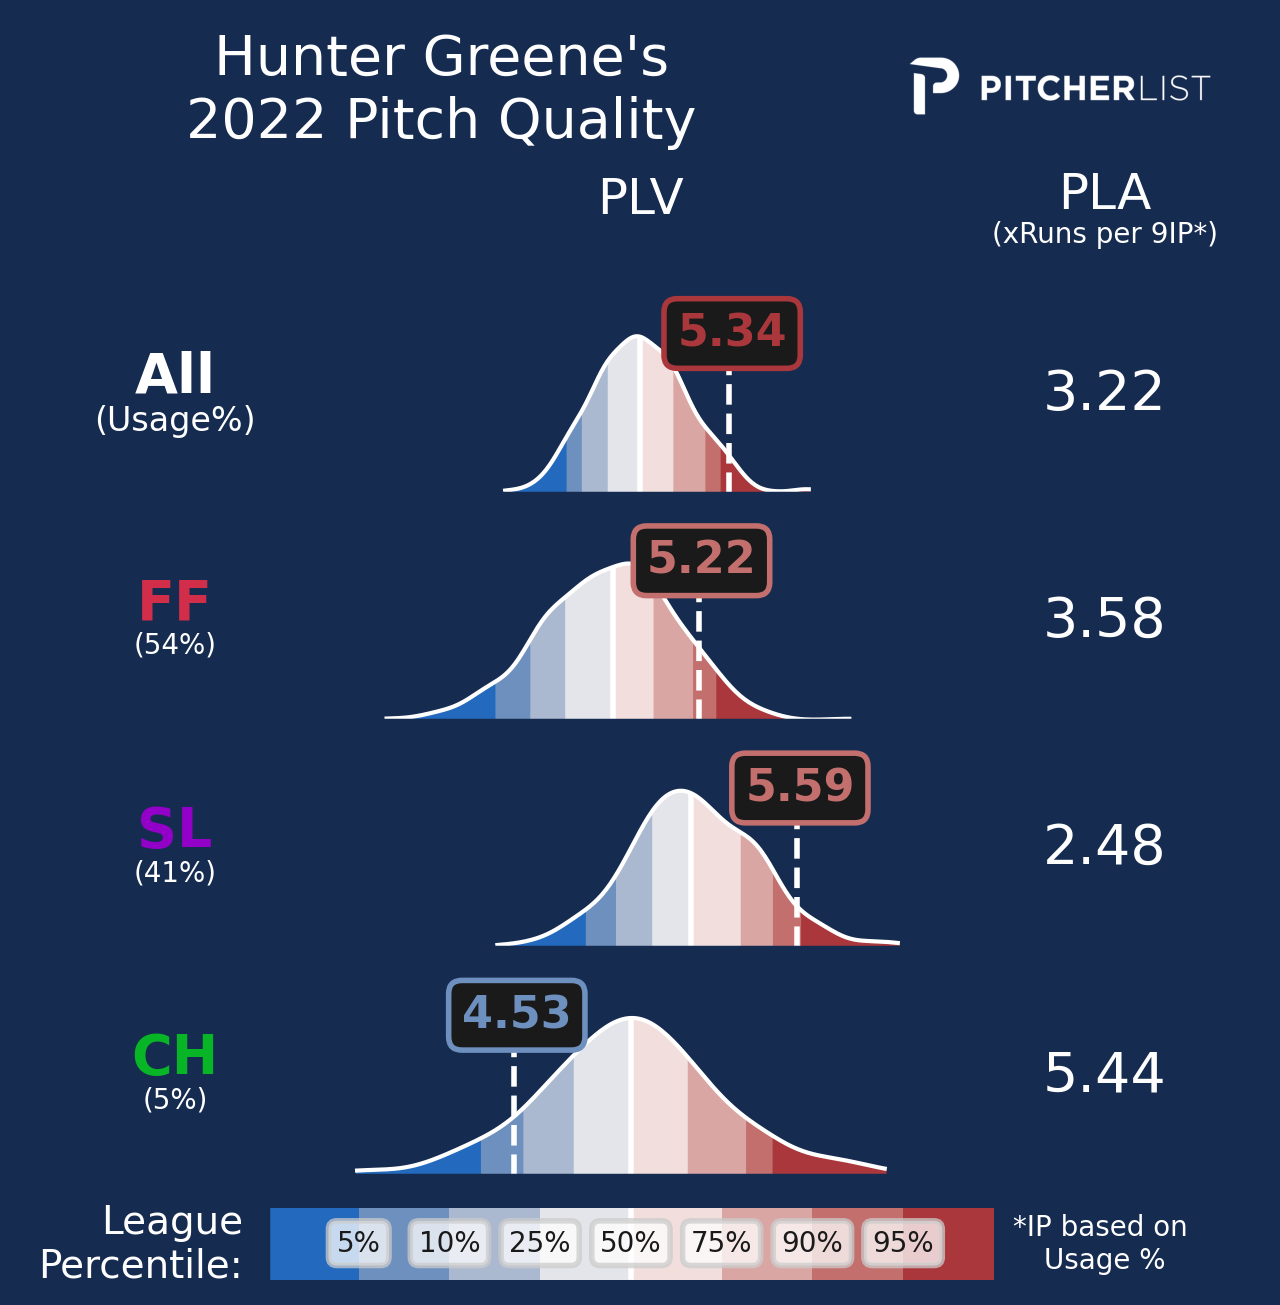
And the same arsenal, showing its distribution across the different PLV marks:
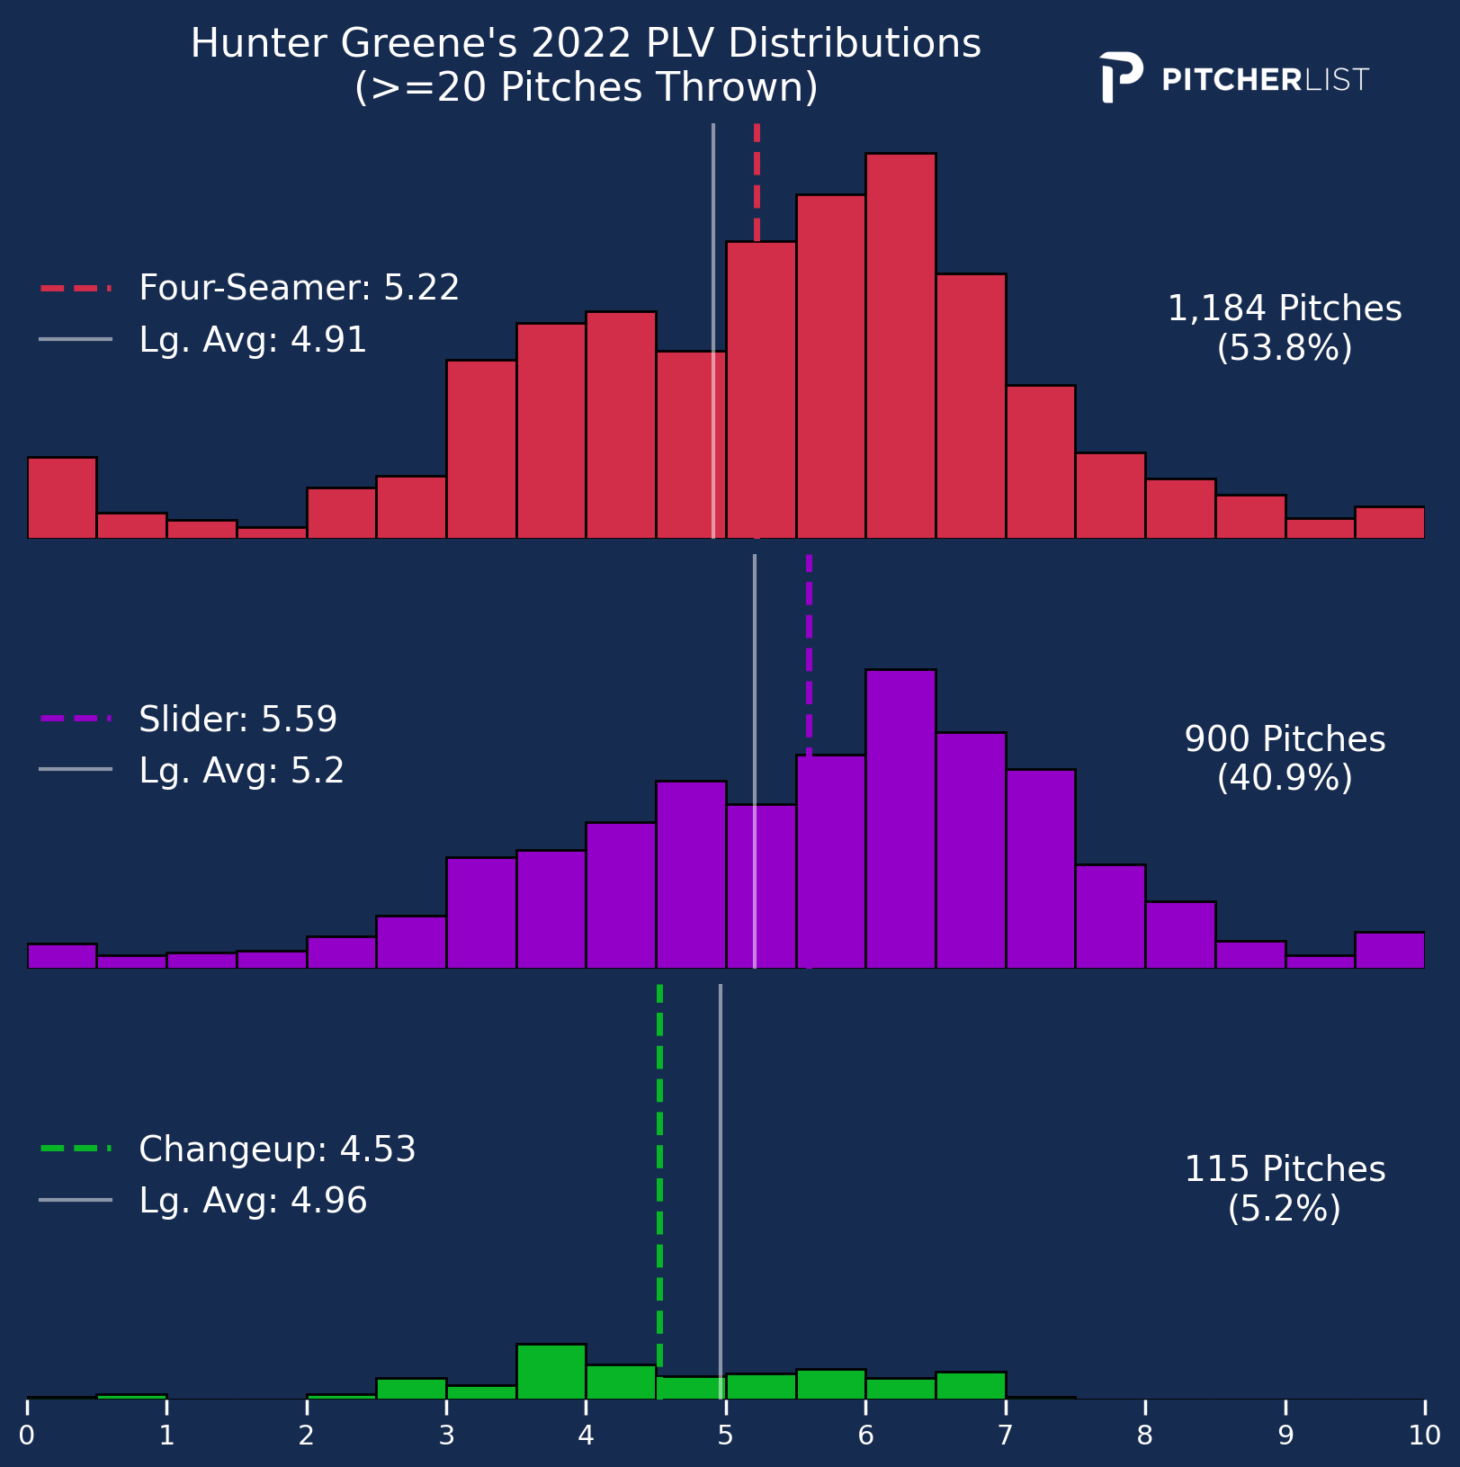
Spoiler alert: We really like Hunter Greene.
And here’s possibly my favorite one. Jacob deGrom’s 2021 PLV chart is dumb:
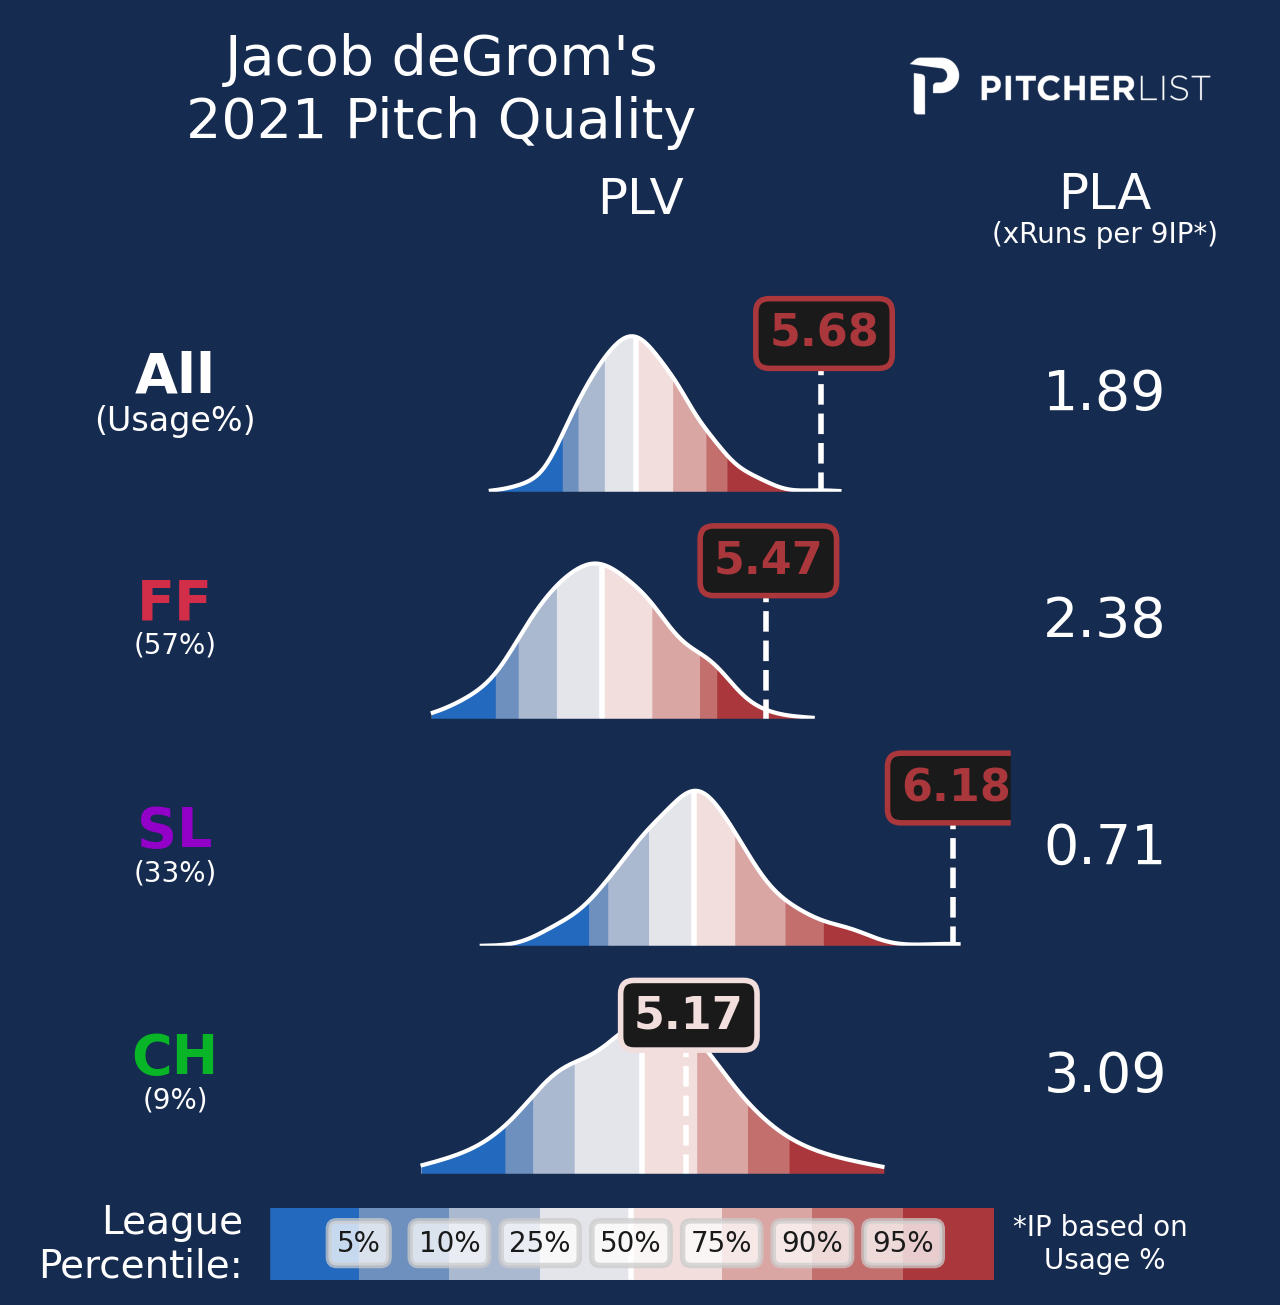
His slider doesn’t even fit. The tail gets extra life just to allow the slider to exist.
Let’s look at a table. Here are the best PLV performances of the year by the average pitch (min. 70 thrown) thrown in 2022.
Sure, it’s a lot of Jacob deGrom and Shohei Ohtani, but Jeffrey Springs? Steven Matz?! CHASE ANDERSON?! These pitchers are major leaguers for a reason and they were clearly locating their pitches that day.
You can check these out fully in our PLV Google Sheet and will be adding these to our website’s leaderboards later this year.
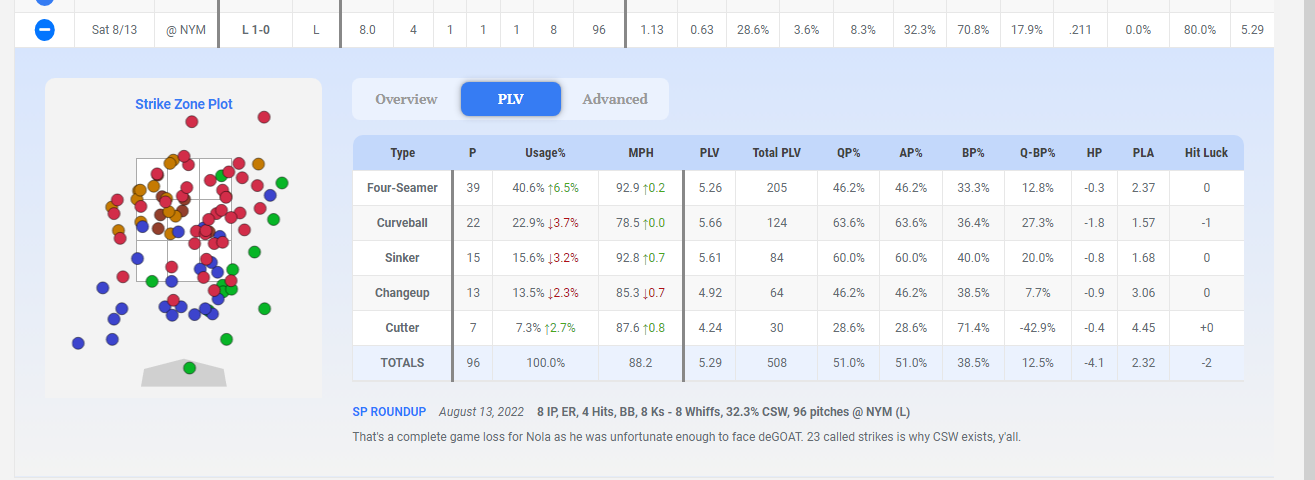
You can also follow PLV performances by pitch type inside our game logs as well, just click on a game’s row and the PLV tab:
We’re looking forward to having a full-season with PLV at the ready, allowing us to get a quick analysis of performance, especially with our new live leaderboards launching this spring, granting the above pitch-detail tables as the games are played. We’ll have more updates on that in the near future.
The Real Value of PLV
When I began the journey in 2019 to create PLV, it wasn’t to create a pitch quantifier on its own. Sure, it’s enjoyable to say “hey, Ross Stripling’s change was elite last year!” but that wasn’t the goal of the metric. In fact, PLV is just a seed for the other metrics we can create and let me tell you, this is where the fun begins. Ask yourself, what analysis could we make if we knew what pitch was a good pitch and which was a bad pitch?
For example, we currently don’t have a good way to measure a pitcher’s volatility. Sure, we have their ERA from start to start, or their walk or strike rates, but what if we looked at their pitch volatility? We hear announcers all the time say things like “that pitch was hung” or “another cement mixer slider”, but we haven’t been able to effectively quantify volatility pitch-by-pitch before.
There are so many doors that get opened by using PLV at the event level. We discuss luck as what happens in the field, but in all human competition – Chess, Tennis, Track, etc. – the true luck is what the opponent does. In baseball, you can throw a perfect pitch and it’s still hit for a home run. Meanwhile, you could face one of the worst pitchers in the game, but they happen to throw their three best sliders of the day in your at-bat. That’s the true luck we can now measure.
We’ve spent a long time creating our PLV model and wanted it to get a 1.0 version out into the wild before exploring too far with its applications (yes, we’re already working on a 2.0 version of PLV). That said, we already have some PLV metrics I want to share today, as well as a hint for others we’re currently working on.
Quality Pitches vs. Bad Pitches
The first application is an obvious one. We wanted a way to quickly say “this was a good pitch” and “this was a bad pitch”, so Quality Pitch (QP) and Bad Pitch (BP) were born. After experimenting with a few different methods to determine where the buckets should be placed, we settled on QP >= 5.5 PLV (about 45% of all pitches) and BP <= 4.5 PLV (about 35% of all pitches). Yes, pitchers are pretty dang good half the time.
To take this one step further to better observe pitchers who consistently avoid mistakes and produce quality pitches, we have QP-BP% – a pretty standard comparison of Quality Pitches and Bad Pitches. Here are some charts of 2022’s QP, BP, and QP-BP:
Craig Kimbrel and Collin McHugh…I know. Wild.
I know, we expected Shohei Ohtani, Spencer Strider, and Aaron Nola, but Keegan Akin?!
Now let’s look at those who threw an awfully high amount of Bad Pitches:
Tony Gonsolin…PLV does not like Gonsolin. Everything else checks out here pretty well.
Here is the “Please stop throwing this pitch, why are you doing this?!” table:
Many of the same names and it’s often a result of fastballs we just don’t think are good – they are getting away with them over the plate too often. The same goes for Nick Pivetta’s curveball, as the pitch struggles to get down.
Lastly, let’s move on to those who are most consistently throwing quality pitches without making mistakes:
The starting pitchers mostly make sense (The next group are all familiar names of Cole, Verlander, Lodolo, Gallen, Rasmussen, Gallen, and Darvish), but then there’s José Suarez sneaking in at the end. Interesting.
There’s still more to uncover with QP-BP%, where we could potentially look to see if these shift in certain game states (and counts!), and see if this can evolve into a new way to predict K-BB% rates, which we know are the staple for predicting future success. Taking it further into pitch types alone can help understand why a high SwStr rate pitch may not succeed very often if it has a high BP rate.
Hit Luck
This may be my favorite application of PLV coming out of our 1.0 launch of the metric. Hit Luck = [Actual hits allowed] – [Expected hits allowed], where the expected hits are what our prediction model expects from the pitches thrown. For example, a pitcher may throw a game and have a +2 HL, where according to PLV, they allowed two more hits than we expected them to.
But why not just use BABIP instead? This is where I get excited. With BABIP, we know the league average is typically around .300, yet we don’t expect all players to regress to a .300 BABIP. Instead, based on their skills, we expect flyball pitchers to have lower BABIPs, while hitters who barrel the ball frequently should have higher BABIPs. The problem? We don’t know what a player should regress to by just looking at their BABIP – we need more context.
That’s not the case with Hit Luck. Every pitcher is expected to regress to a Hit Luck of zero. PLV already looks at all the factors of a pitch that would increase the likelihood of an out or a hit, such as a sinker likely inducing a grounder, which has a higher chance of a hit than a flyball.
To hammer this point home, the average Hit Luck of Starting Pitchers in 2022 was -3, which is essentially noise across the length of a full 162-game season. (It also may suggest that are some elements of the model that we can’t quite nail down, such as defense alignment but that’s another conversation).
For hitters, this is a little different. Hit Luck is rooted in what the average result would be based on the pitch thrown – if a hitter holds a Hit Luck above that mark, it suggests they are performing better than expected based on the pitches they received. If his Hit Luck is below zero, it tells a story that they aren’t performing up to snuff. It’s similar to Hitter Performance in this way, though HP looks at a whole lot more, and isn’t focused solely on hits, such as the quality of the ball in play and their swing decisions (More on Hitter Performance in a moment).
There are a few stark examples of Hit Luck from 2022 pitchers that I’d like to showcase here. Take a look at these:
Notice how it’s not a list of BABIPs from low to high. Sure, at the extremes it shouldn’t surprise anyone that a .207 BABIP was lucky and .365 was unlucky, but the magnitude is nuanced and dependent on the pitcher’s pitches. Maybe Alex Cobb wasn’t so unlucky after all.
And yes, I can’t believe Cal Quantrill was unlucky last season. I still don’t understand it.
I have to warn you, there are elements of Hit Luck that aren’t taken into account as noted before, specifically team defense. The Dodgers and Astros make up three of the first four names here and it’s no coincidence – both ranked highly favorably in shifts and infield defense. Conversely, both Patrick Corbin and Kevin Gausman endured terrible defenses behind them, which elevated their HL. We’re not completely removed from context with HL and consider it a major piece of the puzzle, but not the entire picture.
You can find Hit Luck inside pitcher player pages now as part of the PLV table at the bottom and inside the Game Log and Repertoire sections. Hitters and our overall leaderboards will have Hit Luck in the near future as well.
Hitter Performance
With the pitching applications out of the way, it’s time to shift our focus to what I believe is the true future of PLV – using it as a way to evaluate hitters better than ever. Remember, the true luck in baseball is what the opponent does and hitters are no exception. Being able to look at a hitter’s ability to resist tough pitches and take advantage of mistakes can be a difference-maker in player analysis and PLV allows us to do so.
To create Hitter Performance (HP), we take a look at every pitch they saw and give a + or – value based on their influence on the expected run value. In other words, we have an expected result based on PLV and we assign a positive or negative value to the hitter if the expected result is different. For example, if a dotted fastball on the corner that we expect to be a called strike or an out is blasted for a double, we give a positive value to the hitter. However, if a meaty curveball is thrown and isn’t taken advantage of, we assign a negative value.
The raw Hitter Performance value is scaled to runs added per 100 pitches seen by the hitter based on the pitch quality via PLV. That last part is critical as there are many elements we observe from the hitter based on PLV to create the expected result. Here are some of the metrics we’re able to quantify (all definitions taken from our PLV hitter app):
Swing Aggression: How often a hitter swings at pitches, given the swing likelihoods of the pitches they face.
Strikezone Judgement: The “correctness” of a hitter’s swings and takes, using the likelihood of a pitch being a called strike (for swings) or a ball/HBP (for takes).
Decision Value: Modeled value (runs per 100 pitches) of a hitter’s decision to swing or take, minus the modeled value of the alternative.
Contact Ability: A hitter’s ability to make contact (foul strike or BIP) above the contact expectation of each pitch.
Power: Modeled number of extra bases (xISO on contact) above a pitch’s expectation for each batted ball event.
We’re going to be adding these stats to our player pages in the near future. In the meantime, you can use the app above to create rolling charts of any of those metrics, including filters such as pitch threshold, counts, and pitcher handedness. Take this one of Aaron Judge’s HP across the 2022 season:
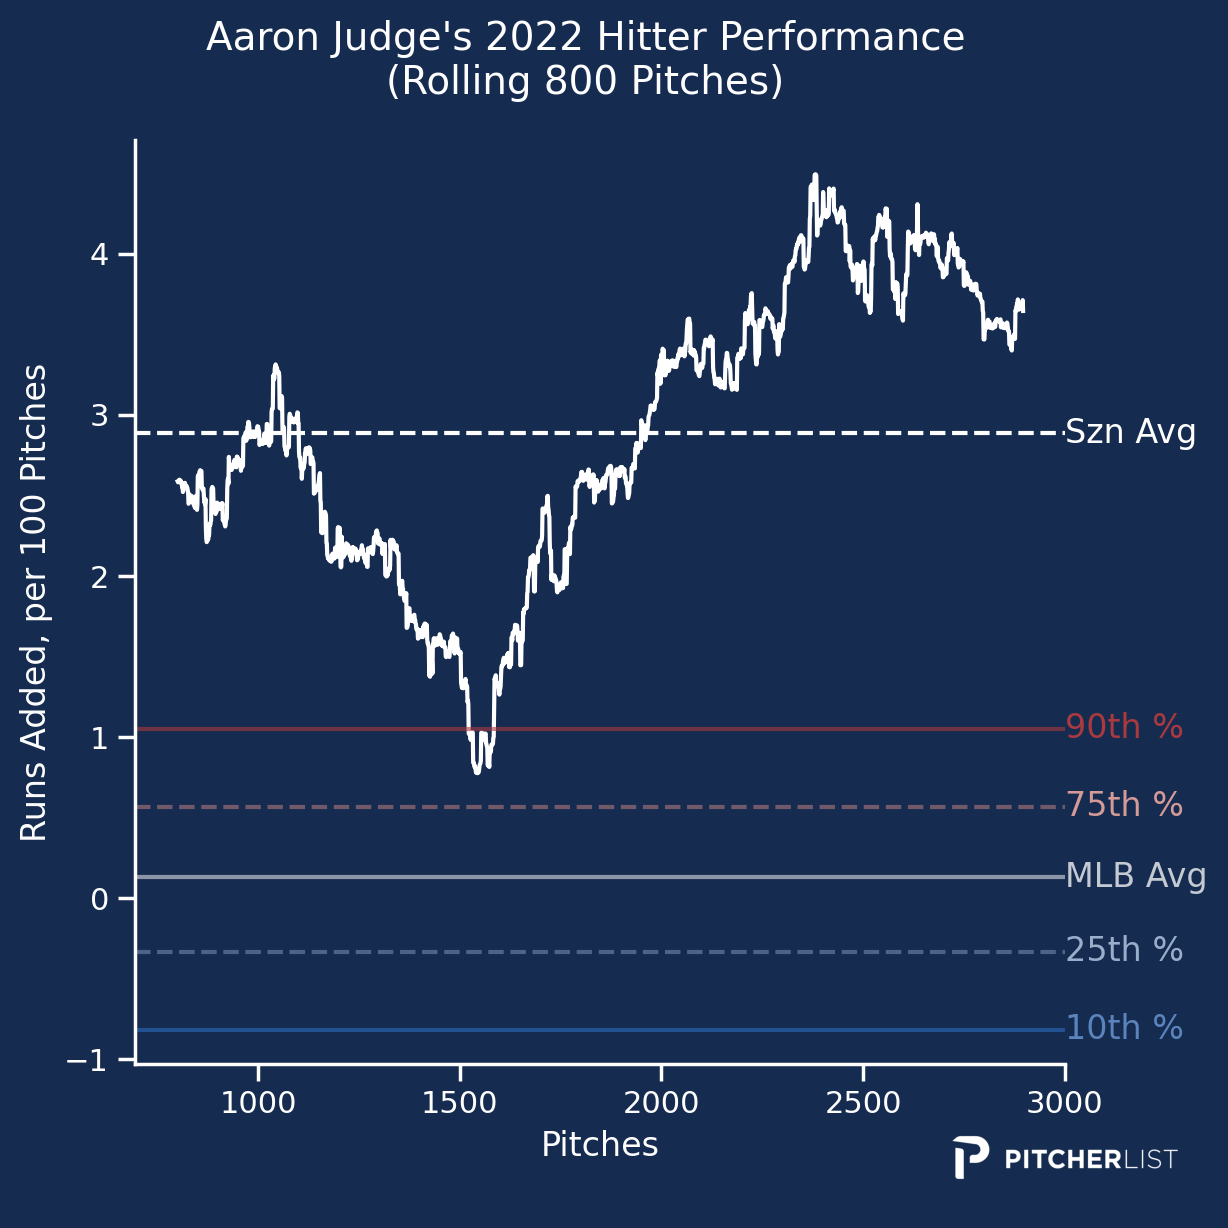
I’ll say it again – I think hitters are the biggest benefactor of PLV as it allows us to truly understand their skills better than ever. Being able to pinpoint hitter abilities outside of the contact they make is an easy way to observe changes over a season that’s far deeper than any box score. There’s a lot more to dive into here and I’m curious about what we’ll uncover across the season ahead.
What’s Next?
One of the more exciting elements of releasing PLV is the discussion it creates with all of you and hearing your ideas for its applications. By adding another stat into the timeline of an event, we’re able to frame the game differently than before, which is sure to expose fascinating correlations and narratives that weren’t possible before.
We’re already working on new applications that we hope to share later this year, including an ERA estimator, HR analyzer, and reliever-focused metrics.
Reach out to us and let us know what you’d want to make.
Resources
To access PLV data, head to these helpful links:
PLV Pitcher App – You can view 2020-2022 PLV here with multiple charts and leaderboards. We feature a color-blindness mode as well as filtering for batter handedness.
PLV Hitter App – Rolling charts galore with tons of PLV hitting metrics inside leaderboards
Pitcher List Pitcher Pages – You can find PLV on every pitcher’s page on our website. We have a dedicated overall table at the bottom of the page, plus tabs for individual pitches inside both the Repertoire section and Game Log.
Follow along here at the site or via our PLV twitter account @PitcherListPLV.
Adapted by Chris Corr (@Chris_Studios on Twitter)
Great stuff Nick and the rest of the PL team! Congrats on the FSWA award! After reading an article like this, it shouldn’t surprise anyone to hear you were “Baseball Writer of the Year”! Well deserved.
I’ve read your top 300 starters looking into Gausman. The 4 seam stuff is concerning and hopefully he’s able to correct whatever the issue is. Gausman falls at #7 with a 5.31 PLV for pitchers with at least 100 IP on the chart above but the Excel SS notes his hit luck as being at 33, which is only better than Corbin and Severino. I’m trying not to put too much stock into the .364 BABIP, but it’s still a concern. Does your ranking of Gausman being #21 in your top 300 change with what you’ve learned regarding PLV?
Keeper League (keep 6) Looking to decide on keepers and I can keep Woodruff or Alcantara in the 2nd or I can swing a trade for Gausman and keep him the 17th and then draft the best available starter/bat with my first 2 picks 6 OA and 10 OA. I’m already keeping Gilbert in the 19th. I appreciate any advice, thank you!
Awesome article and revolutionary work by the team to bring the concepts to life!
Well done. I found this to be extremely well written and concise. The methodology is pretty sound here, imo. I really like idea of stimulating game states based on pitch quality and estimating the value through the wOBA delta.
One thing for future consideration: this metric very much focuses on what the pitcher side of the event generating process and I wonder if the accuracy of the model could be improved by thinking about the game theory side of the hitter-pitcher battle.
How predictable your pitch choices are may matter here, currently the model is only considering pitch quality in estimating outcomes.
If the model considered how expected a pitch type and location was given the situation, pitcher tendencies, and hitter tendencies, you may be more accurate in modeling outcomes.
This is all great. One quick question: your data doesn’t seem to be consistent in various spots; am I missing some distinctions, or is one place more updated than others? Taking our man Sandy Alcantara as an example:
google sheet: 5.24 PLV, 2.86 PLA
PLV pitchers app: 5.24 PLV, 2.85 PLA
Sandy’s player page: 5.10 PLV, 2.91 PLA
or Tyler Wells:
google sheet: 5.17 PLV, 3.39 PLA
PLV pitchers app: 5.17, PLV, 3.37 or 3.39 PLA (differs between Season PLA chart and Tyler’s Pitcher Chart)
Tyler’s player page: 5.01 PLV, 3.83 PLA
I think those are all total 2022 numbers. The google sheet and the pitcher app are pretty close, but the individual player pages can be off quite a bit (Ohtani’s PLA is 2.75 or 2.79 on the app and 3.14 on his player page).
(The player page xERAs also don’t match statcast xERAs from savant; do you guys make an adjustment to their formula?)
I just heard about your work. This is fantastic stuff, and I look forward to making a much deeper dive into it this offseason. Maybe you mentioned it and I missed it, but it seems to me that vL and vR, for both hitters and pitchers, would play a huge role. In effect, making platoon bats look far better than the hitters really are?
The other thing I wonder about is the leverage state of the game. Is the game an 8-1 blowout in the bottom of the ninth between two teams going nowhere? One of those where everyone just wants to get it over and go home? Or is the game a 3-2 nailbiter from the sixth inning on between two teams vying for a division championship, where one great swing or one great pitch can turn the entire outcome? Put another way, is the game in garbage time or get paid time? Can that even be accounted for? I’ve wrestled with this exact thing for years.
I think you said that the venue is taken into account, but what about the weather… air temp, humidity, breeze, etc? This would seem to have a significant effect.
Anyway, thanks again for your work. As I said, I’ll be getting deeply into it now that I know it’s available.