(Photo by Kevin Abele/Icon Sportswire)
Welcome back, everyone. We’re now almost halfway through the MLB season, a great time to look back at some of the more surprising performances so far. With that in mind, here are the newly updated mid-season rankings, starting with the qualified SP:
| Rank |
Name |
Prev |
Diff |
Score |
IP |
ERA |
PD Score |
xK% |
K% |
xK%-K% |
BB% |
xSLG |
SLG-xSLG |
| 1 |
Max Scherzer |
1 |
0 |
103.4% |
114.2 |
2.04 |
108.6% |
34.3% |
37.1% |
-2.8% |
6.1% |
0.345 |
-0.029 |
| 2 |
Jacob deGrom |
2 |
0 |
103.0% |
101.1 |
1.69 |
102.5% |
30.8% |
31.4% |
-0.7% |
6.7% |
0.310 |
-0.024 |
| 3 |
Chris Sale |
3 |
0 |
103.0% |
109.0 |
2.56 |
104.4% |
32.4% |
35.6% |
-3.2% |
6.5% |
0.323 |
-0.011 |
| 4 |
Patrick Corbin |
5 |
+1 |
96.6% |
100.0 |
3.24 |
101.5% |
31.0% |
32.5% |
-1.6% |
6.8% |
0.389 |
-0.057 |
| 5 |
Trevor Bauer |
6 |
+1 |
95.9% |
107.0 |
2.44 |
93.5% |
28.3% |
31.8% |
-3.6% |
7.9% |
0.345 |
-0.035 |
| 6 |
Justin Verlander |
4 |
-2 |
95.5% |
113.2 |
1.82 |
88.9% |
25.8% |
31.3% |
-5.5% |
5.3% |
0.319 |
-0.012 |
| 7 |
Charlie Morton |
9 |
+2 |
94.7% |
95.2 |
2.54 |
91.1% |
28.3% |
31.0% |
-2.8% |
9.9% |
0.345 |
-0.011 |
| 8 |
Aaron Nola |
7 |
-1 |
92.9% |
101.1 |
2.58 |
84.6% |
23.8% |
25.1% |
-1.4% |
7.3% |
0.326 |
-0.027 |
| 9 |
Jon Gray |
12 |
+3 |
92.8% |
88.0 |
5.52 |
92.2% |
29.1% |
28.6% |
0.5% |
6.9% |
0.377 |
0.068 |
| 10 |
Gerrit Cole |
8 |
-2 |
92.8% |
105.2 |
2.56 |
91.6% |
28.4% |
36.3% |
-8.0% |
8.2% |
0.374 |
-0.056 |
| 12 |
Blake Snell |
13 |
+1 |
92.1% |
101.1 |
2.31 |
91.7% |
29.1% |
28.1% |
1.0% |
10.0% |
0.383 |
-0.059 |
| 11 |
Luis Severino |
10 |
-1 |
92.1% |
111.2 |
2.10 |
90.7% |
26.7% |
30.4% |
-3.8% |
6.0% |
0.376 |
-0.083 |
| 13 |
Carlos Carrasco |
15 |
+2 |
90.6% |
91.1 |
4.24 |
94.4% |
27.4% |
25.6% |
1.8% |
5.9% |
0.422 |
-0.031 |
| 14 |
Jose Berrios |
19 |
+5 |
90.3% |
103.0 |
3.15 |
89.2% |
24.9% |
26.9% |
-2.0% |
4.9% |
0.391 |
-0.043 |
| 15 |
Eduardo Rodriguez |
14 |
-1 |
90.2% |
81.2 |
3.86 |
85.4% |
24.2% |
26.1% |
-2.0% |
7.4% |
0.367 |
0.009 |
| 16 |
Lance McCullers Jr. |
20 |
+4 |
90.0% |
94.1 |
3.82 |
89.9% |
27.2% |
25.7% |
1.5% |
9.3% |
0.399 |
-0.027 |
| 17 |
James Paxton |
16 |
-1 |
89.6% |
103.2 |
3.65 |
90.6% |
26.7% |
32.0% |
-5.4% |
7.2% |
0.410 |
-0.033 |
| 18 |
Sean Newcomb |
11 |
-7 |
88.6% |
87.0 |
2.59 |
77.0% |
21.9% |
23.9% |
-2.0% |
10.8% |
0.332 |
-0.027 |
| 19 |
Vince Velasquez |
24 |
+5 |
87.9% |
86.1 |
4.69 |
82.6% |
25.0% |
28.5% |
-3.5% |
9.0% |
0.379 |
0.046 |
| 20 |
Mike Clevinger |
18 |
-2 |
87.8% |
104.0 |
3.03 |
83.4% |
23.6% |
22.4% |
1.2% |
8.1% |
0.386 |
-0.034 |
| 21 |
Tyler Anderson |
29 |
+8 |
87.1% |
85.2 |
4.62 |
85.2% |
25.0% |
21.1% |
3.9% |
8.2% |
0.406 |
0.064 |
| 22 |
Tyler Skaggs |
23 |
+1 |
87.1% |
87.0 |
2.69 |
85.3% |
24.3% |
26.3% |
-2.0% |
7.3% |
0.407 |
-0.030 |
| 23 |
Kyle Gibson |
22 |
-1 |
86.8% |
88.2 |
3.25 |
83.3% |
24.0% |
23.3% |
0.7% |
10.6% |
0.398 |
-0.058 |
| 24 |
Nick Pivetta |
25 |
+1 |
86.8% |
84.1 |
4.06 |
85.0% |
24.9% |
28.6% |
-3.8% |
6.8% |
0.410 |
-0.018 |
| 25 |
Corey Kluber |
31 |
+6 |
86.8% |
113.1 |
2.54 |
82.8% |
22.4% |
26.9% |
-4.5% |
3.0% |
0.395 |
-0.049 |
| 26 |
Dylan Bundy |
28 |
+2 |
86.5% |
96.0 |
3.75 |
94.5% |
27.5% |
27.0% |
0.5% |
7.3% |
0.477 |
-0.037 |
| 27 |
Mike Foltynewicz |
26 |
-1 |
86.4% |
84.0 |
2.14 |
75.3% |
21.9% |
28.4% |
-6.6% |
10.7% |
0.350 |
-0.040 |
| 28 |
Alex Wood |
27 |
-1 |
86.3% |
80.2 |
4.13 |
86.5% |
23.0% |
22.3% |
0.7% |
4.8% |
0.426 |
-0.037 |
| 29 |
Lance Lynn |
[UR] |
[N/A] |
84.8% |
78.2 |
4.81 |
78.5% |
22.5% |
22.8% |
-0.4% |
13.2% |
0.392 |
0.007 |
| 30 |
Jameson Taillon |
30 |
0 |
84.7% |
88.2 |
3.96 |
76.7% |
20.3% |
22.4% |
-2.1% |
6.7% |
0.382 |
0.007 |
| 31 |
Luis Castillo |
33 |
+2 |
84.7% |
83.2 |
5.70 |
92.7% |
28.7% |
22.4% |
6.3% |
8.8% |
0.489 |
-0.004 |
| 32 |
Rick Porcello |
35 |
+3 |
84.2% |
99.1 |
3.44 |
74.0% |
19.0% |
22.7% |
-3.7% |
5.3% |
0.370 |
-0.025 |
| 33 |
Miles Mikolas |
41 |
+8 |
84.1% |
97.0 |
2.69 |
78.6% |
18.7% |
18.5% |
0.2% |
3.1% |
0.402 |
-0.067 |
| 34 |
J.A. Happ |
34 |
0 |
83.9% |
97.0 |
3.62 |
76.5% |
21.5% |
27.0% |
-5.5% |
6.9% |
0.391 |
-0.035 |
| 35 |
Stephen Strasburg |
40 |
+5 |
83.5% |
80.2 |
3.46 |
85.1% |
24.5% |
29.1% |
-4.6% |
5.8% |
0.454 |
-0.055 |
| 36 |
Matt Boyd |
37 |
+1 |
83.4% |
82.1 |
4.15 |
74.0% |
21.1% |
19.9% |
1.2% |
9.5% |
0.381 |
-0.023 |
| 37 |
Tyson Ross |
36 |
-1 |
82.8% |
95.0 |
3.32 |
77.0% |
20.8% |
22.7% |
-1.9% |
8.8% |
0.409 |
-0.045 |
| 38 |
Zack Greinke |
46 |
+8 |
82.7% |
96.0 |
3.66 |
86.4% |
23.9% |
26.0% |
-2.1% |
4.9% |
0.474 |
-0.039 |
| 39 |
Dallas Keuchel |
44 |
+5 |
82.6% |
97.0 |
3.90 |
74.2% |
18.9% |
18.5% |
0.4% |
6.0% |
0.393 |
0.025 |
| 40 |
Clayton Richard |
45 |
+5 |
82.5% |
100.0 |
4.23 |
78.3% |
21.9% |
19.5% |
2.4% |
7.7% |
0.422 |
-0.035 |
| 41 |
Sonny Gray |
52 |
+11 |
82.2% |
80.1 |
4.93 |
76.9% |
22.4% |
20.6% |
1.8% |
9.6% |
0.417 |
-0.001 |
| 42 |
Zack Wheeler |
47 |
+5 |
82.0% |
81.2 |
4.85 |
77.9% |
21.1% |
22.3% |
-1.2% |
8.8% |
0.426 |
-0.051 |
| 43 |
Cole Hamels |
48 |
+5 |
81.9% |
97.1 |
3.61 |
85.8% |
24.8% |
23.3% |
1.5% |
8.9% |
0.480 |
-0.033 |
| 44 |
Kevin Gausman |
32 |
-12 |
81.9% |
94.1 |
4.20 |
84.4% |
24.1% |
21.7% |
2.4% |
6.2% |
0.471 |
0.004 |
| 45 |
German Marquez |
43 |
-2 |
81.8% |
83.0 |
5.53 |
72.0% |
20.5% |
22.2% |
-1.8% |
9.3% |
0.389 |
0.091 |
| 46 |
Gio Gonzalez |
39 |
-7 |
81.5% |
85.2 |
3.68 |
75.9% |
21.8% |
22.0% |
-0.3% |
10.5% |
0.420 |
-0.015 |
| 47 |
Michael Fulmer |
49 |
+2 |
81.4% |
86.1 |
4.17 |
80.2% |
21.6% |
20.9% |
0.7% |
8.4% |
0.449 |
-0.047 |
| 48 |
Zack Godley |
51 |
+3 |
81.1% |
88.1 |
4.58 |
81.3% |
24.5% |
22.0% |
2.5% |
11.4% |
0.461 |
-0.039 |
| 49 |
Kyle Freeland |
50 |
+1 |
80.7% |
91.1 |
3.55 |
73.6% |
19.3% |
20.4% |
-1.1% |
8.2% |
0.415 |
-0.014 |
| 50 |
Jose Urena |
56 |
+6 |
80.0% |
94.0 |
4.40 |
74.3% |
18.7% |
19.4% |
-0.7% |
5.4% |
0.429 |
-0.040 |
| 51 |
Julio Teheran |
53 |
+2 |
79.9% |
81.2 |
4.52 |
78.4% |
22.9% |
21.4% |
1.5% |
11.4% |
0.457 |
-0.021 |
| 52 |
Jake Odorizzi |
57 |
+5 |
79.8% |
79.2 |
4.97 |
82.9% |
24.1% |
22.7% |
1.4% |
10.2% |
0.489 |
-0.004 |
| 53 |
David Price |
58 |
+5 |
78.9% |
93.1 |
3.66 |
70.5% |
18.7% |
23.3% |
-4.7% |
8.6% |
0.418 |
-0.034 |
| 54 |
Jake Arrieta |
55 |
+1 |
78.8% |
84.0 |
3.54 |
66.8% |
15.5% |
16.8% |
-1.3% |
7.7% |
0.394 |
-0.005 |
| 55 |
Tyler Mahle |
70 |
+15 |
78.5% |
86.0 |
3.98 |
75.9% |
21.3% |
22.0% |
-0.8% |
9.8% |
0.460 |
-0.005 |
| 56 |
Marco Gonzales |
63 |
+7 |
78.4% |
91.1 |
4.04 |
75.8% |
18.7% |
21.1% |
-2.5% |
5.3% |
0.460 |
-0.037 |
| 57 |
Jhoulys Chacin |
54 |
-3 |
78.1% |
92.0 |
3.82 |
70.9% |
19.7% |
18.1% |
1.6% |
10.2% |
0.431 |
-0.059 |
| 58 |
Kyle Hendricks |
65 |
+7 |
78.1% |
89.1 |
3.73 |
73.6% |
19.4% |
18.9% |
0.4% |
7.4% |
0.449 |
-0.045 |
| 59 |
Tanner Roark |
60 |
+1 |
78.1% |
92.1 |
4.09 |
73.4% |
19.6% |
20.5% |
-0.9% |
8.6% |
0.448 |
-0.051 |
| 60 |
Aaron Sanchez |
62 |
+2 |
77.9% |
79.2 |
4.52 |
76.6% |
22.5% |
18.7% |
3.8% |
12.6% |
0.472 |
-0.085 |
| 61 |
Jose Quintana |
59 |
-2 |
77.7% |
80.1 |
4.26 |
69.8% |
18.8% |
22.0% |
-3.2% |
10.7% |
0.430 |
-0.015 |
| 62 |
Luke Weaver |
64 |
+2 |
77.4% |
84.1 |
4.59 |
72.6% |
20.5% |
21.0% |
-0.5% |
8.7% |
0.452 |
-0.052 |
| 63 |
Jakob Junis |
61 |
-2 |
77.4% |
96.1 |
4.67 |
76.9% |
20.3% |
21.8% |
-1.6% |
6.5% |
0.481 |
-0.009 |
| 64 |
Sean Manaea |
68 |
+4 |
77.3% |
100.2 |
3.40 |
78.5% |
20.7% |
18.5% |
2.2% |
4.7% |
0.493 |
-0.127 |
| 65 |
James Shields |
67 |
+2 |
77.0% |
99.1 |
4.53 |
74.5% |
20.5% |
16.3% |
4.2% |
8.9% |
0.470 |
-0.088 |
| 66 |
Marco Estrada |
71 |
+5 |
77.0% |
84.1 |
4.48 |
76.8% |
21.0% |
19.4% |
1.6% |
6.3% |
0.486 |
-0.001 |
| 67 |
Chad Bettis |
69 |
+2 |
76.6% |
92.1 |
5.07 |
71.8% |
19.6% |
17.0% |
2.6% |
9.1% |
0.457 |
0.003 |
| 68 |
Michael Wacha |
72 |
+4 |
76.3% |
84.1 |
3.20 |
72.9% |
21.0% |
20.0% |
0.9% |
10.1% |
0.468 |
-0.124 |
| 69 |
Reynaldo Lopez |
73 |
+4 |
75.8% |
94.0 |
3.73 |
70.0% |
19.2% |
16.8% |
2.4% |
9.8% |
0.456 |
-0.061 |
| 70 |
Ivan Nova |
76 |
+6 |
75.7% |
81.1 |
3.98 |
74.2% |
19.1% |
19.2% |
-0.1% |
4.4% |
0.486 |
-0.051 |
| 71 |
Steven Matz |
[UR] |
[N/A] |
75.7% |
78.0 |
3.69 |
61.8% |
17.6% |
21.4% |
-3.9% |
9.2% |
0.403 |
0.016 |
| 72 |
Trevor Williams |
74 |
+2 |
74.8% |
87.0 |
4.03 |
67.3% |
16.9% |
17.8% |
-0.9% |
7.8% |
0.451 |
-0.055 |
| 73 |
Felix Hernandez |
77 |
+4 |
74.6% |
95.1 |
5.10 |
70.7% |
18.1% |
19.2% |
-1.2% |
8.4% |
0.477 |
-0.046 |
| 74 |
Jon Lester |
66 |
-8 |
74.5% |
95.0 |
2.18 |
71.1% |
19.6% |
19.4% |
0.1% |
8.4% |
0.481 |
-0.139 |
| 75 |
Derek Holland |
[UR] |
[N/A] |
74.4% |
85.0 |
4.24 |
71.8% |
20.4% |
22.1% |
-1.8% |
9.2% |
0.486 |
-0.043 |
| 76 |
Chase Anderson |
75 |
-1 |
74.2% |
82.1 |
4.37 |
68.0% |
18.4% |
18.8% |
-0.4% |
10.1% |
0.464 |
-0.056 |
| 77 |
Danny Duffy |
79 |
+2 |
72.7% |
88.2 |
5.18 |
73.9% |
20.7% |
19.3% |
1.4% |
11.2% |
0.524 |
-0.059 |
| 78 |
Brandon McCarthy |
78 |
0 |
72.6% |
78.2 |
4.92 |
65.9% |
15.7% |
19.2% |
-3.5% |
6.2% |
0.471 |
0.027 |
| 79 |
Ian Kennedy |
81 |
+2 |
71.1% |
86.2 |
5.09 |
70.3% |
17.7% |
20.9% |
-3.2% |
8.4% |
0.521 |
-0.044 |
| 80 |
Chris Stratton |
82 |
+2 |
70.1% |
87.0 |
4.14 |
65.7% |
17.4% |
18.2% |
-0.8% |
9.2% |
0.503 |
-0.094 |
| 81 |
Sal Romano |
84 |
+3 |
70.0% |
85.0 |
5.40 |
63.2% |
15.6% |
16.5% |
-0.9% |
9.6% |
0.488 |
-0.021 |
| 82 |
Lucas Giolito |
[UR] |
[N/A] |
69.7% |
78.1 |
7.01 |
64.2% |
18.3% |
13.3% |
5.0% |
13.1% |
0.498 |
-0.041 |
| 83 |
Jason Hammel |
83 |
0 |
69.7% |
94.1 |
5.34 |
72.9% |
18.6% |
14.6% |
4.0% |
7.1% |
0.556 |
-0.107 |
| 84 |
Chad Kuhl |
80 |
-4 |
69.0% |
85.0 |
4.55 |
69.8% |
20.5% |
21.7% |
-1.2% |
8.9% |
0.546 |
-0.083 |
| 85 |
Andrew Cashner |
85 |
0 |
68.8% |
82.1 |
4.70 |
64.0% |
16.5% |
18.3% |
-1.9% |
10.4% |
0.509 |
0.002 |
| 86 |
Daniel Mengden |
86 |
0 |
68.8% |
90.2 |
4.47 |
68.5% |
16.7% |
14.5% |
2.2% |
5.0% |
0.540 |
-0.097 |
| 87 |
Mike Leake |
87 |
0 |
68.3% |
100.2 |
4.11 |
68.5% |
15.5% |
14.4% |
1.1% |
5.5% |
0.546 |
-0.113 |
| 88 |
Bartolo Colon |
88 |
0 |
61.0% |
82.2 |
4.90 |
58.5% |
11.5% |
13.9% |
-2.5% |
3.8% |
0.576 |
-0.062 |
|
A couple minor changes have been made in the table since last time:
- Added IP, by request
- Changed “Predicted K%” to “xK%” (to save space)
- Dropped the word “Pitcher” from Pitcher Score, now it’s just “Score” (also to save space)
For Reference:
- “PD Score” is short for plate discipline score, a combined metric of strikeout ability weighted as: 3 points O-Swing%, 3 points Contact%, 3 points SwStr%, 1 point F-Strike%.
- “Score” is a combined metric weighted equally between PD Score and xSLG.
- For both luck indication columns (xK%-K% and SLG-xSLG) positive numbers indicate bad luck so far (likely to regress positively) while negative numbers indicate good luck so far (likely to regress negatively). A higher SLG value is bad for pitchers, and I wanted it to be easy to remember: Positive Numbers = Good Outlook.
- IP, ERA, K%, BB%, and SLG are not included in the calculations, these are only included in the table for reference.
- For any newcomers, to understand the concepts behind these numbers I would recommend reading my introduction piece.
Halfway through the season, three pitchers have definitely separated themselves from the pack. Max Scherzer, Jacob DeGrom and Chris Sale have been head & shoulders above the rest of MLB, their scores tightly bunched up around 103, while the 4th best pitcher is all the way down at 96. Some other pitchers have better ERAs, but my early picks for the Cy Young as of right now would definitely be two of those three guys. All three of them have been elite in both major components – strikeout ability and contact management. These guys are well known as some of the best pitchers in MLB, so there really shouldn’t be any surprises. But outside the top three, there are plenty to talk about. Let’s start with one of the most difficult:
#9 Jon Gray (SP, Colorado Rockies)
Can we nickname him “the Enigma” already? Most of the pitchers in my top 10 have pristine ERAs, because they are good pitchers. And then, there’s Jon Gray. His ERA currently sits at 5.52, which is not an ERA that one typically associates with good pitchers. I honestly wouldn’t blame anyone for thinking I’m crazy to have him up so high on the list. But it’s important to remember that these metrics are not subjective at all. If a pitcher’s rank is way off from expected, we can usually learn something by trying to figure out WHY, rather than dismiss the model. In Gray’s case, the explanation for why he is high on the list is an easy one. He is simply missing the most bats in his career, by far. He has made huge strides in his bat-missing ability, as demonstrated by his Contact% falling by ten percent since last year. But the explanation for his ERA is not as simple. One might assume it’s just his home park – he plays in Colorado, after all, widely recognized as the least pitcher-friendly park in MLB.
Unfortunately for that narrative, it’s simply not the case. His home/road splits, in terms of both ERA and FIP, are essentially identical. Taking a closer look, it seems to me that Gray has been extremely unlucky in 2018. His start against Texas on June 16th is a great example. In that game, in five innings he allowed seven baserunners, including one home run. He gave up six runs in that game (five earned) while striking out nine (40%). That’s textbook sequencing luck, with the walk, multiple hits and the home run all coming in the same inning. Three of the hits that led directly to the runs were groundballs. Oh, and another groundball went for an error that also led to a run. It’s pretty hard to blame Gray for that one – his mistakes were essentially one walk and one homer. With good sequencing luck that’s just one earned run instead of five – a huge difference. And there are several numbers that suggest this is a microcosm of his season so far, not an aberration. For starters, he’s got positive values in both of my luck indication columns, which is more rare than you might think. His BABIP is 40 points above his career number. Lastly, his bullpen has been atrocious at preventing inherited runners from scoring. His overall LOB% of 63% is low – but if you look at the rate limited to his 3rd time through the order, i.e. the times more likely to be the bullpen, that drops all the way to 47%, meaning those runners are scoring more often than not. Terrible.
#14 Jose Berrios (SP, Minnesota Twins)
While it’s not a complete shock for someone as talented and hyped as Berrios to shoot up the rankings, at just 24 years old, it’s still surprising and impressive to me what he’s done so far this year. While he did improve his ERA vastly between 2016 and 2017, his improvements in plate discipline metrics were much more modest, grading out roughly as average last season. Don’t get me wrong, an “average” pitcher at age 23 is still impressive. But this year, he’s truly broken out and taken things to the next level. His metrics are improved across the board, suggesting a rise in his strikeout rate of about five points, which is exactly how much his strikeout rate did rise. No red flags there. On the flip side, he’s also improved his walk rate dramatically for two years running. Those changes are backed up by significant improvements in his O-Swing% and F-Strike%, and so I also believe his now-excellent walk rate.
In 2017, Berrios’ main weakness was lefties. His splits last year were fairly extreme, with a FIP of three against righties, but five against lefties. This year he has basically no splits, putting up similarly great numbers against both righties and lefties. But let’s not get too far ahead of ourselves – it’s too small of a sample size to conclude that his problems with lefties are a thing of the past. I think it’s actually more likely that he will struggle against lefties again in the second half. The reason I say that, is that his BABIP vs. lefties has dropped 70 points from last year, but the batted ball profile didn’t change barely at all. So I think some good fortune has masked his weakness against lefties this year, rather than him figuring everything out. In the end, the strikeout and walk improvements are very believable, but I suspect his contact management is likely to regress in the second half. The future is very bright for Jose, but he’s not a capital-A Ace, quite yet.
#25 Corey Kluber (SP, Cleveland Indians)
Kluber has easily been the most contentious pitcher in my rankings all year. Every week, someone asks – “Why is Kluber so low? He’s easily top 3”. And over the past couple years overall, that is true. He is a fantastic pitcher. But the simple fact is that he just hasn’t pitched the same this year as he did last year. Specifically, he has not been missing bats at the same rate. In the full season 2017 rankings (which can be found at the bottom of my introduction piece here) he ranked #1 overall. So I want to be absolutely clear – the model is not biased against him whatsoever, he is just pitching differently. And it’s not just a matter of early-season struggles either. Kluber is known to start off the season poorly, and in 2017 he lived up to that reputation. But by the end of June, those struggles were long in the rear view mirror. Here is a snapshot of his plate discipline metrics, 1st half of 2017 vs 1st half of 2018:
| Time Period |
Sw-Str% |
Contact% |
O-Swing% |
| 1st Half 2017 |
15.1% |
68.1% |
35.8% |
| 1st Half 2018 |
10.7% |
77.3% |
35.3% |
|
His O-Swing% has remained elite, which makes sense because his walk rate has also remained elite this year. But the other metrics point towards a drop in his strikeout rate of roughly ten points, which is a huge, huge difference. And in fact, Kluber’s strikeout rate is down seven points this year. The numbers say it’s likely to drop even further if he doesn’t change anything. This is something that can go unnoticed when a pitcher is still performing very well. But to me the data is pretty clear in that Kluber has been lucky this year to have such a pristine ERA. If he keeps pitching like this, his second half could be very disappointing. That BABIP is currently 55 points under his career, and his LOB of 85% is also high, to go along with negative numbers in both luck columns above.
There is one easily-identifiable thing Kluber could do to help regain his mojo. Last year, a huge part of his success was increasing the slider usage from 20% up to 27%. This is a story we’ve seen time and again – identify your best pitch, and throw it more often. This year, his slider usage is back down closer to 20%. That slider is still allowing an wRC+ of negative three, so I have to wonder – why not throw it more often? It worked incredibly well for him last year, and as the saying goes – “If it ain’t broke, don’t fix it”.
#38 Zack Greinke (SP, Arizona D-Backs)
Greinke is another guy who generates a fair amount of discussion due to his low placement in the rankings. He was in my top 10 last year, so #38 is a very noticeable dropoff. Is it possible Greinke’s age is starting to catch up with him? He is 34 after all. His velocity is down a tick this year as well. At first glance, maybe that could explain his declining metrics. All three of the main metrics are trending the wrong direction for him this year, although they are more incremental changes than huge drops, which is something that would fit a small decline in velocity. The metrics would suggest a drop in his strikeout rate of about 3% from last year. His actual K% has dropped less than 1 percent, so he’s been a tiny bit fortunate in that area. Overall though, we are still working within the margin of error; it’s not a big enough difference to mean much. His actual strikeout rate of 26% is within the ballpark of what his metrics would suggest. So what gives?
It seems that contact management has been Greinke’s main weakness in 2018. His xSLG this year is nowhere near elite at .474, which is 40 points worse than league average, and 76 points worse than he did last year. He went from above average in that respect, to well below average. Looking a bit closer, it seems to me that something is off with his slider this year. It doesn’t seem related to velocity, as the slider hasn’t really budged velocity-wise. But hitters seem to be squaring it up MUCH better than previously in Greinke’s career. His slider has a negative overall pitch value in 2018, something that has never happened in his career. Actually it’s been the opposite – the slider has the best value of all his pitches, both overall and on a per-pitch basis. For his career it has allowed an wRC+ of just 38. This year, 105. Having looked at quite a few slider pitch-splits this year, this definitely stands out to me as an anomaly. I thought maybe he was tipping his pitches, but a glance at his release points doesn’t show anything out of the ordinary. So my best theory is this:
Greinke’s slider location, 2017:
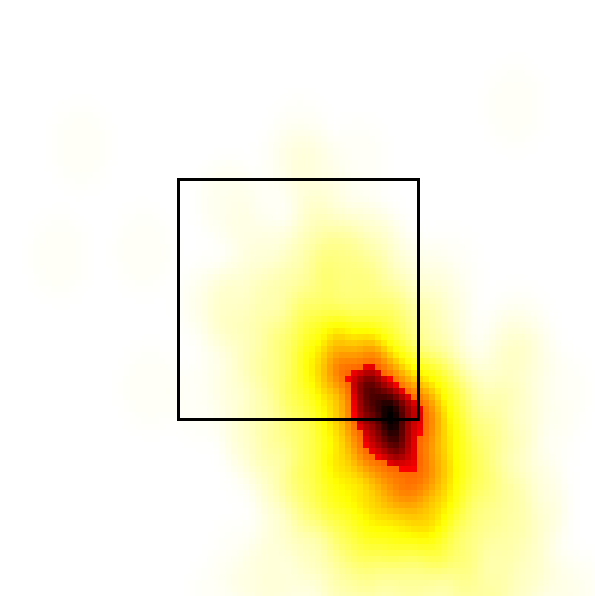
Greinke’s slider location, 2018:
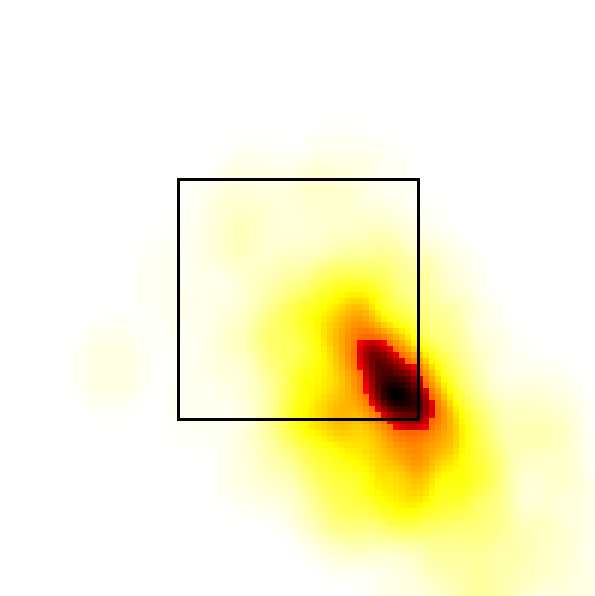
He’s simply getting more of the plate than you want for a slider, with that entire dark red portion squarely within the zone. That could definitely explain why hitters are able to square it up much better. It’s the best theory I’ve got, at least. The bright side is that pitch location is fixable.
Moving on, here is the data for the non-qualified SP (10 IP minimum):
| Name |
Team |
Score |
IP |
ERA |
PD Score |
xK% |
K% |
xK%-K% |
BB% |
xSLG |
SLG-xSLG |
| Freddy Peralta |
Brewers |
106.7% |
22.2 |
1.59 |
100.3% |
31.9% |
41.7% |
-9.8% |
10.7% |
0.246 |
-0.086 |
| Matt Strahm |
Padres |
104.8% |
13.1 |
1.35 |
103.1% |
31.1% |
35.3% |
-4.2% |
5.9% |
0.290 |
-0.061 |
| Noah Syndergaard |
Mets |
98.8% |
64.2 |
3.06 |
99.1% |
30.6% |
28.3% |
2.3% |
4.8% |
0.343 |
0.021 |
| Jonathan Loaisiga |
Yankees |
98.6% |
14.0 |
1.93 |
92.6% |
26.9% |
31.6% |
-4.7% |
14.0% |
0.303 |
-0.079 |
| Shohei Ohtani |
Angels |
96.9% |
49.1 |
3.10 |
99.1% |
34.0% |
30.5% |
3.5% |
10.0% |
0.368 |
-0.048 |
| Domingo German |
Yankees |
94.9% |
49.0 |
5.88 |
102.1% |
31.8% |
27.1% |
4.7% |
6.8% |
0.416 |
0.044 |
| Ross Stripling |
Dodgers |
92.6% |
62.0 |
2.32 |
83.9% |
22.4% |
29.3% |
-6.9% |
2.4% |
0.325 |
0.066 |
| Kenta Maeda |
Dodgers |
91.2% |
67.0 |
3.49 |
91.3% |
27.5% |
27.3% |
0.2% |
9.4% |
0.392 |
-0.018 |
| Jack Flaherty |
Cardinals |
90.6% |
57.2 |
2.50 |
85.1% |
26.9% |
29.4% |
-2.6% |
6.9% |
0.359 |
-0.034 |
| John Gant |
Cardinals |
90.0% |
22.0 |
4.09 |
84.8% |
24.9% |
25.3% |
-0.4% |
9.9% |
0.365 |
-0.090 |
| Johnny Cueto |
Giants |
89.8% |
32.0 |
0.84 |
76.2% |
22.3% |
22.2% |
0.0% |
5.1% |
0.311 |
-0.105 |
| Masahiro Tanaka |
Yankees |
89.5% |
72.2 |
4.58 |
98.1% |
28.8% |
24.8% |
4.0% |
6.5% |
0.460 |
-0.019 |
| Trevor Cahill |
Athletics |
89.2% |
48.2 |
2.77 |
92.2% |
28.5% |
25.0% |
3.5% |
5.9% |
0.425 |
-0.072 |
| Walker Buehler |
Dodgers |
88.8% |
51.1 |
2.63 |
72.4% |
19.1% |
26.7% |
-7.6% |
5.5% |
0.298 |
-0.025 |
| Robbie Ray |
Diamondbacks |
88.7% |
27.2 |
4.88 |
92.1% |
30.1% |
36.3% |
-6.3% |
13.7% |
0.432 |
-0.013 |
| Carlos Martinez |
Cardinals |
88.2% |
72.2 |
3.22 |
75.5% |
20.9% |
22.4% |
-1.6% |
13.2% |
0.328 |
-0.022 |
| Brad Keller |
Royals |
88.0% |
25.2 |
2.45 |
76.9% |
21.8% |
16.0% |
5.8% |
10.4% |
0.340 |
-0.063 |
| CC Sabathia |
Yankees |
87.7% |
76.1 |
3.18 |
81.5% |
22.1% |
18.6% |
3.5% |
6.1% |
0.374 |
0.025 |
| Austin Bibens-Dirkx |
Rangers |
87.5% |
22.2 |
3.57 |
87.0% |
22.7% |
17.5% |
5.2% |
6.2% |
0.413 |
-0.038 |
| Jordan Montgomery |
Yankees |
87.5% |
27.1 |
3.62 |
79.9% |
21.5% |
19.8% |
1.7% |
10.3% |
0.366 |
-0.010 |
| Hyun-Jin Ryu |
Dodgers |
87.1% |
29.2 |
2.12 |
79.3% |
24.8% |
31.3% |
-6.5% |
8.7% |
0.367 |
-0.059 |
| Shane Bieber |
Indians |
87.0% |
18.1 |
2.45 |
86.8% |
26.5% |
29.0% |
-2.5% |
4.0% |
0.419 |
0.033 |
| Garrett Richards |
Angels |
86.3% |
68.1 |
3.42 |
84.0% |
25.8% |
26.8% |
-1.0% |
11.0% |
0.410 |
-0.050 |
| Mike Montgomery |
Cubs |
86.0% |
35.2 |
2.02 |
83.7% |
21.6% |
18.0% |
3.6% |
6.5% |
0.411 |
-0.130 |
| Nick Kingham |
Pirates |
85.4% |
35.1 |
3.82 |
85.6% |
25.0% |
24.3% |
0.7% |
4.9% |
0.432 |
-0.066 |
| Andrew Heaney |
Angels |
84.8% |
78.2 |
3.43 |
82.3% |
23.3% |
22.5% |
0.7% |
6.6% |
0.418 |
-0.037 |
| Clayton Kershaw |
Dodgers |
83.9% |
52.0 |
2.94 |
81.2% |
22.5% |
26.6% |
-4.1% |
5.6% |
0.422 |
-0.021 |
| Seth Lugo |
Mets |
83.9% |
23.0 |
3.52 |
77.3% |
21.6% |
26.5% |
-4.9% |
5.9% |
0.397 |
-0.003 |
| Sam Gaviglio |
Blue Jays |
83.6% |
36.1 |
4.21 |
79.9% |
20.8% |
22.1% |
-1.3% |
6.5% |
0.418 |
0.019 |
| Joe Musgrove |
Pirates |
83.5% |
33.1 |
4.59 |
76.5% |
20.4% |
21.0% |
-0.7% |
6.1% |
0.396 |
0.026 |
| Ryne Stanek |
Rays |
83.5% |
10.0 |
1.80 |
87.0% |
26.6% |
26.3% |
0.3% |
10.5% |
0.466 |
-0.290 |
| Caleb Smith |
Marlins |
83.3% |
77.1 |
4.19 |
82.9% |
24.3% |
27.0% |
-2.7% |
10.1% |
0.442 |
-0.054 |
| Anibal Sanchez |
Braves |
83.1% |
44.0 |
2.86 |
76.8% |
19.9% |
23.7% |
-3.8% |
7.3% |
0.404 |
-0.008 |
| Chris Archer |
Rays |
83.0% |
76.1 |
4.24 |
86.4% |
26.4% |
23.7% |
2.7% |
8.1% |
0.469 |
-0.050 |
| Zach Eflin |
Phillies |
83.0% |
49.2 |
3.44 |
76.1% |
21.4% |
24.6% |
-3.3% |
5.8% |
0.400 |
-0.012 |
| Yu Darvish |
Cubs |
82.7% |
40.0 |
4.95 |
78.2% |
24.1% |
27.2% |
-3.2% |
11.7% |
0.418 |
0.007 |
| Dereck Rodriguez |
Giants |
81.2% |
27.1 |
3.95 |
76.7% |
20.9% |
20.2% |
0.6% |
5.0% |
0.429 |
-0.016 |
| Fernando Romero |
Twins |
81.0% |
51.1 |
4.38 |
79.0% |
22.8% |
19.6% |
3.2% |
8.5% |
0.446 |
-0.037 |
| Brent Suter |
Brewers |
81.0% |
75.2 |
4.28 |
79.7% |
21.2% |
19.4% |
1.8% |
5.1% |
0.451 |
-0.018 |
| Caleb Ferguson |
Dodgers |
80.9% |
10.2 |
7.59 |
78.9% |
26.7% |
25.0% |
1.7% |
12.5% |
0.447 |
-0.047 |
| Junior Guerra |
Brewers |
80.6% |
76.2 |
2.82 |
75.5% |
21.8% |
23.3% |
-1.6% |
9.5% |
0.428 |
-0.081 |
| Wilmer Font |
Rays |
80.6% |
16.0 |
1.69 |
67.9% |
19.8% |
23.4% |
-3.7% |
9.4% |
0.378 |
-0.068 |
| Carlos Rodon |
White Sox |
80.3% |
24.1 |
3.70 |
75.5% |
19.7% |
18.5% |
1.2% |
6.8% |
0.433 |
-0.063 |
| Jeremy Hellickson |
Nationals |
80.0% |
43.1 |
2.28 |
77.3% |
20.5% |
20.7% |
-0.3% |
3.7% |
0.448 |
-0.087 |
| Hector Velazquez |
Red Sox |
80.0% |
10.2 |
2.53 |
91.4% |
23.4% |
22.7% |
0.6% |
4.6% |
0.543 |
-0.091 |
| Nick Tropeano |
Angels |
79.8% |
54.0 |
4.83 |
83.7% |
25.5% |
19.6% |
5.9% |
8.9% |
0.494 |
-0.019 |
| Michael Soroka |
Braves |
79.8% |
25.2 |
3.51 |
78.7% |
22.0% |
18.6% |
3.4% |
6.2% |
0.461 |
-0.048 |
| Wade LeBlanc |
Mariners |
79.0% |
52.2 |
2.91 |
79.5% |
19.3% |
19.7% |
-0.4% |
5.6% |
0.476 |
-0.088 |
| Jordan Lyles |
Padres |
78.8% |
47.0 |
4.79 |
72.6% |
17.9% |
19.9% |
-2.1% |
5.5% |
0.433 |
0.051 |
| Yonny Chirinos |
Rays |
78.3% |
22.2 |
4.37 |
75.9% |
20.1% |
21.0% |
-0.9% |
8.0% |
0.462 |
-0.043 |
| Ryan Yarbrough |
Rays |
78.3% |
20.2 |
5.23 |
70.7% |
18.4% |
19.1% |
-0.7% |
6.7% |
0.427 |
-0.002 |
| Trevor Richards |
Marlins |
78.3% |
44.0 |
4.91 |
71.4% |
19.2% |
20.9% |
-1.8% |
10.5% |
0.432 |
-0.014 |
| Tyler Chatwood |
Cubs |
78.3% |
68.1 |
3.95 |
65.8% |
19.1% |
20.3% |
-1.3% |
20.0% |
0.395 |
-0.064 |
| Blaine Hardy |
Tigers |
78.2% |
43.2 |
3.71 |
70.2% |
17.1% |
16.6% |
0.5% |
5.5% |
0.426 |
0.005 |
| Jason Vargas |
Mets |
77.9% |
37.2 |
8.60 |
82.2% |
22.9% |
17.8% |
5.1% |
7.8% |
0.509 |
0.104 |
| Dylan Covey |
White Sox |
77.9% |
44.1 |
3.45 |
64.9% |
16.3% |
18.7% |
-2.4% |
10.4% |
0.394 |
-0.072 |
| Joey Lucchesi |
Padres |
77.6% |
53.0 |
3.57 |
75.9% |
22.8% |
25.1% |
-2.3% |
8.7% |
0.471 |
-0.037 |
| Paul Blackburn |
Athletics |
77.1% |
17.1 |
8.83 |
72.3% |
17.4% |
14.3% |
3.1% |
5.2% |
0.454 |
0.053 |
| Chris Bassitt |
Athletics |
77.1% |
16.1 |
3.86 |
69.3% |
14.6% |
17.8% |
-3.3% |
4.1% |
0.434 |
-0.125 |
| Jordan Zimmermann |
Tigers |
77.0% |
41.1 |
4.35 |
76.5% |
19.9% |
22.5% |
-2.7% |
5.8% |
0.483 |
-0.073 |
| Madison Bumgarner |
Giants |
76.8% |
25.1 |
3.20 |
67.2% |
16.2% |
16.2% |
0.0% |
6.7% |
0.424 |
0.008 |
| Jaime Barria |
Angels |
76.7% |
50.1 |
3.40 |
84.6% |
24.2% |
20.1% |
4.1% |
6.7% |
0.541 |
-0.112 |
| Nathan Eovaldi |
Rays |
76.6% |
35.1 |
4.08 |
74.5% |
17.9% |
22.4% |
-4.6% |
3.7% |
0.476 |
-0.051 |
| Wei-Yin Chen |
Marlins |
75.9% |
49.2 |
6.70 |
67.9% |
17.0% |
15.6% |
1.4% |
10.4% |
0.440 |
0.095 |
| Francisco Liriano |
Tigers |
75.5% |
61.2 |
3.94 |
79.4% |
23.8% |
19.1% |
4.7% |
12.7% |
0.523 |
-0.157 |
| Frankie Montas |
Athletics |
75.4% |
36.2 |
3.68 |
62.0% |
15.5% |
13.9% |
1.6% |
8.2% |
0.408 |
0.000 |
| Clay Buchholz |
Diamondbacks |
74.9% |
38.2 |
2.56 |
74.6% |
18.9% |
20.3% |
-1.4% |
4.6% |
0.499 |
-0.126 |
| Marcus Stroman |
Blue Jays |
74.8% |
42.1 |
6.80 |
73.1% |
21.0% |
18.8% |
2.2% |
9.6% |
0.490 |
-0.053 |
| Yovani Gallardo |
Rangers |
74.5% |
10.1 |
7.84 |
58.9% |
12.6% |
14.9% |
-2.4% |
10.6% |
0.399 |
0.125 |
| Mike Fiers |
Tigers |
74.4% |
77.2 |
4.29 |
71.3% |
18.3% |
17.3% |
1.0% |
5.4% |
0.483 |
0.015 |
| Luis Perdomo |
Padres |
74.4% |
14.0 |
8.36 |
68.5% |
21.2% |
22.1% |
-0.9% |
11.7% |
0.465 |
0.058 |
| Matt Moore |
Rangers |
74.1% |
55.0 |
8.02 |
75.2% |
20.1% |
14.7% |
5.4% |
9.3% |
0.513 |
0.056 |
| Erick Fedde |
Nationals |
73.6% |
22.0 |
5.32 |
72.9% |
19.6% |
17.4% |
2.2% |
6.5% |
0.505 |
-0.011 |
| Andrew Triggs |
Athletics |
73.0% |
41.1 |
5.23 |
75.9% |
21.4% |
23.6% |
-2.3% |
9.9% |
0.533 |
-0.120 |
| Adam Wainwright |
Cardinals |
72.9% |
18.0 |
4.00 |
55.9% |
14.0% |
17.1% |
-3.1% |
15.9% |
0.400 |
0.035 |
| Steven Wright |
Red Sox |
72.7% |
24.0 |
4.13 |
67.0% |
19.0% |
16.8% |
2.2% |
9.9% |
0.478 |
-0.122 |
| Zach Davies |
Brewers |
72.3% |
43.0 |
5.23 |
69.1% |
18.7% |
16.3% |
2.4% |
9.0% |
0.497 |
-0.003 |
| Brandon Woodruff |
Brewers |
72.2% |
15.2 |
6.32 |
65.8% |
19.2% |
18.1% |
1.1% |
12.5% |
0.476 |
-0.083 |
| Mike Minor |
Rangers |
72.2% |
78.1 |
5.06 |
75.6% |
20.4% |
19.6% |
0.8% |
5.7% |
0.542 |
-0.045 |
| Eric Lauer |
Padres |
72.2% |
57.0 |
5.05 |
61.8% |
15.8% |
19.3% |
-3.6% |
10.2% |
0.450 |
0.041 |
| Drew Pomeranz |
Red Sox |
72.1% |
37.0 |
6.81 |
65.2% |
16.7% |
20.8% |
-4.2% |
12.1% |
0.473 |
0.070 |
| Andrew Suarez |
Giants |
71.7% |
65.0 |
4.43 |
65.8% |
15.7% |
23.0% |
-7.3% |
4.9% |
0.482 |
-0.037 |
| David Hess |
Orioles |
71.3% |
41.1 |
5.44 |
68.6% |
16.4% |
13.3% |
3.1% |
9.4% |
0.507 |
-0.007 |
| Matt Harvey |
– – – |
71.3% |
69.0 |
4.83 |
64.5% |
16.5% |
17.4% |
-0.9% |
5.5% |
0.480 |
-0.031 |
| Jaime Garcia |
Blue Jays |
71.0% |
61.1 |
6.16 |
68.1% |
19.0% |
19.9% |
-1.0% |
11.0% |
0.508 |
0.004 |
| Ty Blach |
Giants |
70.9% |
60.2 |
4.90 |
60.7% |
14.7% |
11.1% |
3.6% |
8.5% |
0.460 |
-0.047 |
| Jake Faria |
Rays |
70.4% |
47.2 |
5.48 |
68.1% |
19.0% |
18.2% |
0.7% |
10.8% |
0.516 |
-0.093 |
| Dillon Peters |
Marlins |
70.0% |
24.2 |
5.84 |
62.0% |
16.3% |
14.4% |
1.9% |
11.7% |
0.480 |
-0.011 |
| Jeff Samardzija |
Giants |
69.9% |
35.2 |
6.56 |
68.8% |
17.7% |
15.7% |
2.0% |
13.9% |
0.527 |
-0.084 |
| Elieser Hernandez |
Marlins |
69.6% |
22.0 |
4.50 |
71.6% |
21.2% |
18.7% |
2.5% |
5.5% |
0.549 |
0.011 |
| Anthony DeSclafani |
Reds |
69.5% |
22.0 |
4.09 |
59.6% |
14.5% |
19.6% |
-5.2% |
8.7% |
0.470 |
0.030 |
| Eric Skoglund |
Royals |
69.1% |
49.2 |
6.70 |
70.3% |
17.3% |
18.0% |
-0.7% |
6.5% |
0.548 |
-0.018 |
| Alex Cobb |
Orioles |
68.8% |
70.0 |
6.56 |
63.9% |
15.2% |
15.5% |
-0.3% |
5.7% |
0.508 |
0.055 |
| Matt Wisler |
Braves |
68.7% |
17.1 |
3.63 |
73.6% |
20.7% |
18.6% |
2.1% |
7.1% |
0.575 |
-0.160 |
| Dan Straily |
Marlins |
68.6% |
52.1 |
4.82 |
76.3% |
21.8% |
19.6% |
2.2% |
10.9% |
0.594 |
-0.122 |
| Brandon Finnegan |
Reds |
68.0% |
20.2 |
7.40 |
63.0% |
16.0% |
13.6% |
2.4% |
14.6% |
0.513 |
0.040 |
| Ben Lively |
Phillies |
67.2% |
23.2 |
6.85 |
62.8% |
17.9% |
19.1% |
-1.3% |
8.7% |
0.522 |
0.023 |
| Kendall Graveman |
Athletics |
67.0% |
34.1 |
7.60 |
67.6% |
17.1% |
17.1% |
0.0% |
8.2% |
0.557 |
-0.015 |
| Adam Plutko |
Indians |
66.8% |
29.0 |
4.66 |
70.3% |
16.6% |
17.5% |
-0.9% |
6.7% |
0.578 |
-0.042 |
| John Lamb |
Angels |
66.7% |
10.0 |
7.20 |
72.3% |
17.8% |
22.0% |
-4.3% |
8.0% |
0.593 |
0.124 |
| Doug Fister |
Rangers |
66.4% |
66.0 |
4.50 |
55.9% |
11.8% |
13.8% |
-2.0% |
6.6% |
0.487 |
-0.031 |
| Rich Hill |
Dodgers |
65.0% |
35.2 |
5.30 |
61.8% |
15.6% |
22.2% |
-6.6% |
9.9% |
0.546 |
-0.046 |
| Daniel Gossett |
Athletics |
64.9% |
24.1 |
5.18 |
66.2% |
15.5% |
11.8% |
3.7% |
7.8% |
0.576 |
-0.081 |
| Brett Anderson |
Athletics |
64.9% |
15.1 |
7.63 |
67.1% |
18.0% |
11.1% |
6.9% |
8.3% |
0.582 |
0.009 |
| Joe Biagini |
Blue Jays |
64.9% |
18.2 |
7.71 |
65.9% |
16.7% |
14.4% |
2.3% |
10.0% |
0.574 |
-0.080 |
| Steven Brault |
Pirates |
63.8% |
26.0 |
5.54 |
69.2% |
20.0% |
13.4% |
6.6% |
12.5% |
0.611 |
-0.213 |
| Taijuan Walker |
Diamondbacks |
62.7% |
13.0 |
3.46 |
57.6% |
15.1% |
16.1% |
-1.1% |
8.9% |
0.548 |
-0.156 |
| Homer Bailey |
Reds |
62.1% |
62.0 |
6.68 |
64.2% |
15.8% |
13.0% |
2.8% |
8.2% |
0.600 |
-0.036 |
| Hector Santiago |
White Sox |
61.1% |
32.1 |
6.12 |
62.0% |
16.5% |
15.9% |
0.6% |
15.2% |
0.598 |
-0.027 |
| Jarlin Garcia |
Marlins |
61.0% |
33.0 |
3.55 |
65.1% |
18.0% |
16.7% |
1.3% |
9.9% |
0.620 |
-0.222 |
| Bryan Mitchell |
Padres |
59.3% |
32.0 |
6.47 |
47.1% |
11.8% |
10.4% |
1.4% |
16.9% |
0.523 |
-0.027 |
| Ryan Carpenter |
Tigers |
57.4% |
12.0 |
6.75 |
58.5% |
14.9% |
10.7% |
4.2% |
3.6% |
0.624 |
-0.047 |
| Matt Koch |
Diamondbacks |
56.9% |
69.2 |
4.52 |
60.7% |
13.5% |
12.1% |
1.4% |
5.9% |
0.646 |
-0.140 |
| Miguel Gonzalez |
White Sox |
56.8% |
12.1 |
12.41 |
66.3% |
15.5% |
7.6% |
7.9% |
9.1% |
0.684 |
0.099 |
| Josh Tomlin |
Indians |
55.9% |
30.0 |
8.10 |
73.8% |
19.1% |
12.9% |
6.2% |
3.6% |
0.746 |
-0.019 |
| Carson Fulmer |
White Sox |
55.3% |
31.0 |
8.13 |
56.5% |
14.6% |
16.6% |
-2.1% |
15.3% |
0.640 |
-0.136 |
| Martin Perez |
Rangers |
55.1% |
22.1 |
9.67 |
51.8% |
11.6% |
10.9% |
0.6% |
10.1% |
0.610 |
0.060 |
| Chris Tillman |
Orioles |
51.6% |
26.2 |
10.46 |
49.4% |
11.9% |
9.5% |
2.4% |
12.4% |
0.641 |
0.011 |
|
Madison Bumgarner (SP, San Francisco Giants)
For the second season in a row, injuries to the Giants’ ace have put a damper on their playoff hopes. Now that he’s returned and pitched a handful of games, there are a lot of eyes on him. Everyone wants to know – is he the same pitcher? Last year he wasn’t, and then he got injured again. And at first glance, the metrics are certainly not great. That 16% expected K-rate is way, way down from his career rate of 24%. But there are also reasons to be hopeful. For starters, he pitched yesterday which is not included in the data. In that game he struck out eight, with a Contact% of 77%. This was against the Rockies, one of the worst offense away from Coors, so take it with a grain of salt – but at least his metrics as well as strikeout rate are moving in the right direction. His actual K% rose by three percent from that one game.
Looking at his pitch-splits, something seems off with his curveball. Bumgarner’s curve has long been his best pitch, generating a 16% whiff rate and allowing a wRC+ of just 43 for his career. This year, the results are still outstanding with an wRC+ of negative 24. But instead of missing bats, it’s generating weak contact. The whiff rate is down to just 8.5%, but the LD% is also super low at just 7%. Actually, batters have only got a single hit off Bumgarner’s 82 curveballs thrown. This was a home run, leaving his BABIP for curveballs at precisely .000. And overall his BABIP of .226 is certainly a red flag. But at the same time, there doesn’t seem to be anything wrong with his movement numbers, velocity, or release points for the curveball. So I want to believe the whiffs and strikeouts are coming back, and could help counteract any potential regression coming from BABIP. His velocity is also trending upward so far, an indication that he’s rebuilding his strength after the injury. I’ll be keeping a close eye on him, the jury is still out – but there are some hopeful signs pointing towards a return to form.
Walker Buehler (SP, Los Angeles Dodgers)
For the first couple months of the season, Buehler stood out as having the largest difference between expected K% and actual K% of anyone in the league. The difference was about 15% (15 vs. 30) as of mid-May, where I rated him a solid “SELL”. Since then, the results have still been pretty positive for the most part. Overall he’s continued to pitch well, with his ERA as well as FIP/SIERA looking very nice. He has also missed more bats since then, increasing his expected K% from about 16 up to the current level of 19%, which is at least average-ish. At the same time, his actual K% has dropped about 3.5%. So his gap is certainly closing, as we should expect, but in his case it’s coming about equally from both sides, rather than predominantly the K% moving. In past analysis, we found the gap closure is typically attributed about 75% to the strikeout rate changing, not the metrics, so he is bucking the trend a bit.
Since that update, he has undoubtedly done better than I expected, as reflected by his overall score rising to 88. But I think I still have to rate him as a “SELL”. Even with the significant gap closure, he still sports one of the largest K% discrepancies. But mainly his schedule has just been incredibly fortunate. Six of his nine starts have come against the Padres, Marlins and Rockies, which are three of the most inept offenses in the game. His tougher matchups, the Giants and Reds, have been at home. Truly he’s only had one bad matchup all season – against the Rockies in Coors, where he only struck out two and gave up 4 ER. Between that, the K% discrepancy, and potential innings limits, I think that is enough to take advantage of his current stat line and cash in the chips.


I don’t think the sell tag is going to work out great for Buehler. I think his DL stint means that he will be taking regular turns for the remainder of the fantasy season, which is great. His command and GB rate mean that he doesn’t have to get everyone out with Ks. That is absent from this analysis, no? It isn’t super common to limit walks, throw GBs and have some K ability. I am not sure that he will ever be a workhorse, but I think he has some of the best stuff in MLB. I also get a feeling that he is figuring things out when I watch him pitch. Most rookies are working unsustainable stuff, but I think there is more in the tank with WB. I think this is the last opportunity to buy before he comes back… unless he has a rough first game back or something, but I would bet that most owners are worried about his health… which should be a non-issue – this is just limiting his innings masked as a DL stint. I don’t have confidence that he won’t get hurt, but he currently is not and I don’t think many people know that. I was watching the game where he was removed with injury – there was no injury, no trainers – he went and sat on the bench with a bewildered look on his face…
That’s completely fair! I wouldn’t say command and GB rate are completely absent from the analysis, but yes it is tilted a bit in favor of strikeout pitchers for sure. That’s mainly just because this is for fantasy, where a strikeout is worth more than a regular out. But I do agree in general that he has a very promising career in front of him and should be a productive MLB pitcher.
Correction – now is the time to buy! Probably should have went with a rehab assignment lol
Jon Gray has been beat up by SF this year. You would sit him tonight @SF, right?
Also, who would you say has a better year ROS: Berrios or Snell?
No, I am throwing him out there in the league I own him. Pitcher vs. individual team numbers don’t tend to hold up over time, and AT&T is a great place to pitch. If you can’t start a guy in SF, he’s probably not worth owning, even with the Giants offensive improvement over the previous years.
Oh well he got shelled again lol
Oops – missed your second question – but I’d take Snell ROS over Berrios.
Awesome stuff Chaz. This is legitimately the best objective measure of pitching performance you will find anywhere on the internet. Keep these coming. Fantastic work!
Thank you so much!
Thanks for putting this together!
Can we talk about Tyler Anderson? I’m curious to know how his ranking is so high when his actual stats are just mediocre and similar to the last season stat.
watching this list throughout the season, you would expect that, though there may be a few rare outliers, most the rankings would eventually align with player performance. At one point is the amount of rare outliers significant enough to question the model itself? I understand researching into why someone like J Gray is ranked so high and explain it, but when you are having to explain 1/3 of the list because their real life production does not seem to mirror their ranking on this list, then I would think maybe the model needs tweaked to try and more accurately represent what we see happening, or to better predict future production. If the model doesn’t do either of those two objectives, then whats the point of ranking them? what value do I get out this list? I cant use it for determining trades. The eye test and 3 months worth of production say you are crazy to go with luis castillo over mikolas and stras and price, or gray and velazques over corey kluber, and many more examples. Don’t want to be a party pooper on this list, just want to understand what I can or should be using this list for when it comes to making fantasy decisions.