


It’s finally over.
With Trevor Bauer signing his whopping $102 million deal last week, the most highly touted free agent from this year’s class is off the table.
But as with every contract of this magnitude, fans are left questioning, “Are these huge contracts worth it?”
Okay, I’ll be honest, this is a hard question to answer.
There are so many different ways to measure “worth.” For example, is a contract “worth it” if it results in a championship even if the player plays terribly throughout the duration of his contract? If that’s the case, then Barry Zito’s seven-year, $126 million contract in 2006 has incredible value.
But what if a contract’s only “worth it” when a player lives up to the contract individually, regardless of how his team performs? If this is the standard, then by no means was Zito’s contract a good one.
The fact that these different stances exist seems to indicate that “worth” is subjective. It’s hard to objectively define the worth of a contract, but that doesn’t mean we’re not going to try.
So, here’s how we’re going to evaluate it. We’ll first look at how players are paid. We’ll investigate which statistic is the biggest determiner of these huge free-agent contracts.
Once we figure out an answer to this question, then we’ll see if it makes sense to pay players according to these standards.
Alright, let’s go.
How are Players Paid?
First, let’s break up the free-agent market between position players and pitchers since they are evaluated using fundamentally different statistics (i.e., pitchers probably aren’t being paid for how many home runs they hit in a given season). Second, to make things a little more simple, let’s just focus on the single largest contract (in terms of total contract value rather than average salary per season) signed by a free agent every offseason for both of these respective groups of players. If we take a trip down memory lane, here is a table of the largest contract signed by a free-agent pitcher and free-agent position player from 2005-2019.
| Offseason | Position Player | Year | Amount | Average Annual Salary | Pitcher | Year | Amount | Average Annual Salary |
|---|---|---|---|---|---|---|---|---|
| 2019 | Anthony Rendon | 7 | 245 | 35 | Gerrit Cole | 9 | 324 | 36 |
| 2018 | Bryce Harper | 13 | 330 | 25.4 | Patrick Corbin | 6 | 140 | 23.3 |
| 2017 | Eric Hosmer | 8 | 144 | 18 | Yu Darvish | 6 | 126 | 21 |
| 2016 | Yoenis Cespedes | 4 | 110 | 27.5 | Aroldis Chapman | 5 | 86 | 17.2 |
| 2015 | Jason Heyward | 8 | 184 | 23 | David Price | 7 | 217 | 31 |
| 2014 | Pablo Sandoval | 5 | 95 | 19 | Max Scherzer | 7 | 210 | 30 |
| 2013 | Robinson Cano | 10 | 240 | 24 | Masahiro Tanaka | 7 | 155 | 22.1 |
| 2012 | Josh Hamilton | 5 | 123 | 24.6 | Zack Greinke | 6 | 147 | 24.5 |
| 2011 | Albert Pujols | 10 | 250 | 25 | C.J. Wilson | 5 | 77.5 | 15.5 |
| 2010 | Carl Crawford | 7 | 142 | 20.3 | Cliff Lee | 5 | 120 | 24 |
| 2009 | Matt Holliday | 7 | 120 | 17.1 | John Lackey | 5 | 82.5 | 16.5 |
| 2008 | Mark Teixeira | 8 | 180 | 22.5 | CC Sabathia | 7 | 161 | 23 |
| 2007 | Alex Rodriguez | 10 | 275 | 27.5 | Carlos Silva | 4 | 48 | 12 |
| 2006 | Alfonso Soriano | 8 | 136 | 17 | Barry Zito | 7 | 126 | 18 |
| 2005 | Paul Konerko | 5 | 60 | 12 | Kevin Millwood | 5 | 60 | 12 |
| Average | 7.7 | 175.6 | 22.9 | 6.1 | 138.7 | 22.7 |
If you look at this table, the average position player in this table signed a 7.7-year contract worth $175.6 million, while the average pitcher in this table signed a 6.1-year contract worth $138.7 million. So just at first glance, the highest-paid free-agent position player usually received a slightly longer contract and slightly more money overall, but in terms of average salary per season, both received roughly the same amount ($22.9 million for position players and $22.7 million for pitchers).
Now, let’s try to get a more detailed analysis of how these free agents are paid, starting with the position players.
When I first started this project, I thought if there was a single statistic that would be the best at predicting a player’s contract, it’d be WAR. I mean, it makes sense, right? No one’s really paying for a player just based on his batting average or just based on how many RBI’s he hits, so using a more inclusive statistic like WAR to predict a contract’s value seemed to be a good idea.
But then I got sad.
If you take the list of free-agent position players above and look at the correlation between the WAR of the player from the season prior to the signing of his huge contract and the average annual salary of his huge contract, r = 0.29.
There is basically no correlation between these two numbers.
Note: In case you don’t know anything about correlation, r is a statistic with values between -1 and 1. The closer the value is to 0, the less correlation there is. The closer the value is to the extremes (-1 and 1), the more correlation there is.
So, I was moping around in my chair thinking, “Man, I guess the past three hours of inputting data by hand was a waste of time,” and then it hit me: I have an economics degree, I should probably use it.
You see, I had totally forgotten that inflation was a thing, and since we’re dealing with money over an extended period of time, it probably makes sense to adjust for inflation.
I looked up the average inflation rate from 2005-2019 and found that it was 2.0% per year. Then I adjusted all the average annual salaries for inflation, threw up a prayer, and hoped for more correlation.
And whaddya know, with salaries adjusted for inflation, r = 0.51.
Not too shabby, but how does this compare with other statistics in predicting average annual salary? Well, here’s a table that looks at how much of a correlation there is between BA, OBP, SLG, OPS, HR (because maybe front offices dig the long ball!) and average annual salary.
| Statistic | Correlation Coefficient (r) |
|---|---|
| BA | 0.28 |
| OBP | 0.37 |
| SLG | 0.62 |
| OPS | 0.60 |
| HR | 0.39 |
| WAR | 0.51 |
According to this, SLG actually has the greatest correlation, with r = 0.62. This is interesting. Out of these basic statistics, SLG seems to have the highest level of correlation with how much these big free agents are paid, meaning that contract value isn’t just dependent on how often a player gets on base or just dependent on how many home runs he hits, but a mixture of power and consistency.
But I still thought there has to be a statistic with an even higher correlation.
It was at this point I thought of how much of baseball is about consistency. In some ways, with a 162-game season, the sport demands consistency more than some other sports with shorter seasons, so perhaps front offices take this attribute into account when offering contracts.
To test this hypothesis, we have to find some way to account for consistency in our statistics. One way we can do this is if we take three-year averages (the three years prior to the signing of each respective contract) of all these statistics and see if there’s a correlation between these new numbers and average annual salaries. If we do that, these are the results we get.
| 3-Year Statistic | Correlation Coefficient (r) |
|---|---|
| BA | 0.41 |
| OBP | 0.47 |
| SLG | 0.57 |
| OPS | 0.57 |
| HR | 0.39 |
| WAR | 0.72 |
And there it is, folks—my prediction holds true: compared to some other basic statistics, a three-year WAR average has the highest correlation with average annual salary (r = 0.72).
What does that mean? We’ll get to that after we deal with the pitchers.
How are Pitchers Paid?
Now for pitchers, the set of statistics I used was WAR, ERA, WHIP, K/9, FIP, and the three-year averages of all of these respective statistics.
Here’s a table with how all of these respective statistics correlate with average annual salary (adjusted for inflation again, of course!).
| Statistic | Correlation Coefficient (r) |
|---|---|
| WAR | 0.77 |
| 3YR WAR | 0.78 |
| ERA | -0.25 |
| 3YR ERA | -0.20 |
| WHIP | -0.39 |
| 3YR WHIP | -0.49 |
| K/9 | 0.44 |
| 3YR K/9 | 0.27 |
| FIP | -0.34 |
| 3YR FIP | -0.31 |
Again, a three-year WAR average has the highest correlation with average annual salary, with r = 0.78 (although this time, WAR from just the season prior isn’t too far behind with r = 0.77). So, out of all the statistics mentioned in this article, a three-year WAR average is the best determiner of average annual salary among the most expensive free-agent contracts.
But the thing is, this isn’t just a trend among the elite free agents who sign huge contracts in the offseason. If you take the top-100 free agents (regardless of whether or not they were position players or pitchers) from 2019 by WAR and calculate the correlation between their three-year WAR average and the average annual contract they signed in 2019, r = 0.84. If you separate this group by position players and pitchers, position players have r = 0.86, and pitchers have r = 0.85.
To put the diversity of this group into perspective, there are multiple players on this list that signed a deal worth less than $1 million/year while also including the likes of Anthony Rendon, who will make an average of $35 million/year.
Therefore, if you just wanted a single, simple statistic to predict the average annual contract a free agent player will sign, a three-year WAR average does a pretty good job. Are front offices intentionally paying players based just on WAR? Probably not. But either way, there seems to be a relationship between a player’s previous WAR and how much they’re paid every season.
And this leads to the second question: does it make sense to pay players based on their previous WAR, or in other words, should this be happening?
Should Players Be Paid this Way?
One way we can answer this question is by seeing if there’s a correlation between previous WAR and future WAR. We can ask questions like, is there a correlation between WAR from the season prior and WAR the season after signing a huge contract? Or, is there a correlation between WAR from the season prior and average annual WAR throughout the player’s duration on the team? And, what if we use three-year WAR averages instead of just the season prior?
Looks like it’s time for another table! Let’s return to our sample of the most expensive free agents from 2005-2019 and calculate some correlations for the position players.
| Relationship | Correlation Coefficient (r) |
|---|---|
| 1YR WAR vs. First Year WAR | 0.35 |
| 3YR WAR vs. First Year WAR | 0.50 |
| 1YR WAR vs. AVG WAR per season on New Contract | 0.20 |
| 3YR WAR vs. AVG WAR per season on New Contract | 0.41 |
None of these correlations are particularly strong (or at least not as strong as the correlation between WAR and how much players are being paid). The greatest correlation is between three-year WAR averages and the first season a player plays on his new contract, but with r = 0.50, the correlation is very moderate, to say the least. This seems to indicate that among position players, although there is a strong correlation between WAR and average annual salary, there is a weaker correlation between previous WAR and future WAR.
In other words, position players are being paid based on their WAR, but their previous WAR (whether it’s from just the year prior or using the past three seasons) isn’t doing a great job of predicting what their WAR will be immediately nor what their WAR will be throughout the duration of their contract.
The most expensive pitchers, on the other hand, have a table that looks very different.
| Relationship | Correlation Coefficient (r) |
|---|---|
| 1YR WAR vs. First Year WAR | 0.62 |
| 3YR WAR vs. First Year WAR | 0.75 |
| 1YR WAR vs. AVG WAR per season on New Contract | 0.54 |
| 3YR WAR vs. AVG WAR per season on New Contract | 0.69 |
As you can see, compared to position players, there is a higher correlation between a three-year WAR average and WAR after a new contract for pitchers. Calculating the correlation between the average WAR of a pitcher three years before free agency and his WAR in his first year of a new contract will yield an r-value of 0.75. This is very close to the correlation we saw between three-year WAR averages and average annual salary among pitchers, r = 0.78.
This seems to indicate that it makes more sense to use WAR to pay pitchers than it does to pay position players, considering there is a higher correlation in performance among the most expensive pitchers than in the most expensive position players.
However, it should be noted that the r-value drops to 0.69 when we look at pitchers’ average WAR per season throughout the entire duration of their new contract instead of just their first season on their new contract. There is less of a correlation in performance as time goes on. But, at the same time, this correlation is still higher than any such correlation in performance among position players, so it still implies that pitchers are a safer option than position players.
So, Are Top Free Agents Worth It?
Alright, now that we got most of the math out of the way, let’s try to put everything together and hopefully draw some interesting conclusions.
First of all, correlation, in a way, can be thought of as consistency. What I mean by that is that perfect correlation means perfect consistency: you put in x, and you will always get y, so the higher the correlation, the higher the consistency.
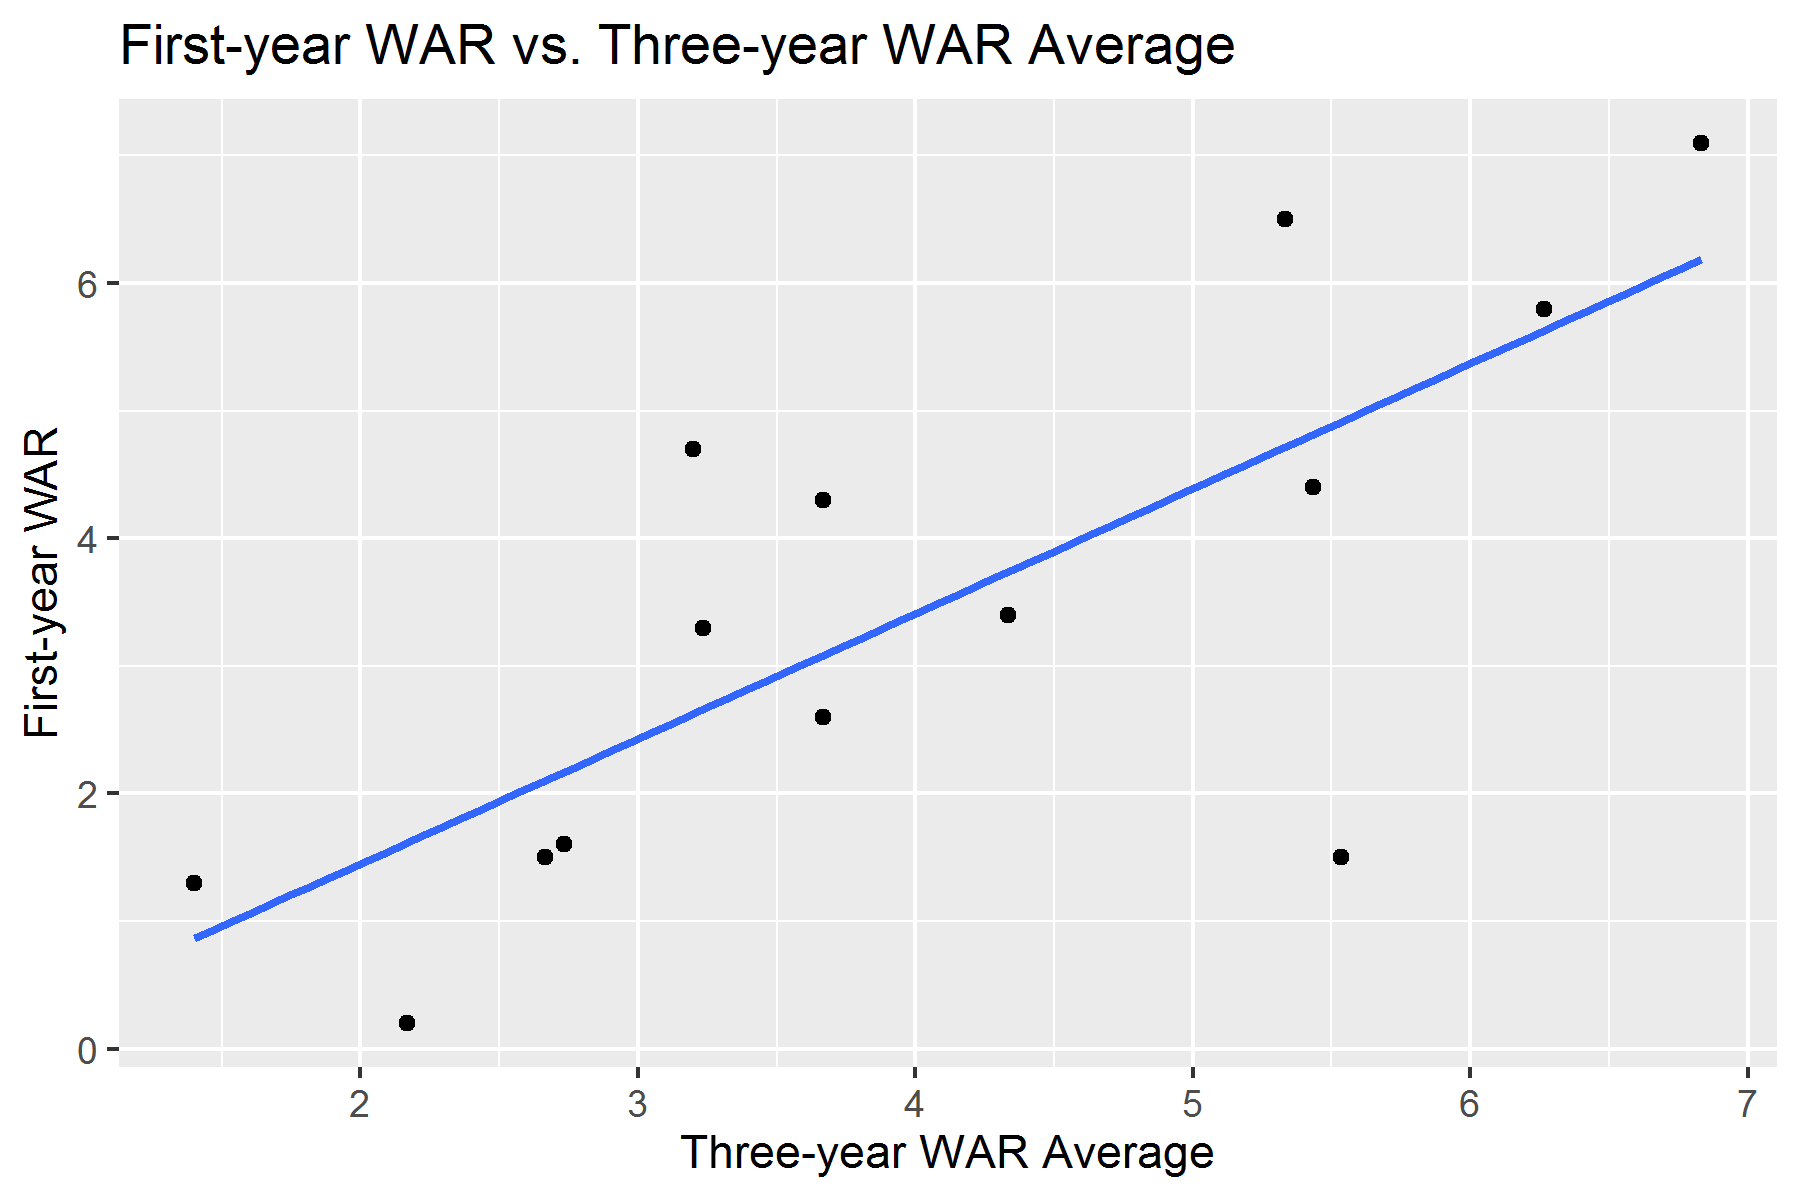
This means that correlation isn’t in itself a “good” or “bad” thing. For example, let’s look at these two plots. The first plot is a linear regression of the relationship between the three-year WAR averages among the most expensive pitchers and their respective WARs from their first year on their new contracts.
The second plot is a linear regression of the relationship between the three-year WAR averages among these pitchers and their respective average WAR/season during their new contracts.
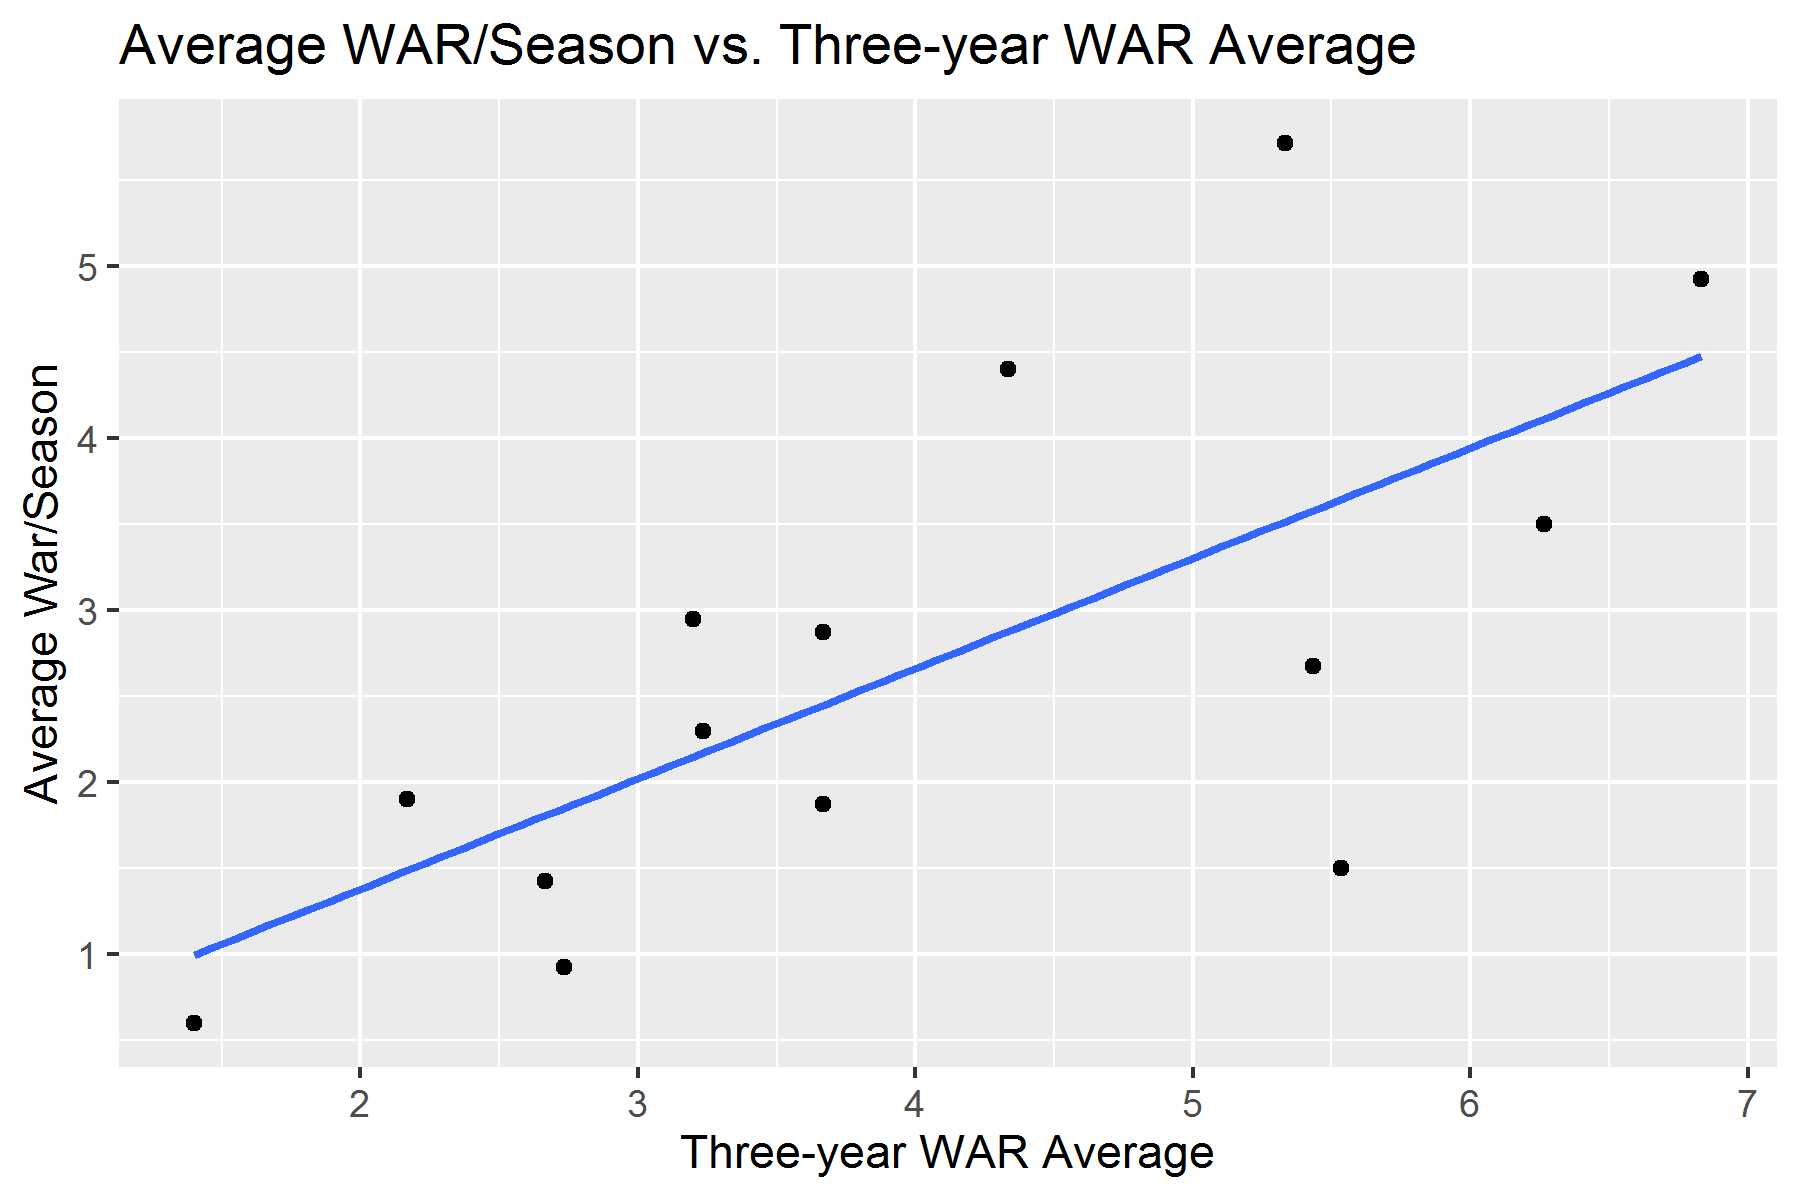
Again, these two plots had r-values of 0.75 and 0.69, respectively. These two plots had higher correlations than any of the performance correlations among position players. However, if we look at the linear regression lines of these two plots, it’ll show us that higher correlation doesn’t necessarily mean pitchers are more worthy of their contracts than position players.
Note: A linear regression line is just a line/model that attempts to show the relationship between the variables involved.
The equations of the regression lines are as follows:
WAR from first year on new contract = 0.98(three-year WAR average) – 0.51
Average WAR per season throughout duration of new contract = 0.64(three-year WAR average) + 0.10
Now to make the math easy, let’s pretend a pitcher had a three-year WAR average of 1.0. If we plug that into these two equations, the models predict a 0.47 WAR in the pitcher’s first year on his new contract and a 0.74 WAR/season throughout the duration of his contract. Both of these numbers are below the numbers the pitcher put up before signing his deal.
In fact, both of these models predict that both a pitcher’s WAR during his first year on a new contract and his average WAR/season throughout the duration of the new contract will be below his average WAR from the three seasons prior to his new deal. The pitcher will not perform as well as he did before his new contract.
Now in a scenario where r = 1.0 and there is perfect correlation, this would mean that pitchers will never be as good on their new contract as they were before. That’s why correlation shouldn’t be thought of strictly in terms of “good” or “bad.” With regression lines like the ones listed above, certain front offices might prefer a lower correlation in performance because, albeit riskier, there is room for the player to surprise you with a higher level of performance after signing his contract compared to the numbers he put up before signing.
All this is to say that yes, the most expensive pitchers are more consistent in their performance before and after a new contract when compared to position players, but that may not always be a good thing.
Again, that’s the issue in determining worth: it is so dang subjective.
From the front office side, do you want to play it safe, or do you want to risk it all?
Even from the player’s perspective, maybe some of these players signed contracts below their highest offer. Maybe they value playing in a certain city or for a certain coach more than a couple more dollars.
There’s a rapper/spoken word artist who goes by the name Propaganda that I really like. He says these words in his song, “Lofty.”
But worth, value, and beauty is not determined by some innate quality
But by the length for which the owner would go to possess them
Ain’t that the truth.
Are top free agents worth the money? It all depends on how you value them.
Great article! Every time I thought “has he considered…”, BOOM, it’s in the next paragraph and incorporated into the analysis. Really nice flow and clear explanation of the stats without watering it down. That is all leads to the inevitable conclusion “it depends” is both appropriate and infuriating. Once we dispense with even a smidge of rational decision making and performance predictability from players and GMs, a degree of chaos reigns and your analysis may be as close as we can get to know if it’s the right move for a team or not.
Thank you for your kind words man, means more than you know! I might not know what goes on in free agent meetings, but hopefully stuff like this is the bare minimum.
Samuel, interesting read. Not trying to be a jerk, and maybe I missed it, but I don’t think I saw anything that correlates to the money they are getting paid. If it’s not factored in, couldn’t I just increase every free agent’s pay by a proportional amount and get the same results? In which case, it really doesn’t address whether a player may or may not be worth $40 or $45 million a year, does it? In the end, I guess it doesn’t matter because if someone is willing to pay x amount of money to someone, they have decided it’s worth the risk. Given Bauer’s track record, I personally think it’s a BIG risk. But hey, it’s the Dodgers! :-) Thanks
Hey Dave, sorry I’m having a little trouble understanding. Do you mean the TOTAL amount of the contract as opposed to an average amount/season?
Samuel, no I just don’t fully understand everything and was hoping to see an application of your research to Bauer’s (and others’) contract. Thanks
Yes, so the problem with correlation is that it’s not a predictive measure. What that means is that previous (from 2005-2019) contracts have shown to be correlated with WAR but as for future contracts, we can’t officially predict that WAR is a good measure to predict future contracts. Basically, one of the points of this article is to say that previous history states that WAR is often related to contract value, but not necessarily in performance. As for the future (including Bauer), we can’t say anything just based on this research. Hope that makes sense!
Propaganda babyy
(Oh and very well put together article haha)
He is a masterful lyricist. Thanks, man!