


I am extremely fond of dominant pitching. I mean, I still like to see Giancarlo Stanton smashing a ball at 120 mph into the upper deck but, more times than not, I’d rather watch Kevin Gausman painting corners with that wicked splitter, or Jacob deGrom pumping 100 mph fastballs in the 8th inning.
I am also old enough to remember when 95 mph on a radar gun was something to be amazed by. A time when location, command & control were on the front row, while velocity, still something desired, was not the main (and sometimes, only) attraction.
Don’t get me wrong, I’m not saying that this is bad, au contraire, I believe we are living in fascinating times in that regard; it’s just that I think we are getting so used to these new levels of velocity that we are not grasping the full impact and magnitude of the situation.
The Status Quo
Let’s take a look at the progression of the average pitch velocity since 2008 and the average Revolutions Per Minute (RPM) since 2015 (Statcast era):
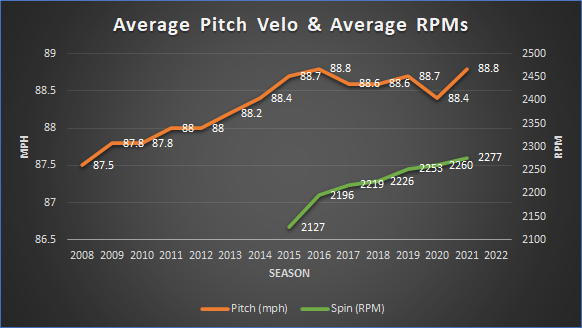
The trend is clear: in 14 years, the average Pitch Velocity has increased by 1.3 mph, and it looks like it will continue. I just added RPM to the graph for sticky fun.
If we remember that this includes ALL pitches, it’s even more impressive as there is also a trend for the past four years to increase the usage of offspeed and breaking pitches, bringing down the overall average.
This means that there are fewer fastballs thrown, but the ones that are, are faster than before. One way to check this is by looking for the percentage of all pitches that are faster than a certain high threshold, 100 mph, and more for example, per year.
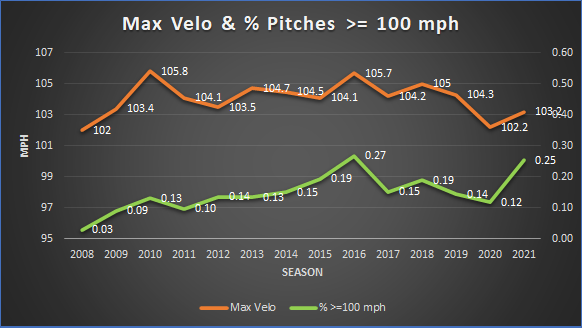
We can conclude that pitchers are not setting new max velocity records every season (orange line), it is just that the percentage of pitches equal to or greater than 100 mph, in this example (green line), is increasing each year, skewing the average.
In fact, at 0.25%, this season we are close to setting the highest percentage of pitches beyond 100 mph, currently belonging to the 2016 season at 0.27%.
Now, is this emphasis on sonic barrier-breaking pitches justified? What’s the impact on the run prevention process from this power paradigm?
First, let’s do a quick check:
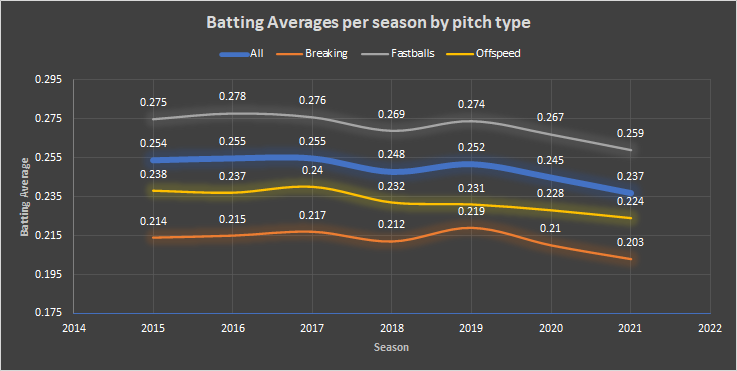
MLB is facing some sort of “crisis” as there are fewer and fewer batted ball events that end in a safe play for the hitter; the .237 Batting Average (blue line, all pitches) is the lowest in a long time and has decreased significantly since 2015 when it was .254.
We can also confirm from the graph that, from “easiest” to bat (of course, easy is relative) to hardest, breaking pitches are the toughest, then there are the offspeed throws, and finally, fastballs are the most safely hit pitches.
In terms of wOBA produced against these types of pitches, we can do another quick check:
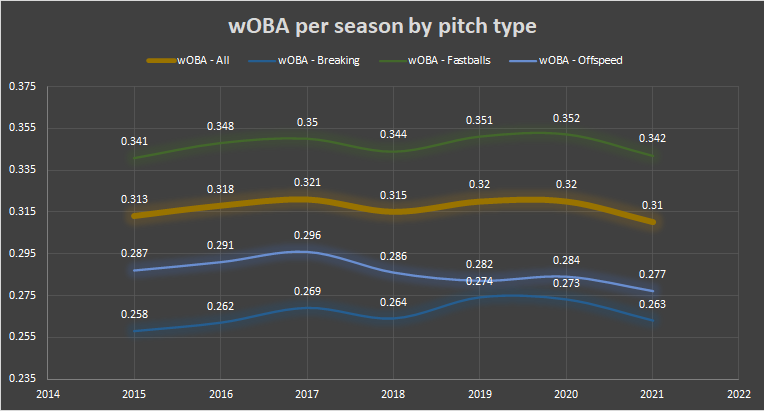
It all checks out, so let’s move on and look at wOBA but for different velocity intervals for fastballs, as we want to assess what happens when there are significant speed increases.
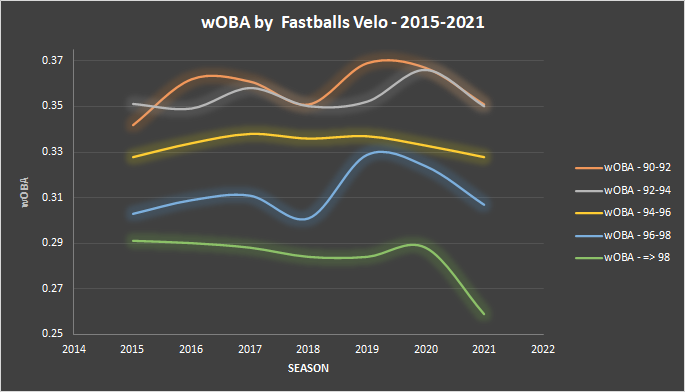
Here is where things get even more interesting: the two first intervals, 90 to 92 mph (orange line) and 92 to 94mph (white line), intertwine for the past six seasons, making a case for saying that the advantage in throwing at the upper end of the 90-94 mph range is minimal or non-existent.
The third interval, 94 to 96 mph pitches (yellow line), seems to be pretty stable, allowing around a .330 wOBA. That’s almost seven percent better than the previous step.
The fourth interval, 96 to 98 mph, offers another 7% improvement, too. So yes, pitching faster does have an impact on hitting results.
But it is in the last interval, pitches faster than 98 mph (green line) where we find the biggest improvement on the expected outcomes. On average, pitchers allow a wOBA which is 16% better (lower) than in the 96 to 98 mph bucket. Sixteen percent!
This has a couple of implications: first, throwing fastballs 100 mph and faster is a huge advantage for any pitcher able to do it (duh!). And second, 94 to 96 mph looks like (I’m not controlling for a lot of variables, that’s why the hesitation to categorically affirm it) the minimum desirable sweet spot.
Implications
We all know that we must be very vigilant on the speed that a pitcher shows, that’s one of the easiest ways to evaluate performance.
This works not only to check on pitchers having problems and that are suffering from any kind of variance, but also works when fantasy managers are looking for an interesting option from the waiver wire. Look for pitchers that are not only increasing their velocity but are also moving into a better velocity range.
Remember, it’s good to improve the velo, but it is not enough to do it within 91 to 93 mph, for example. We have seen that 94 mph is the main hurdle a pitcher must conquer to start expecting significant enough results.
One player that is an example of this is Tyler Mahle. It was only, among some other tweaks, when the right-hander got into the 94 mph range with his 4-seamer (93.9 in 2020 and 94.3 in 2021) that his results improved. A heater around 92-93 mph was just not enough.
There is another pitcher that could clearly benefit from a small bump and would leave the dreaded 90-to-94-mph zone: Griffin Canning.
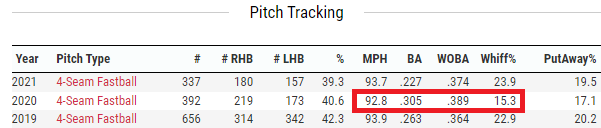
In 2019, his debut season, Canning had a 4.58 ERA while his xERA was a little better at 3.94. He also averaged 93.9 mph with his four-seamer. Last season his heater’s velocity dropped to 92.7 mph. Even though his ERA went down to 3.99, his SIERA, xERA, FIP, and WHIP all got worse or did not improve.
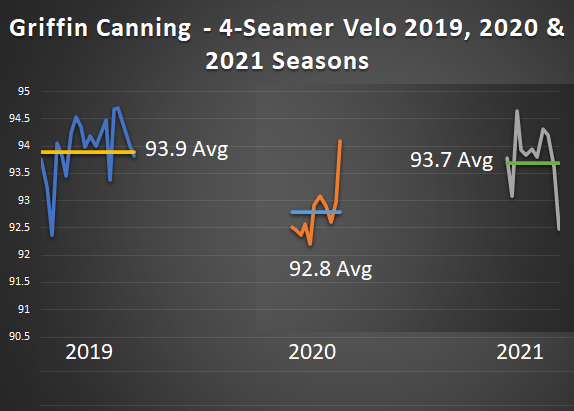
Earlier, we saw how the 2020 league-wide velocity decrease worsened the results in wOBA & batting average against, we can see in Canning’s case, that it also had a big impact on his Whiff% on his four-seamer:
For a pitcher, like Canning, who uses his fastball 40% of the time, these extra few tenths of a mile, that would get him out of the 90-94 velocity range, are extremely important. It could mean the difference between mediocre performances or the possibility of a breakout.
Photo by John Cordes/Icon Sportswire
Great article. What I would love to see is the effect the shift has had toward batting average since it reared it’s ugly head. I think eliminating the shift would see a lot of different approaches in batters (they have to elevate because a base hit to right field is now an out). To me this has been one of the driving forces of the ‘true three outcomes’ and I’d love to see someone smarter than me test this out.
I’m very glad you liked it!
Definetly the shift is a very interesting and polarizing subject! I hope someone smarter than me can do definitive study on it (there are already some of them but honestly I don’t find them all that conclusive).
CM.