


For those of you who read last week’s column, welcome back. For those who are reading about plate discipline for the first time, welcome! Below is a table outlining the leaders for plate discipline. The plate-discipline grades are calculated as follows:
Plate Discipline A: [3*(O-Swing%) + 3*(2*SwStr%+1%) + 3*(1-Contact%) + F-Strike%]/4
Plate Discipline B: 1.5*(1-xSLG)
Final Plate Discipline: (PDA+PDB)/2
[table id=70/]
*Note: The import of the table cut off at 100. There are players ranked lower in the C- and below range. If you want to see the full leaderboard, click here.
There’s a lot of really interesting players at the top of the list. The thing is, we are mostly looking at numbers that are not sample-size dependent. A 30.0% K-rate means the same at 10.0 innings pitched and at 180.0 innings. But one of those numbers (the 180.0 IP) has reached a more reliable stabilization point, and therefore we can trust it more as an accurate representation of the player’s skill.
This is what makes determining what these numbers mean so interesting (and difficult) this early on in the season. Most of these statistics are barely beginning to reach their stabilization points, which leaves them open to being skewed by outliers. One good or bad outing can throw off what we’re seeing in a big way. With that in mind, two pitchers in the Top 30 caught my eye and made me want to take a closer look to see if we can identify why they are there and if we can start to get an idea of whether their performances legit or not.
2018 Rank: N/A
2019 Rank as of 4/17: No. 10
| Year | O-Swing% | Contact% | SwStr% | F-Strike% | xSLG | K% | eK% | PD Grade |
| 2017 | 28.1% | 73.7% | 12.4% | 62.7% | .419 | 22.9% | 25.8% | 81.5% |
| 2018 | 33.2% | 70.5% | 13.3% | 61.8% | .339 | 33.2% | 27.6% | 90.0% |
| 2019 | 30.1% | 72.6% | 12.0% | 58.1% | .248 | 31.% | 25.0% | 94.6% |
I wanted to talk about Collin McHugh because his 2019 so far is EXACTLY what we hope to discover in this column. So far, McHugh has been fantastic in his 23.0 innings to the tune to a 1.96 ERA with 27 Ks! Last year, he spent the entire season pitching out of the bullpen for the Astros and found a ton of success by adding a slider in the 2018 offseason. This is the key, because as you can see his numbers are pretty consistent across the years, but the addition/perfection of his slider really helped him break out in several different ways. The pitch has always been great in terms of swinging-strike percentage:
| Year | Slider SwStr% | Slider Usage % |
| 2017 | 19.1% | 17.5% |
| 2018 | 13.8% | 24.1% |
| 2019 | 20.8% | 41.7% |
So he’s getting more swings and misses on the slider, and he’s throwing it WAY more than ever. Considering he has given up lower than a .120 SLG and .050 ISO the last two years with the pitch, the fact that he is throwing it more than ever would explain the rapid drop in his xSLG the last two years and a large part of his success the last two years. It is fascinating to see a pitcher make a huge leap while in a bullpen role and then carry over those skills into a starting role the following year. That’s the best part of these rankings. We see the skills at work, regardless of his role, and when that role changes we’re able to directly see those skills carry over. We should obviously keep an eye out to see if his slider usage continues at these rates, but I’m liking what I am seeing so far and am expecting big things out of McHugh in 2019.
Recommendation: Buy
2018 Ranking: 76.43%
2019 Ranking as of 4/17: 89.54%
| Year | O-Swing% | Contact% | SwStr% | F-Strike% | xSLG | K% | eK% | PD Grade |
| 2017 | 28.4% | 80.6% | 8.4% | 67.1% | .410 | 26.2% | 17.8% | 77.24% |
| 2018 | 27.6% | 81.0% | 8.0% | 65.4% | .419 | 21.4% | 17.0% | 76.43% |
| 2019 | 30.9% | 69.1% | 13.3% | 68.5% | .380 | 31.5% | 27.6% | 89.54% |
This case is a bit trickier to figure out, so we’ll spend a few more words on it. So far in 2019, we are seeing a huge change in Jose Quintana’s plate-discipline stats. Oftentimes at this stage of the season, I would lean toward this being an outlier, but let’s dive deeper into his numbers and see if there is any evidence to support Quintana’s hot start.
First, let’s look at his game-by-game performance. So far in 2019, Quintana has made three starts since he made his 2019 debut in long relief on March 30, two of which have gone well while one was an unmitigated disaster. Here are his stats across those four starts:
| Date | Opponent | Innings Pitched | Earned Runs | K% | BB% | O-Swing% | Contact% | SwStr% | F-Strike% |
| 3/30 | Texas | 4.0 | 0 | 40.0% | 15.0% | 25.9% | 65.5% | 12.4% | 55.0% |
| 4/05 | Milwaukee | 3.0 | 8 | 15.8% | 15.8% | 29.3% | 73.0% | 13.2% | 73.7% |
| 4/11 | Pittsburgh | 7.0 | 0 | 42.3% | 3.9% | 31.2% | 73.8% | 11.1% | 65.4% |
| 4/16 | Miami | 7.0 | 0 | 25.9% | 0.0% | 37.8% | 63.8% | 16.5% | 77.8% |
There’s quite a bit to parse. In the three outings where he posts an above-average to elite strikeout percentage, he gave up no runs, whereas in Milwaukee when he was unable to get any Ks and demonstrated poor control, he got hit hard. It’s worth noting that Texas and Milwaukee are both top-10 teams so far in walk percentage, and the Brewers are 14th in K%, so that may be part of the equation as well.
Quintana has never been known as an elite strikeout pitcher, so what explains two games of 40.0+ K rate when he only had one such game all of last year? If you recall, most of us entered 2018 with high expectations for Quintana. The major reason for that was he started striking out more hitters than ever. Looking at his game logs, June 24 of the 2017 season was when it all seemed to click for him. He made 23 starts over that period and only five times did he post a K rate less than 23.0%.
You can see why we were excited. That is not the Quintana we saw in 2018. Are we seeing him return to form a year late? Let’s wrap up our analysis of Quintana by comparing that 23-game stretch in 2017 to what we’re seeing this year:
| Year | O-Swing% | Contact% | SwStr% | F-Strike% | xSLG | K% | eK% | PD Grade |
| 2017 since 5/24 | 28.0% | 80.1% | 8.7% | 66.8% | .410 | 28.0% | 18.4% | 77.46% |
| 2019 | 30.9% | 69.1% | 13.3% | 68.5% | .380 | 31.5% | 27.6% | 89.54% |
Wow. Even with the disastrous outing against the Brewers, Quintana is actually outperforming that 2017 stretch that had us salivating. That’s very exciting and justifies his grade so far.
With that being said, there is still reason for concern. Much of his success has come against two of the worst offenses in the league, and so we still have to take the results with some skepticism. His curveball was a huge catalyst for his success in 2017, and so far he has not found much success with it. On the other hand, he is throwing his changeup more than ever, and that could perhaps be the reason he is seeing more success with the fastball so far than in years past.
The honest truth is we need more data. Quintana next faces the Dodgers on the April 23 and then most likely either the Diamondbacks on April 28 or the Mariners on April 30. Let’s check in again on this ranking for Quintana after those two starts. I have a feeling we’ll have a better idea of what we can expect from him for the rest of the season.
Recommendation: Hold
-Daniel Port
His electric stuff has built our hopes up a few times now, but the lack of command has crushed that hope every time until now. Finally, we’re seeing what Tyler Glasnow can do when he isn’t walking 14% of the batters he’s facing. No, he’s not 2018 Jacob deGrom, so we shouldn’t expect the sub-2.00 ERA to stick, but the changes Glasnow’s made since moving to Tampa are legitimate.
The final grades from 2018 are a bit deceiving; two of the three home runs Glasnow allowed came while he was in Tampa, which explains the huge spike in xSLG—half of the final PD Grade. However, Glasnow improved in every facet aside from contact percentage by significant margins, so with his HR/FB regressing to the mean, we’re able to see the manifestation of his approach change reflected in his ERA.
| Tyler Glasnow | O-Swing% | Contact% | F-Strike% | SwStr% | xSLG | xwOBA | Grade | ERA |
| ’18 Pirates | 23.2% | 72.3% | 52.3% | 11.5% | 0.320 | 0.287 | 85.6% | 4.34 |
| ’18 Rays | 29.9% | 74.4% | 64.9% | 12.0% | 0.450 | 0.325 | 79.6% | 4.20 |
| ’19 Rays | 32.1% | 75.0% | 67.0% | 12.1% | 0.308 | 0.235 | 91.1% | 1.13 |
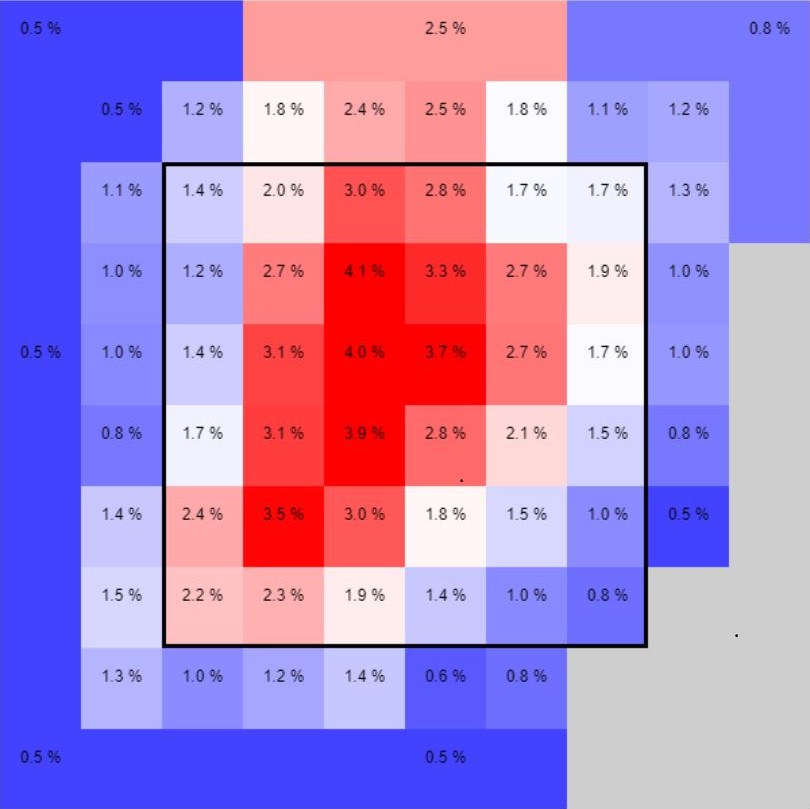
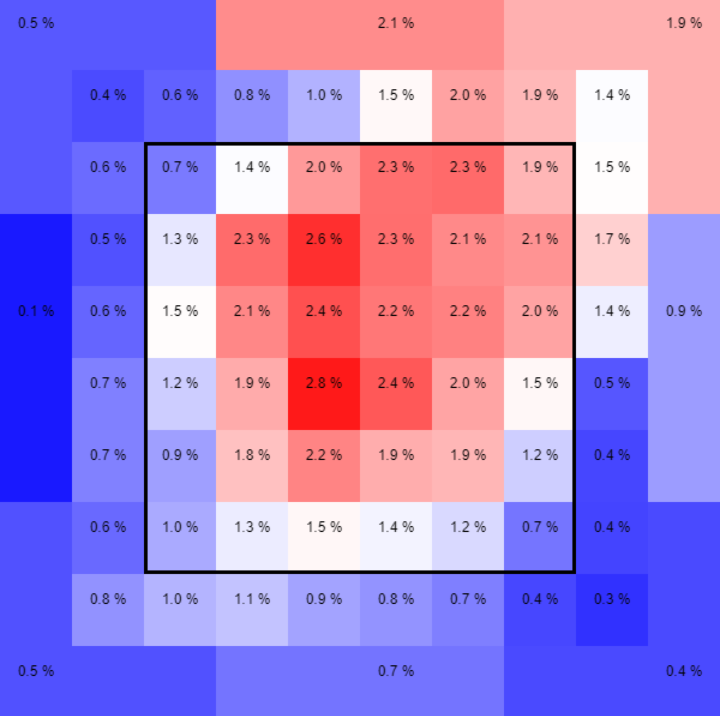
If you’re wondering what exactly Glasnow has done to alter his approach, look to how he’s mixing his pitches and where he’s locating them. The Rays have scaled back his fastball usage in favor of more breaking pitches, which has driven the increase in chase rate (O-swing%). More importantly, Glasnow has shifted away from throwing his curveball to the lower-right ninth of the zone. Placing a greater emphasis on the lower-left ninth of the zone has allowed for two things to happen: 1) he’s found a rhythm in locating his curveball through repetition, and 2) he can miss low and away rather than low and inside when facing right-handed hitters.
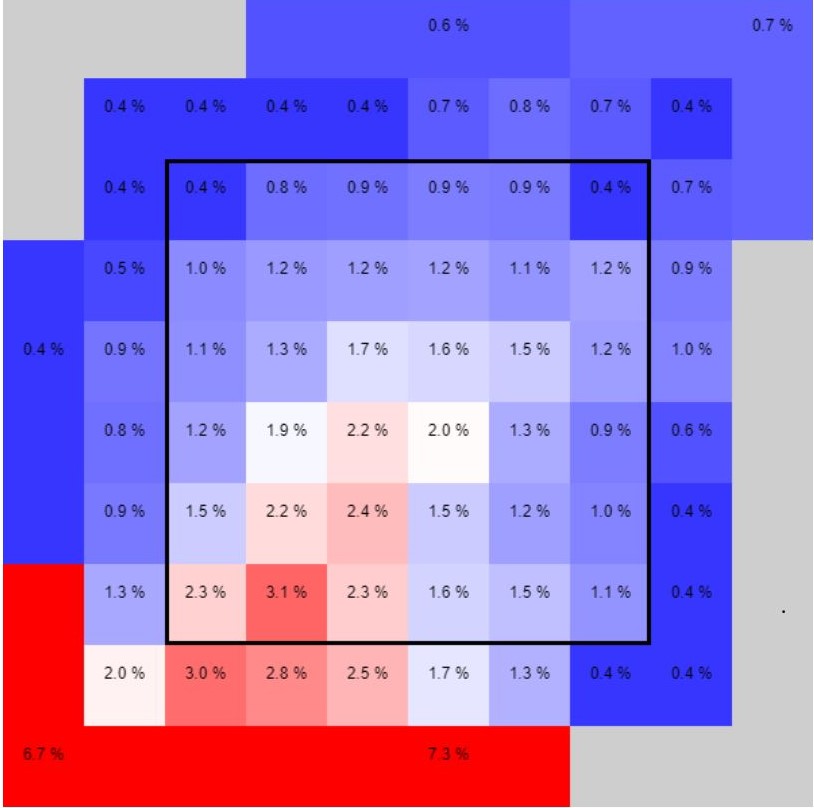
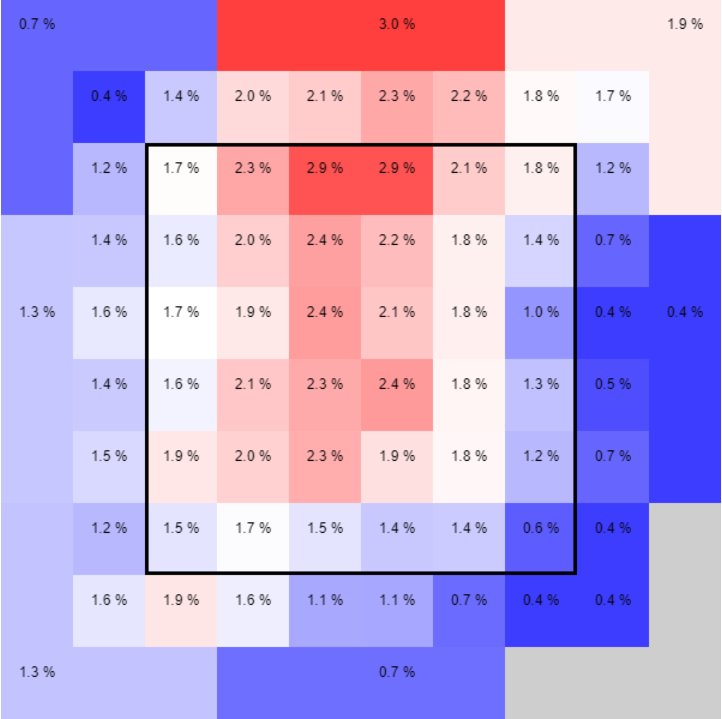
Looking at his fastball zone plots, we see a similar pattern. Rather than focusing on coming inside to right-handed hitters, Glasnow is focusing on coming into the zone earlier in the count. I may be performing a bit of Alex-Think-Fast here, but maybe Glasnow’s biggest problem was losing confidence (and command thereafter) when falling behind in counts, and if that’s not happening anymore, he has the arsenal of a Top 25 starter.
| Tyler Glasnow | FB% | SL% | CB% | CH% |
| ’18 Pirates | 72.5% | 8.9% | 18.5% | 0.1% |
| ’18 Rays | 68.1% | 14.2% | 14.0% | 3.7% |
| ’19 Rays | 65.3% | 0.9% | 31.1% | 2.7% |
’18 Pirates CU
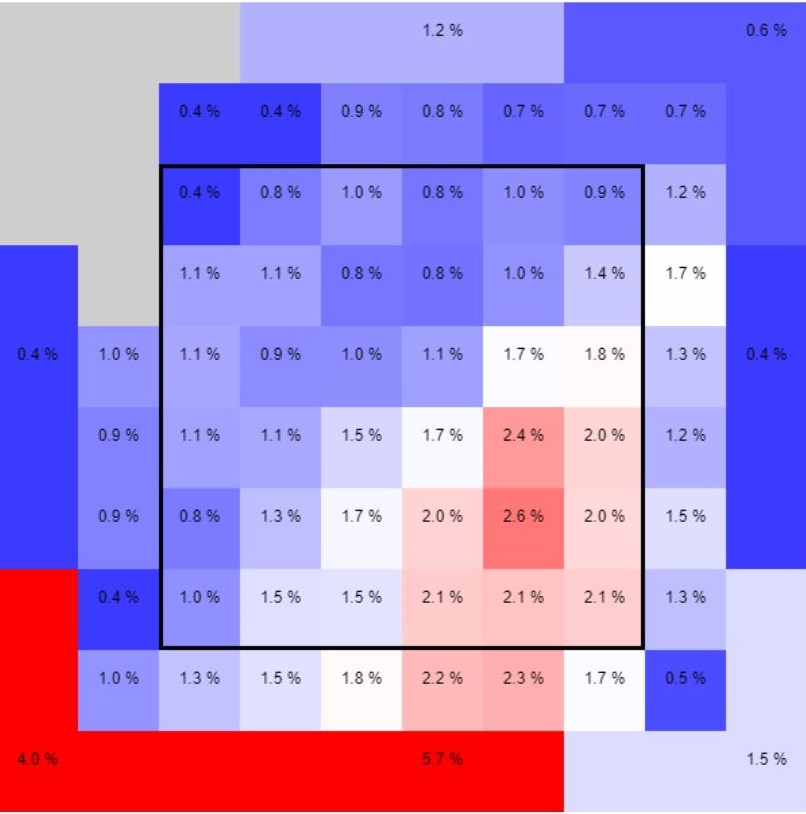
’18 Rays CU
’19 Rays CU
’18 Pirates FA
’18 Rays FA
’19 Rays FA
Recommendation: Buy
Chris Archer, Pittsburgh Pirates
| Chris Archer | O-Swing% | Contact% | F-Strike% | SwStr% | xSLG | xwOBA | Grade | ERA |
| ’18 Rays | 32.3% | 72.5% | 60.1% | 13.6% | 0.418 | 0.320 | 84.2% | 4.31 |
| ’18 Pirates | 35.5% | 73.5% | 65.8% | 12.4% | 0.399 | 0.306 | 86.2% | 4.30 |
| ’19 Pirates | 30.5% | 69.2% | 52.9% | 14.0% | 0.440 | 0.324 | 82.5% | 2.00 |
Chris Archer intrigues me less than Glasnow. But you ignored the xSLG for Glasnow to show approach improvement, so why not ignore Archer’s .440 xSLG as small sample size? Maybe it’s just fatigue with Archer having underperformed his peripherals the last few years that’s tinting my approach to him, or maybe it’s because his non-xSLG plate-discipline grade is exactly the same as it was when he was with Tampa.
| Chris Archer | FB% | SL% | CB% | CH% |
| ’18 Rays | 45.6% | 42.7% | 0.7% | 11.0% |
| ’18 Pirates | 49.3% | 39.4% | 3.2% | 8.2% |
| ’19 Pirates | 48.5% | 36.2% | 2.1% | 13.3% |
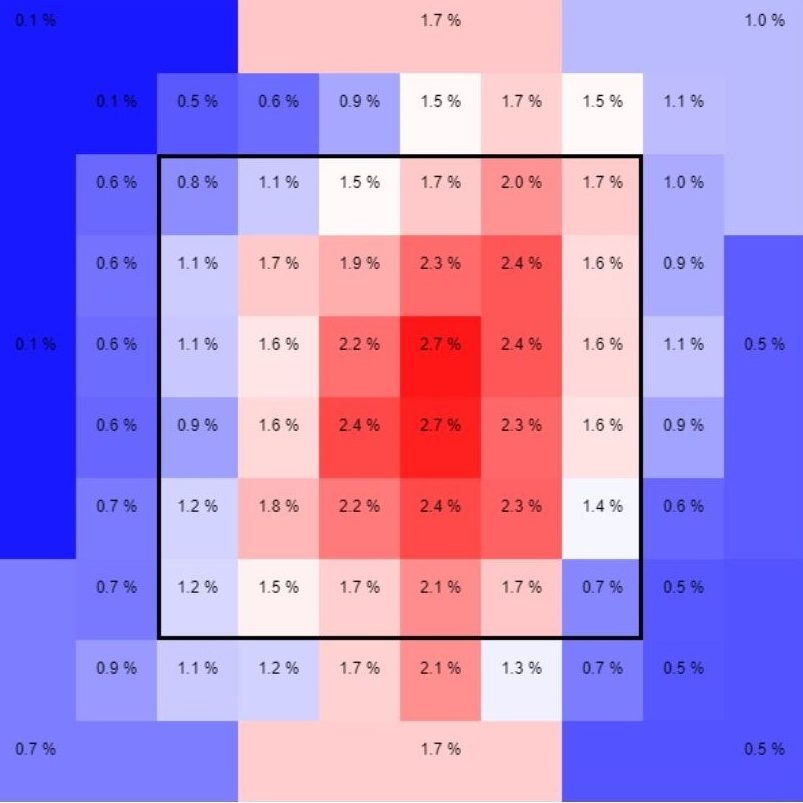
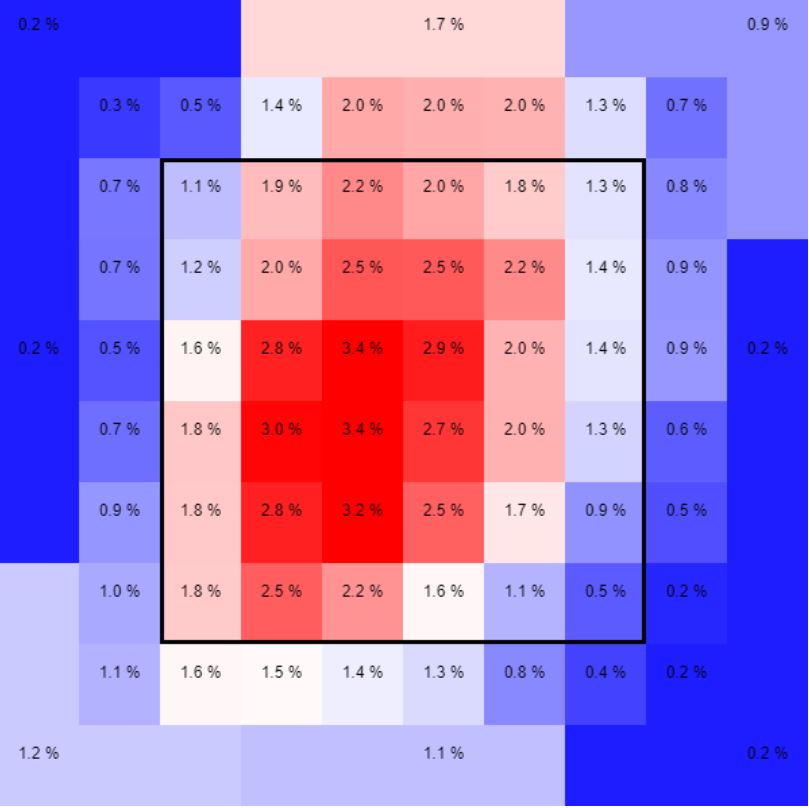
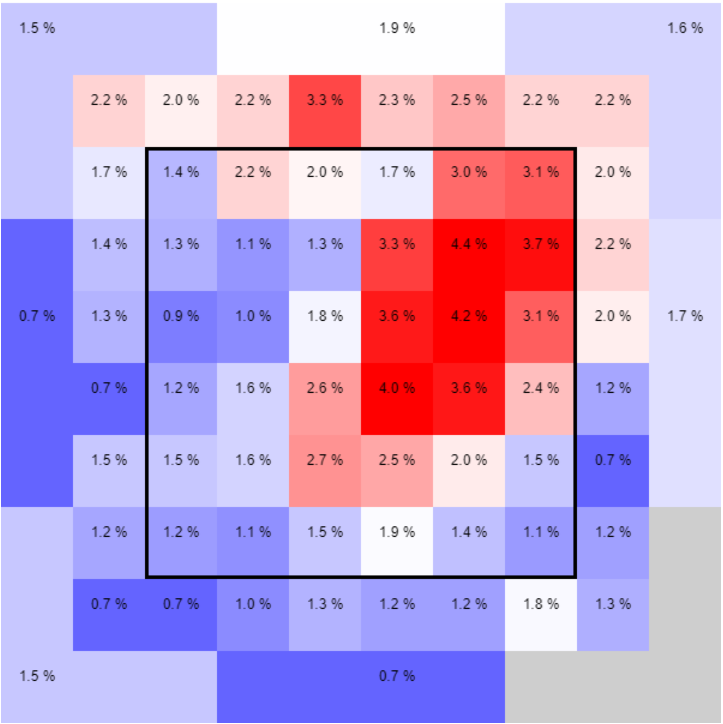
I’m also not a fan of Archer cutting back on his best pitch by 6 percentage points and reallocating that to his fastball and changeup. It is worth noting that his changeup was a Money Pitch in 2018, so an increased usage of this pitch could actually help Archer, but I would’ve preferred seeing the increased usage come at the expense of his fastball. But, if he’s able to keep his fastballs in the upper right ninth of the zone—something he wasn’t doing as effectively last year in Tampa—maybe Archer will re-establish himself as a Top 25 pitcher. Fastball command hasn’t been his calling card in the past, so I don’t believe this is sustainable and I’d be looking to move him. I understand if you think his over 4.00 ERA the past two seasons is attributable to bad luck, but I don’t see the Top 15 guy he once was anymore.
’18 Rays FA
’18 Pirates FA
’19 Pirates FA
Recommendation: Soft sell
-Alex Drennan