


Pitch mix. You hear Nick, Alex, and many others here at Pitcher List discuss it on just about every podcast when analyzing pitchers, and for good reason. A hurler’s pitch mix can make or break a game, a season, or even a career. Of course, not all pitches are created equal. Pitches have different purposes. Some are meant to get called strikes in order to get ahead in the count, others are thrown to generate ground balls, and some are putaway pitches to get the all-important swing and miss. For this article, I’ll be focusing on the latter. Not just putaway pitches, but pitches that have yielded fantastic results that don’t get the attention they deserve. I’ll focus on changeups and curveballs.
I’ve set certain parameters that include a usage rate of under 17% from a pitcher’s arsenal in 2019 with a minimum of 200 thrown. In my opinion, if a pitcher is throwing one of his best pitches fewer than 20% of the time, an adjustment should be made. These qualified pitches need to do two of three things: Have an above-average swinging-strike rate (SwStr%), induce swings outside the zone, and/or miss bats in the zone. Let’s take a look at what we have, starting with the curveball.
Noah Syndergaard’s Curveball
https://gfycat.com/lightheartednecessarykudu-new-york-mets-baseball
| Pitches Thrown | Usage | O-Swing% | Zone% | SwStr% | Whiff% |
| 300 | 10.0% | 32.4% | 44.7% | 18.0% | 46.2% |
The first thing I notice with Thor’s curveball is the O-Swing%, or chase rate, which came in at 32.4% last year. That’s only slightly above average for all pitch types, but below average for a breaking pitch. That being said, both the SwStr% and whiff rate are very good. Per Alex Chamberlain’s Pitch Leaderboard, the average SwStr% and whiff rate for a curveball is 12.1% and 30.2%, respectively. What does this mean? Well, first off, Thor’s generating a ton of swings and misses on pitches in the zone. That’s a great sign, but where I think he can improve is lowering the 44.7% zone rate on the pitch. Yes, lowering it. Let’s have a look at the heat map of Thor’s curveball locations from 2019.
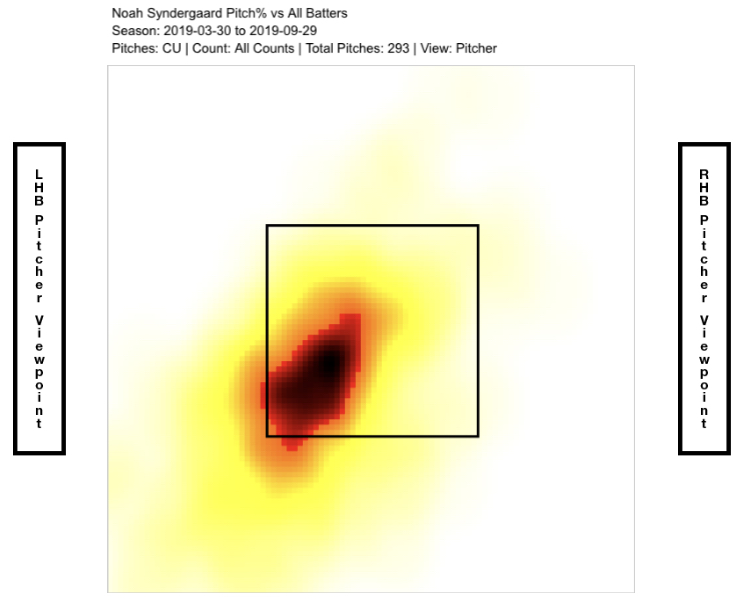
His curveball is catching far too much of the strike zone for my liking on a pitch that generates whiffs nearly 50% of the time. This is nothing new for Thor; he often spends too much time in the zone and often gets hammered because of it. His curveball is no different. The deep red in the lower-outside quadrant (for right-handed batters) tells me he has good command of this pitch. I’d love to see him shift this deep red blob further low and away (versus RHB), making hitters chase more frequently. In 2019, he allowed an O-Contact% (contact on swings outside the zone) of just 29.8%! Insane.
Now that we’ve established that Thor’s curveball gets a ton of swings and misses, let’s see how it fared when it was put in play. His hook allowed a .388 wOBAcon (league-average wOBAcon against curveballs in 2019 was .371), but also allowed the highest weak contact of any pitch in his arsenal. He allowed a barrel rate of just 3.6% against it, which is almost two percent better than the league average. Ultimately, Thor has a great weapon at his disposal in his curveball. I believe he needs to increase the usage of this pitch, but also throw it in the zone less often, keeping it down and away to righties and down and in to lefties. By making this change, he could increase his chase rate and see a bump in his strikeout rate. With better location and increased usage, the curveball could be Syndergaard’s most valuable secondary offering.
Joe Musgrove’s Curveball
https://gfycat.com/selfishsecretgeese-baseball
| Pitches Thrown | Usage | O-Swing% | Zone% | SwStr% | Whiff% |
| 247 | 9% | 42.3% | 43.7% | 17.2% | 39.8% |
Would you look at that? Musgrove’s curveball qualifies as a Money Pitch! I discussed the league-average SwStr% and whiff rate in Thor’s blurb, and Musgrove’s curve is also solidly above those rates. Aside from additional vertical drop, the difference between Musgrove’s curve and Thor’s hook is that the curve induces swings outside the zone at a 10% higher clip. Musgrove’s curve really has the makings of a great offering. At just 9% usage, it’s truly one of the most under-utilized offerings, considering the results.
In 2019, Musgrove’s curve allowed a 63 wRC+, but should have been much better. Why? Because the pitch generated ground balls almost 60% of the time and allowed a total of just three fly balls. Of those three fly balls allowed, all three went for home runs. That’s an odd anomaly that’s unlikely to happen again. It also begs the question about his ability to limit mistakes with the pitch. It’s a small sample, so only time will tell. However, with a 40% K-BB on the pitch and a zone rate over 40%, there’s no reason Musgrove shouldn’t throw this pitch at least 20% of the time. The good news for Musgrove owners and truthers is that he actually bumped the curve’s usage up to 16% over his final five starts. His results in those outings were impressive: 3.57 ERA (2.69 FIP), 1.07 WHIP, 9.37 K/9, and a pVAL of 3.3. Providing a second breaking ball to his arsenal that already favors a great slider could mask the poor performance of his fastball. He’s an interesting pitcher to watch in 2020.
Tyler Beede’s Curveball
https://gfycat.com/mellownearhamadryad-baseball
| Pitches Thrown | Usage | O-Swing% | Zone% | SwStr% | Whiff% |
| 277 | 14% | 30.5% | 26.7% | 16.2% | 49.5% |
Based on the table above, Beede’s curveball is interesting, to say the least. While a 16.2% SwStr% is very good for a curveball, it’s the whiff rate that comes in at nearly 50% that really gets me excited about this pitch. I mean, it had a 51.7% strikeout rate last season! That’s almost Blake Snell/Charlie Morton territory. Now, let’s calm down. It’s a small sample, as Beede only threw 277 curveballs in 2019, but it’s a start. Despite a 30.5% chase rate, hitters had no chance against this pitch when thrown out of the zone with just a 31.2% contact rate.
However, it’s not all positive with Beede’s curve, because that zone rate is extremely low. Is he avoiding throwing it in the zone on purpose, or does he have trouble locating the pitch? Beede is able to get an incredible amount of vertical drop with his curveball. It has nearly nine inches of vertical drop, which is about a 16-inch differential between the curve and his four-seamer. His fastball isn’t great, but he added velocity late in the season and it performed much better. In Michael Ajeto’s fantastic deep dive on Beede’s arsenal, he discusses how elevating his fastball could improve his secondaries. I completely agree, especially for the effectiveness of his curveball. OK, I still haven’t addressed the low zone rate. The heat map below explains some of the issues with the pitch.
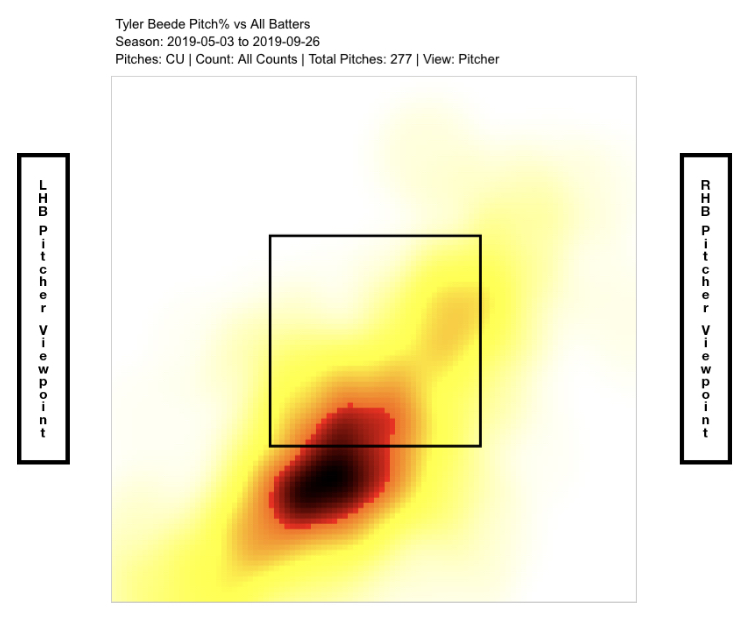
He’s clearly using it as a chase pitch, and half of the time it’s fantastic. Then there’s the other half, when he throws it in the waste zone or when it catches too much of the plate (see the yellowish-orange in the top right corner of the strikeout zone). We should never see this pitch near the middle of the plate vertically, which Beede does too often. Based on this information, his command of the pitch needs some refinement. Once again, if Beede could elevate his fastball, he wouldn’t have to throw the curve into the “waste zone” as frequently. He just needs to keep it low in the zone to be effective by changing the hitter’s eye level. Beede has a chance to be very good, and the way his curve plays off his fastball is the key to his success. If he can make the necessary adjustments, I think we could see a real breakout in 2020.
Mike Soroka’s Changeup
https://gfycat.com/slightglamorousamericanblackvulture-sports-mlb-baseball
| Pitches Thrown | Usage | O-Swing% | Zone% | SwStr% | Whiff% |
| 316 | 12% | 37.8% | 42.4% | 22.2% | 38.5% |
Soroka’s changeup is his best whiff pitch at 38.5% and was an excellent weapon for him this past season. Not only was he able to throw it in the zone, but he generated swings outside the zone at a decent clip as well. So it was just short of a Money Pitch, but that’s OK. The changeup features excellent fade away from lefties and managed weak contact with a meager .246 xwOBA. The league averages on changeups per Alex Chamberlain’s Pitch Leaderboard in 2019 were a 15.1% SwStr% and a 29.1% whiff rate. Soroka cleared those benchmarks by plenty. So why then was his strikeout rate so low? It’s not his sinker, his favorite pitch to generate ground balls and weak contact; it’s his slider. He went to his slider nearly three times as often in two-strike counts.
Soroka used his slider as his putaway pitch, and it performed well with an 8.3 pVAL. However, its SwStr% was nearly 1% below the league average for all sliders and was 6% lower than his curveball. Soroka could really see an increase in his strikeout rate in 2020 if he figures out a way to increase the usage of his changeup with two strikes. While it doesn’t induce as many ground balls as the sinker, hitters were unable to square it up. Additionally, the changeup allows the weakest contact of all four of Soroka’s offerings. I believe the combination of his power sinker with two very good secondaries (changeup and slider) that he can utilize 20% of the time could turn Soroka into a future fantasy stud.
Zac Gallen’s Changeup
http://gfycat.com/UnselfishSparseAfricanrockpython
| Pitches Thrown | Usage | O-Swing% | Zone% | SwStr% | Whiff% |
| 222 | 16% | 45.3% | 32.9% | 21.6% | 40.7% |
Wow, that’s pretty. The location is essentially perfection. In the chart above, you’ll notice the zone rate on Gallen’s changeup is very low. That’s fine, because he generated swings outside the zone over 45% of the time. He also induced swings on 53.4% of his changeups thrown. In other words, he had hitters fooled. The GIF above depicts this perfectly. The pitch looks like it’s coming in thigh-high on the outer third of the plate. It ends up six inches off the plate and just below the knees. It’s nearly impossible to lay off a pitch like that, and even more difficult to actually make contact.
Additionally, Gallen’s changeup induces grounders at a 64% clip, which helped limit hitters to just a .211 wOBA against it in 2019. Where I could see some improvement is with the walk rate. He had a 10.7% walk rate on his changeup and a 10.8% walk rate overall last season, but Alex Chamberlain’s expected walk rate (xBB%) from his Pitch Leaderboard tells a different story. His xBB% last year was just 7.2%, which is below the league average. I’d love to see Gallen bump his changeup usage above 20%, provided he can continue his impressive O-Swing%. As if we needed another reason to buy into Zac Gallen for 2020, Alex Fast tweeted out the effect of his catcher in regards to zone rate when Gallen went from Miami and Arizona. The hype with Gallen is getting loud, but it’s justified given the talent of this young arm.
Photo by Dustin Bradford/Icon Sportswire | Adapted by Michael Packard (@designpack on Twitter & IG)