


For baseball analysts and writers, teasing out the riddle of the interplay between pitchers and the defenders that catch batted balls behind them is an evergreen topic. How much credit (or blame) should the pitcher get? The defenders? Is a pitcher unlucky when a disproportionate share of batted balls sneak through the infield for hits? Or is the defense not very good? Or is the pitcher allowing hard contact that deserves to be hits? What about when those line drives find gloves instead of grass? The questions and situations to explore in this space are numerous.
Over time, our ability to measure more granular things and develop increasingly objective criteria and stats than the old-school eye test has inched us closer to unpacking that riddle.
You’re familiar with the usual tools of this trade – defense independent pitching theory, three true outcomes, and stats like fielding independent pitching and batting average on balls in play (BABIP), which lead to increasingly granular process measurements like contact quality and CSW rates.
Every season there are pitchers whose results don’t seem to match their process. Their ERA shows as far worse than their process metrics suggest they deserved. The opposite can also be true, as our Tim Cheng recently explored with Guardians’ right-hander Cal Quantrill and his weak-contact-inducing ways.
Results vs. Process
Last season’s poster boy pitcher for terrible batted ball misfortune was Toronto’s Kevin Gausman. In his first season after joining the Jays on a five-year free-agent deal, Gausman made 31 starts and worked to a strong 3.35 ERA across 174.2 innings.
You might not think that a 3.35 ERA season would be fraught with bad luck. By ERA-, which indexes against the league average, Gausman’s run prevention was about 13% better than the league average. Gausman’s ERA ranked 25th out of 45 qualified starting pitchers, per FanGraphs’ leaderboard, and Baseball Reference, which uses runs allowed per nine innings in its calculations, valued his work at 3.0 WAR. By the results, he had a good first season in Toronto and proved well worth the investment the Jays had made in him.
But by the process measurements, Gausman’s 2022 campaign was much better than it appeared. It was arguably the best season by any starting pitcher in 2022. While Gausman’s workload ranked just 36th out of the 45 qualified starters, his innings were very high-quality.
His 2.38 FIP was the second-lowest mark of any qualified starter, trailing only new Yankee Carlos Rodón. That was more than 40 percent better (FIP- 58) than the league average.
That FIP was the result of a 28.3% strikeout rate (91st percentile among starters per our metrics here at Pitcher List), a minuscule 3.9% walk rate (96th percentile), and the second-best home run suppression of his career (0.77 HR/9, 82nd percentile).
By FanGraphs version of WAR, which uses FIP as a primary input instead of runs allowed data, Gausman finished with the fifth-most WAR (5.7) among qualified pitchers. The 0.97 gap between Gausman’s 3.38 ERA and his 2.38 FIP was easily the largest among qualified starters.
2022’s Bad Luck “Champion”
This is the part where everyone now knows to look at batted ball data. Gausman’s BABIP allowed in 2022 was an astounding .363, nearly fifty points above his .314 career average and almost 90 points above the .274 he had the season before in San Francisco that earned him his payday. In fact, Gausman’s BABIP last season was the highest mark by a qualified pitcher since at least 1961.
FanGraphs’ Jay Jaffe went deep on Gausman last fall in the context of the AL Cy Young race. Without rehashing all the nitty-gritty of Jaffe’s great work here, the upshot was that the reasons behind this batted ball fortune are not entirely able to be chalked up to “luck”. They are a mix of factors, including some measure of misfortune – Gausman “led” baseball in allowing 29 base hits that had Statcast expected batting averages based on exit velocity and launch angle at or below .200 for example – but also some measure of an increase in the quality of contact Gausman allowed.
Gausman has never been a master at suppressing contact quality – he’s typically been below average in exit velocities and hard hit rates – and last season many of our best indicators suggested opponents were making more frequent contact that was slightly more optimal than before:
Sub-Optimal Defense
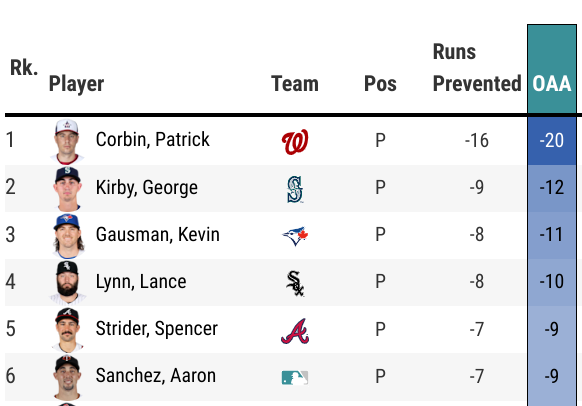
That improved contact was exacerbated by the overall strong Blue Jays’ defense letting Gausman down via poor individual performances and a questionable shifting strategy. Only two pitchers had worse defensive performances behind them last season:
Credit Baseball Savant
One way to think about the impact of the above data is by showing that if Gausman had actually allowed eight fewer runs and gotten an additional eleven outs, his season ERA would have been 2.88, nearly half a run lower than his actual ERA.
Jaffe finished off his piece by saying there was likely more to learn, especially about Gausman’s pitch selection and execution relative to the shift. Sportsnet’s Chris Black delivered those insights with a fantastic deep dive Twitter thread back in January.
#BlueJays ⚾️🧵focusing on a pitcher who has the best pure stuff on the team, got off to an amazing start in 2022, but was plagued by strange bad luck throughout the season.
It's about defence, shifting, catchers & pitch usage.
Let's take a deep dive on Kevin Gausman! pic.twitter.com/3bkQIgirAo
— Chris Black (@DownToBlack) January 6, 2023
Black pointed out that Gausman’s contact profile was at odds with the Jays’ deployment of pull side shifts, particularly with ground balls from right-handed batters, against whom the Jays deployed shifts 29.3% of the time when Gausman was pitching, easily the most frequent rate of Gausman’s career.
While Gausman is not exactly a ground ball by the bushel aficionado (he’s averaged just more than 40% ground balls the past four seasons), the grounders he generates go to the opposite field more often than any other pitcher over the past two years, according to Black.
As a result of that trend and the Jays’ strategy, Gausman was torched by grounders against shifts:
Consider: Gausman's BABIP was really high on all grounders last year but *esp* when shifted.
Gausman's .371 avg on grounders hit into a shifted infield is the 2nd highest among 517 pitchers since 2008. His .120 difference between expected & actual average was 3rd highest. pic.twitter.com/cTterxpCjt
— Chris Black (@DownToBlack) January 6, 2023
Black added that he saw there was a learning curve in pitch calling for Gausman’s catchers in the first year with a new club. Gausman also threw a considerable amount to rookie catchers, and the net result was too many glove-side splitters that leaked over the middle and a predictable approach that didn’t keep opponents guessing enough.
Nick wrote in his Top 300 Starting Pitchers rankings, where he ranked Gausman 21st, that he was concerned about the performance of Gausman’s four-seamer last season. Gausman pounded the middle of the plate with that offering and deployed in predictable patterns that might have left opponents comfortable. While the locations and sequencing need improvement, Gausman also averaged 95.0-mph on the pitch for the season, up a half-tick from the season before, maintained its above-average spin rate and 98% active spin, and reduced the pitch’s downward vertical movement per Statcast from 14.2 inches to 13.1 inches on average.
Enter Pitch Level Value
You may have heard that we have a new stat at Pitcher List, Pitch Level Value (PLV), a pitch quantifier where we use a machine learning projection model to analyze the pitch itself regardless of the context. We grade all pitches on a 0-10 scale with 5 being average. As Nick wrote in the article rolling out PL8, PLV enables us to analyze what happens after the pitch is thrown better than ever. One of the questions he used to introduce PLV applications was “did the pitcher get their deserved results based on the pitches they threw?”
Well, that’s just the thing we need to understand Kevin Gausman in 2022!
We have PLV metrics for the past three seasons, so we can compare the quality of Gausman’s pitches to the years prior. Here’s how Gausman’s pitches break down by type:
What this is telling us is Gausman, on average, threw higher-quality pitches last season than he had in the prior two years, especially with his vaunted splitter. Gausman’s 5.29 overall PLV scored in the 98th percentile among starting pitchers.
Going deeper, we also have the PLV distribution of Gausman’s offerings, by pitch type. The numbers above are his average values. The distribution lets us examine how often he threw higher-quality pitches.
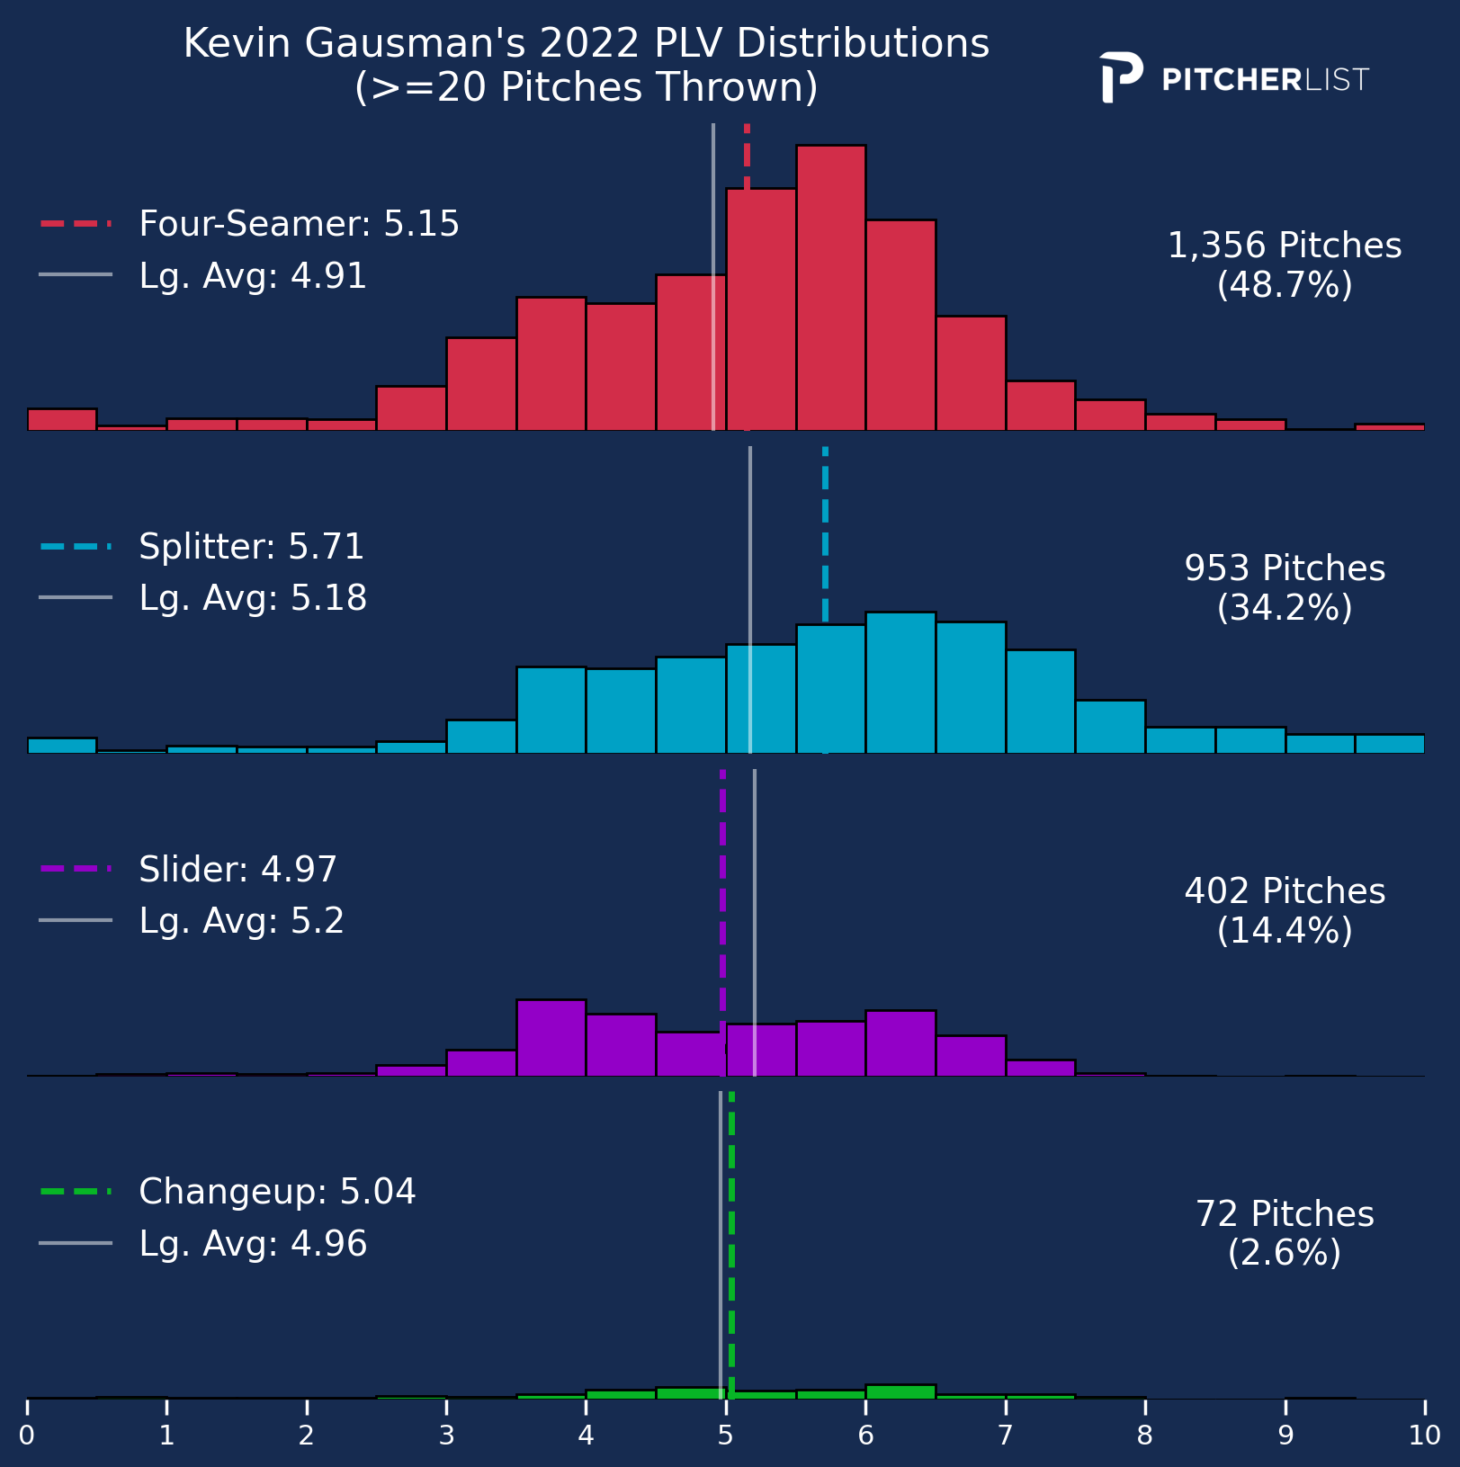
We’ve defined quality pitches as those with PLVs of 5.5 or greater. Bad pitches are defined as those scoring 4.5 or less. The distribution lets us easily examine how often he threw his various pitch types as good, bad, or average quality. Overall, Gausman was in the 95th percentile among starters in throwing quality pitches on 48.1% of his pitches last season. Conversely, just 29.6% of his pitches were bad pitches, which ranked in the 98th percentile. The difference between those two stats, QP%-BP%, was also 98th percentile among starters. Moreover, all of those numbers were marked improvements over what he did in 2021 and 2020.
Finally, we can tie all of this back to the batted ball discussion with our Hit Luck statistic, which tells us the number of hits a pitcher should have allowed based on their PLV data relative to their actual results. In Gausman’s case, perhaps as to be expected given everything covered in the first half of this article, he gave up 37 more hits than his PLV data suggested he should have! That checked into the 1st percentile for hit luck.
Why We Should Be Higher
The most simplistic, and a little lazy to be honest, argument to make is that his batted ball fortunes should even out more toward his career average in 2023. But it’s not all about luck. The Jays’ have made some adjustments and investments that should benefit Gausman. For starters, they almost completely abandoned their defensive shifting strategy toward the end of last season. Only 17.4% of Gausman’s pitches in the last month of the season came in front of an infield shift. In the season’s first month, that number was 90.3%. Toss in the rule changes restricting shifting and Gausman will pitch in front of a lot more standard alignments in 2023.
Beyond that, the Jays prioritized glovework in their off-season transactions. Out are Lourdes Gurriel and Teoscar Hernández, two poor defenders, and in are Daulton Varsho and Kevin Kiermaier, two excellent defenders. Similarly, Toronto’s catchers should be more familiar and comfortable calling pitches for Gausman, which should allow for some improvement in sequencing and location selection.
Finally, the single best reason to buy into Kevin Gausman is the quality of his pitches. If anything, he was better last season than the year before. That’s what the PLV data suggests, and other pitch quantifier models like Cameron Grove’s Pitching Bot and Eno Sarris’ Pitching+ also support that conclusion. With pitch qualities as good as ever, an improved and better fitting defense behind him, and the swings of fortune seemingly in his favor, 2023 figures to be an excellent campaign for Kevin Gausman.
Photo by Gerry Angus/Icon Sportswire | Featured Image by Ethan Kaplan (@DJFreddie10 on Twitter and @EthanMKaplanImages on Instagram)
Surprising to see how much went wrong for Gausman last year and he still put up a decent statline. It seems like his WHIP will definitely improve due to less shifts, better defense, and his BABIP reaching a more normal level.