


Ever since Major League Baseball launched Statcast in 2015, exit velocity has been a popular metric to look at within the fantasy baseball community. The harder you hit the ball, the better the chance of success. Everyone knows that, and now we have a way to quantify it. Obviously, not every batted ball by a given hitter will have the same exit velocity, so it makes intuitive sense to look at the average of all batted ball events to evaluate his quality of contact. However, is this the correct way of thinking? For a player whose average launch speed is 90 mph, should an 80 mph ball in play hold as much negative value as a 100 mph’s positive value?
Data Visualization by @Kollauf on Twitter
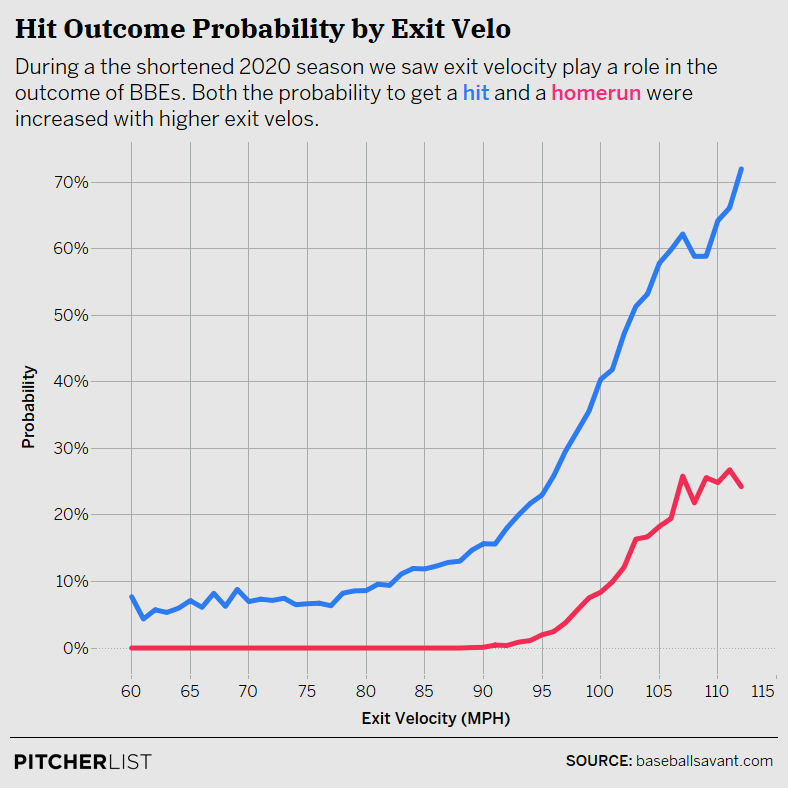
As you can see, the relationship between exit velocity and the probability of a hit or home run is very nonlinear. Therefore, average exit velocity may not be such a useful measure. We need to factor in the entire distribution of a player’s exit velocity, most emphatically the right tail, not just the average. Here’s an example of where average exit velocity can be misleading:
| Batter | 10th | 25th | 50th | 75th | 90th | 99th |
|---|---|---|---|---|---|---|
| David Peralta | 69.7 | 80.3 | 89.9 | 99.7 | 106.9 | 112.3 |
| Eduardo Escobar | 73.7 | 82.3 | 89.7 | 96.4 | 101.9 | 106.4 |
David Peralta and Eduardo Escobar both had nearly the same 50th percentile (median) exit velocity in 2020, but their distributions have much different shapes. Although the left tail of Escobar’s distribution is greater than Peralta’s, we know from the graph above that there isn’t really a difference between 70 miles per hour and 74 miles per hour in terms of batted ball success. On the other hand, 102 and 107 can make a significant difference in terms of home run probability. Based on this information alone (no, this is not the end-all-be-all), we should consider Peralta the better hitter. At the end of the day, your hardest-hit balls are going to make or break your expected success on batted balls.
Sustainability
OK, so now we know that 90th percentile exit velocity is useful in our analysis of hitters. But is it something that correlates well year over year? Is the top of a given player’s exit velocity distribution likely to be similar the following year? Let’s take a look at a chart describing the correlation of different percentiles of the exit velocity distribution year-over-year.
| Percentile | YOY R^2 |
|---|---|
| 10th | 0.328 |
| 25th | 0.379 |
| 50th | 0.499 |
| 75th | 0.715 |
| 90th | 0.810 |
As the percentile increases, the R^2 gets stronger. Not only is the right tail the most important part of the distribution, but it is also the most sustainable. From the earlier example, we can conclude with confidence that David Peralta had a more favorable exit velocity profile than Eduardo Escobar in 2020 because the tail in his distribution was better. If you notice, the chart above includes all batters with at least 100 batted ball events in both year_n and year_n+1. What if we increased the sample size? What if we decreased it? Would 90th percentile exit velocity still be the most sustainable? Let’s take a look at another graph.
Data Visualization by @Kollauf on Twitter
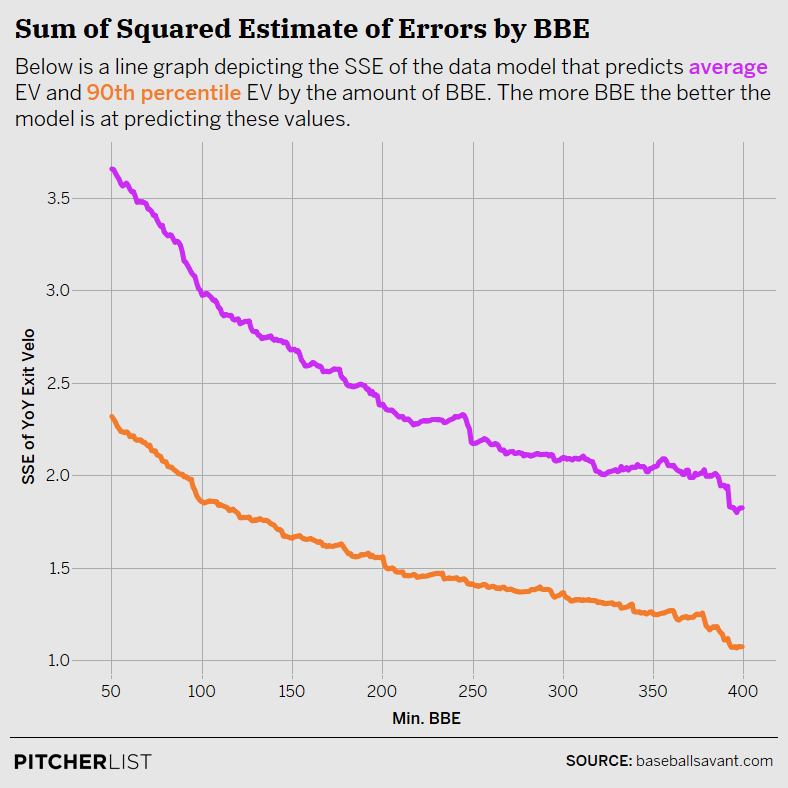
Whether the sample size is small or large, 90th percentile exit velocity is a significantly greater indicator of following season performance than mean exit velocity.
Predictability
We now know a player’s 90th percentile exit velocity is more sustainable than the middle of his range of outcomes. However, this is meaningless without knowing if the 90th percentile actually predicts success well. Let’s do a correlation analysis of three quality of contact metrics (average exit velocity, 90th percentile exit velocity, and hard-hit rate) versus success on batted balls.
| Metric | wOBAcon | HR/FB | wOBAcon_next | HR/FB_next |
|---|---|---|---|---|
| avg EV | 0.320 | 0.416 | 0.232 | 0.342 |
| 90th pct EV | 0.371 | 0.488 | 0.284 | 0.398 |
| HH% | 0.408 | 0.507 | 0.277 | 0.386 |
This is even more evidence that 90th percentile exit velocity is a much more valuable piece of information than average exit velocity. Although hard-hit rate seems to be more descriptive, 90th percentile exit velocity is the best of the three at predicting next year’s results. As you prepare for fantasy drafts this year, it may be a good idea to keep an eye on 90th percentile exit velocity and how you can use it to your advantage.
Leaderboards
Now we know that 90th percentile exit velocity is an extremely useful tool to use in our analysis of hitters. But how can we apply it? Let’s take a look at the leaders from 2020.
| Player | 90th PCT EV | Average EV |
|---|---|---|
| Miguel Sano | 110.54 | 94.73 |
| Fernando Tatis Jr. | 109.61 | 95.12 |
| Ronald Acuna | 109.50 | 93.18 |
| Franmil Reyes | 109.33 | 92.30 |
| Jonathan Schoop | 109.25 | 87.68 |
| Vladimir Guerrero Jr. | 109.21 | 92.60 |
| Manny Machado | 109.19 | 90.30 |
| Pete Alonso | 108.82 | 89.68 |
| Kyle Schwarber | 108.70 | 92.24 |
| Teoscar Hernandez | 108.60 | 92.86 |
This list looks slightly different than the Average Exit Velocity leaderboard. Jonathan Schoop is one player you may be surprised to see here. His Average Exit Velocity (87.7 mph) was actually below league average in 2020. However, as we proved earlier, the middle of the distribution is irrelevant compared to the right tail. Schoop recently re-signed with Detroit; given a clear path to playing time, he will certainly make his way on my list of players to monitor late in drafts. Additionally, Pete Alonso, who struggled in 2020 relative to his impressive rookie year, ranks in the top ten here. Perhaps this points towards a potential bounce-back campaign for Alonso in 2021.
| Player | Avg EV Rank | Pct 90 EV Rank |
|---|---|---|
| Jonathan Schoop | 136 | 5 |
| Luis Robert | 161 | 31 |
| Maikel Franco | 167 | 51 |
| Edwin Encarnacion | 189 | 73 |
| Hunter Dozier | 169 | 61 |
| Adalberto Mondesi | 188 | 85 |
| Player | Avg EV Rank | Pct 90 EV Rank |
|---|---|---|
| Mookie Betts | 23 | 130 |
| Asdrubal Cabrera | 88 | 189 |
| Anthony Rendon | 60 | 154 |
| Justin Turner | 37 | 128 |
| Victor Reyes | 79 | 163 |
| Will Smith | 31 | 113 |
Searching for similar patterns, the previous charts display the biggest differences in league rank between average exit velocity and 90th percentile exit velocity. At the top, you see Jonathan Schoop’s name again, as the biggest riser. Hunter Dozier is another player whose batted ball profile may not have been as bad as it seems at face value. With an NFBC ADP of 230, he may provide late value.
On the negative list, you find names like Mookie Betts and Anthony Rendon, two of the best hitters in the league. Here is where I should remind you that 90th percentile exit velocity is not the all-encompassing hitting predictive metric. It is a small piece of the puzzle that many fantasy baseball players may overlook. I am not telling you to avoid drafting Betts or Rendon. It is pretty easy to find evidence that both are excellent hitters, regardless of where they may rank in 90th percentile exit velocity.
Conclusion
One of the best part about baseball is the amount of data that is publicly available. On the downside, this means we need to dig deep to find edges in many fantasy leagues. When you find an angle that your league mates don’t know about, it provides an opportunity for a huge advantage. 90th percentile could be an example of just that, as most fantasy baseball players may be unaware of its importance. Always remember, like just about any other metric, use 90th percentile exit velocity as a tool in your analysis, not as the entire basis of your draft strategy.
Photo Miguel Sano by Andy Witchger/Wikimedia Commons/flickr | Adapted by Doug Carlin (@Bdougals on Twitter)
Another similar approach as opposed to relying on the arbitrary line of where 10% of balls are hit above a certain EV, instead set an inflection point and then determine what % of each player’s BBE exceed the inflection point and rank that way. 102.5 EV seems like a strong inflection point in the first graph (the point at which roughly 50% of BBE go for hits and 15% for for HR). Knowing that a player gets 25% of his BBE at/above this level vs. 12% could be very meaningful
Any chance we could get a quick tutorial on how to pull these stats ourselves? A quick look on BS and I can’t find it.
This is very helpful for HRs — flyballs; however, there are hitters that get lost in this analysis that utilize line-drives. High EV for line-drives isn’t the most effective for average, so could these distributions be separated for batted ball results?