


There have been plenty of attempts to quantify how much the Astros gained through their cheating scheme, and frankly, most of them aren’t great. The number of assumptions that we have to make in search of theories to test — did they only use it at home? did every player use it in the same ways? did it make them better at independently identifying pitches or worse? — are too high for us to know what to do going forward. And the team’s injuries this year have made evaluating them fairly pretty difficult.
After dropping three games in a row to the lowly Rangers to close out their season, they’ll face off against the Twins in the Wild Cards round as the sixth seed despite having a losing record. After losing Gerrit Cole and Justin Verlander, who finished first and second in AL Cy Young voting last year, this pitching staff is a shell of its former self. Injury issues have consistently hamstrung their batters, knocking them off their perch as the best offensive team in the MLB.
But I’m not here to write their obituary. I’m here to complain about Dusty Baker’s lineups.
What Has Dusty Done?
When Dusty was hired, he arguably had one of the easiest on-the-field jobs in baseball. The team didn’t platoon last year, and it still doesn’t this year. The most difficult decision that he was likely to make was how to integrate Kyle Tucker into the lineup, and Yordan Álvarez’s knees made that decision for him. Other injuries have hobbled the Astros this year (Alex Bregman’s hamstring, George Springer’s wrist, Michael Brantley’s quad, Carlos Correa’s foot), but he hasn’t made any serious decisions about who plays.
And that’s sort of been the problem.
Before I get into anything too crazy, I want to start with this chart, which shows the expected runs from each possible situation.
| Baserunners | None Out | 1 Out | 2 Out |
|---|---|---|---|
| None | 0.5439 | 0.2983 | 0.1147 |
| First | 0.9345 | 0.5641 | 0.2422 |
| Second | 1.1465 | 0.7134 | 0.3391 |
| Third | 1.3685 | 0.9528 | 0.3907 |
| First & Second | 1.5371 | 0.9792 | 0.4666 |
| First & Third | 1.7591 | 1.2186 | 0.5182 |
| Second & Third | 1.9711 | 1.3679 | 0.6151 |
| Loaded | 2.3617 | 1.6337 | 0.7426 |
This table is linear, so we can use it to calculate the odds of a baserunner scoring from each situation.
| Base | None Out | 1 Out | 2 Out |
|---|---|---|---|
| First | 39.06% | 26.58% | 12.75% |
| Second | 60.26% | 41.51% | 22.44% |
| Third | 82.46% | 65.45% | 27.60% |
I’ve written about these tables before in terms of bunting, but this time I want to focus on how much even just one out changes how likely a batter is to score. This is why it’s important to bunch the best batters together in a lineup. It’s not just important to avoid outs when you have runners on base; it’s important not to start an inning with an out because that will hurt the scoring chances of anyone else who reaches base. Teams know this, and that’s why they typically place their best hitters at the top of the lineup to give them the maximum number of PAs. It’s possible to get more advanced than that, and teams pay analysts serious money to squeeze a few extra runs out of the talent they have on hand. But the basics aren’t rocket science.
Leaguewide, here’s what batter production looks like per lineup spot.
| Order | PA | HR | RBI | R | R% | BA | OBP | SLG | wRC+ |
|---|---|---|---|---|---|---|---|---|---|
| 1st | 8170 | 243 | 776 | 1140 | 35.1 | 0.258 | 0.334 | 0.418 | 105 |
| 2nd | 7956 | 332 | 1019 | 1146 | 33.8 | 0.254 | 0.333 | 0.453 | 112 |
| 3rd | 7768 | 289 | 1011 | 1049 | 30.3 | 0.262 | 0.348 | 0.449 | 115 |
| 4th | 7599 | 342 | 1093 | 1013 | 29.3 | 0.246 | 0.335 | 0.453 | 112 |
| 5th | 7417 | 273 | 1028 | 904 | 28.6 | 0.257 | 0.325 | 0.441 | 107 |
| 6th | 7213 | 259 | 862 | 818 | 26.3 | 0.243 | 0.319 | 0.420 | 100 |
| 7th | 7018 | 204 | 785 | 750 | 28.4 | 0.220 | 0.293 | 0.369 | 80 |
| 8th | 6799 | 212 | 776 | 796 | 31.3 | 0.229 | 0.298 | 0.387 | 86 |
| 9th | 6566 | 150 | 628 | 728 | 30.8 | 0.224 | 0.303 | 0.351 | 80 |
| Total | 66506 | 2304 | 7978 | 8344 | 30.6 | 0.245 | 0.322 | 0.418 | 100 |
R% is something of my own making: it’s the percentage of the time a player scored after reaching base, excluding their own home runs. As you can see, having good players behind you matters, but so too does having decent players ahead of you in the order. Batters hitting ninth have similarly strong hitters batting them in as those hitting first and second. However, they are more likely to reach base with outs on the board, and so they score a lower percentage of the time.
So what does this have to do with the Astros?
| Order | PA | HR | RBI | R | R% | BA | OBP | SLG | wRC+ | wRC+ Rank |
|---|---|---|---|---|---|---|---|---|---|---|
| 1st | 275 | 14 | 38 | 42 | 35.4 | 0.252 | 0.330 | 0.479 | 123 | 9th |
| 2nd | 267 | 5 | 21 | 39 | 45.3 | 0.220 | 0.293 | 0.340 | 79 | 27th |
| 3rd | 261 | 8 | 33 | 30 | 26.2 | 0.271 | 0.341 | 0.445 | 119 | 17th |
| 4th | 255 | 8 | 32 | 33 | 30.1 | 0.267 | 0.349 | 0.457 | 123 | 9th |
| 5th | 250 | 10 | 39 | 30 | 27.0 | 0.256 | 0.312 | 0.467 | 111 | 15th |
| 6th | 240 | 6 | 26 | 22 | 22.9 | 0.241 | 0.304 | 0.377 | 91 | 19th |
| 7th | 234 | 8 | 27 | 34 | 43.3 | 0.229 | 0.286 | 0.421 | 93 | 7th |
| 8th | 227 | 6 | 25 | 30 | 40.7 | 0.211 | 0.270 | 0.354 | 72 | 23rd |
| 9th | 220 | 4 | 27 | 19 | 22.7 | 0.203 | 0.316 | 0.302 | 80 | 16th |
| Total | 2229 | 69 | 268 | 279 | 32.3 | 0.240 | 0.312 | 0.408 | 99 | 17th |
Batters second in the order have been nothing less than a black hole for the Astros. Their 79 combined wRC+ is 27th in the league from that spot! It’s noteworthy, though, that those batters have scored 45% of the time that they have made it safely on base, good for nine more runs than if they’d been stranded at the league-average rate for that spot. It’s possible that there’s more to that, such as good baserunning or reaching base with no outs an unusually high percentage of the time. But the most likely explanation is that the 3-4-5 hitters have made the most out of the poor chances that the second hitters have created and masked just how terribly Dusty’s lineups have been built.
But this isn’t the only potential issue. Their leadoff hitters have led the team in home runs and have been second overall in both wRC+ and SLG, but that production has almost certainly left runs on the board considering the dismal on-base rates they’ve gotten out of the bottom third of their lineup. That their seventh and eighth hitters have scored more than 40% of the time they’ve reached base is very unusual and probably unsustainable.
So who’s been the culprit behind this poor production? It’s more complicated than just saying it’s José Altuve, but it’s José Altuve.
| Pos | Name | PA | HR | RBI | R | BA | OBP | SLG | wRC+ |
|---|---|---|---|---|---|---|---|---|---|
| C | Martin Maldonado | 165 | 6 | 24 | 19 | 0.215 | 0.35 | 0.378 | 110 |
| 1B | Yuli Gurriel | 230 | 6 | 22 | 27 | 0.232 | 0.274 | 0.384 | 79 |
| 2B | José Altuve | 210 | 5 | 18 | 32 | 0.219 | 0.286 | 0.344 | 77 |
| SS | Carlos Correa | 221 | 5 | 25 | 22 | 0.264 | 0.326 | 0.383 | 97 |
| 3B | Alex Bregman | 180 | 6 | 22 | 19 | 0.242 | 0.35 | 0.451 | 122 |
| LF | Kyle Tucker | 228 | 9 | 42 | 33 | 0.268 | 0.325 | 0.512 | 125 |
| CF | George Springer | 222 | 14 | 32 | 37 | 0.265 | 0.359 | 0.54 | 146 |
| RF | Josh Reddick | 210 | 4 | 23 | 22 | 0.245 | 0.316 | 0.378 | 95 |
| DH | Michael Brantley | 187 | 5 | 22 | 24 | 0.3 | 0.364 | 0.476 | 134 |
| IF | Abraham Toro | 97 | 3 | 9 | 13 | 0.149 | 0.237 | 0.276 | 46 |
| CF | Myles Straw | 86 | 0 | 8 | 8 | 0.207 | 0.244 | 0.256 | 39 |
| UT | Aledmys Díaz | 59 | 3 | 6 | 8 | 0.241 | 0.254 | 0.483 | 97 |
| IF | Jack Mayfield | 47 | 0 | 3 | 5 | 0.19 | 0.239 | 0.214 | 28 |
| C | Dustin Garneau | 46 | 1 | 4 | 4 | 0.158 | 0.273 | 0.289 | 62 |
| DH | Taylor Jones | 22 | 1 | 3 | 3 | 0.19 | 0.227 | 0.381 | 63 |
| UT | Garrett Stubbs | 10 | 0 | 1 | 1 | 0.125 | 0.111 | 0.125 | -46 |
| DH | Yordan Álvarez | 9 | 1 | 4 | 2 | 0.25 | 0.333 | 0.625 | 159 |
Let’s dig in.
José Altuve, Volume Hitter?
One of the things that can appear confusing about Altuve’s profile is how unconventional it has been in comparison to most other elite hitters, and one that just looking at Statcast sliders can discount. During his 2017 MVP season, Altuve managed just a 28.5% hard hit rate and a 6.7% barrel rate. For many hitters, that’s going to mean being stuck in the bottom third of the lineup. But because he struck out just 12.7% of the time and walked just 8.8% of the time, 80% of his plate appearances ended in a ball-in-play. Compare that to Joey Gallo, who put a ball into play in less than half of his 2017 plate appearances.
Yes, this is an on-purpose ridiculous example. But the differences in the shape of their production reflect completely different paths to being a valuable contributor to a winning baseball team. Players like Gallo are going to generate their slugging numbers through home runs and their OBP through walks, whereas Altuve-types just don’t get out. But just because Gallo’s .547 SLG in 2017 was higher than Altuve’s .537 mark doesn’t mean the big guy was better. That’s why wOBA exists: to properly weigh how much value a home run adds compared to a single or an out. In Altuve’s MVP season, his .405 WOBA was ninth in the MLB. Gallo’s .364 mark was 43rd. The lesson is pretty clear: not getting out is one of the most valuable skills in the game.
The two years since that MVP season have been somewhat wacky for Altuve. In 2018, almost nothing changed in his “inputs” — he hit the ball about as hard, about as often, and in about the same direction as in the prior two years, but his home runs dropped off from 24 a year to just 13. Then in 2019, his barrel rate ticked up about three percent and he hit 31 home runs. Some of this was Altuve pulling more of his hard-hit balls into the Minute Maid Park’s right-handed cheat-code Crawford Boxes (for more on this, check out Dan Richards’ work on home run park factors) and some of it was probably the rabbit ball.
But this year has been a disaster for Altuve. Rather than just citing the usual buffet of descriptive Statcast numbers that make up the sliders and talking about how red or blue they are, I want to look a little deeper. I like the combination below because it tells us how often Altuve is putting balls into play and what happens when he does without any stats that tell us what the outcomes were, which can be fairly random.
| Season | Hard Hit% | Sweet Spot% | Barrel% | Weak Contact% | K% | BB% |
|---|---|---|---|---|---|---|
| 2015 | 28.8 | 31.2 | 3.1 | 4.1 | 9.7 | 4.8 |
| 2016 | 36.4 | 39.5 | 6.9 | 3.1 | 9.8 | 8.4 |
| 2017 | 28.5 | 34.2 | 6.7 | 5.5 | 12.7 | 8.8 |
| 2018 | 33.8 | 34 | 5.9 | 4.1 | 13.2 | 9.2 |
| 2019 | 34.5 | 28.4 | 8.1 | 4.7 | 15 | 7.5 |
| 2020 | 33.3 | 24.8 | 4.6 | 8.5 | 18.6 | 8.1 |
So what’s changed with Altuve? He’s still walking about as often, and he’s still hitting the ball about as hard as he previously had. But he’s striking out more, and some digging points to a five-point increase in his chase rate. His sweet spot rate also plummeted, meaning he’s has been that he’s been hitting far more balls into the “waste” areas of the spray chart, directly into the ground and straight into the air.
I had a hunch that these were related, so I took a look at his swing/take profile from the last two years to see what he was and wasn’t doing well. We’ll start with 2019.
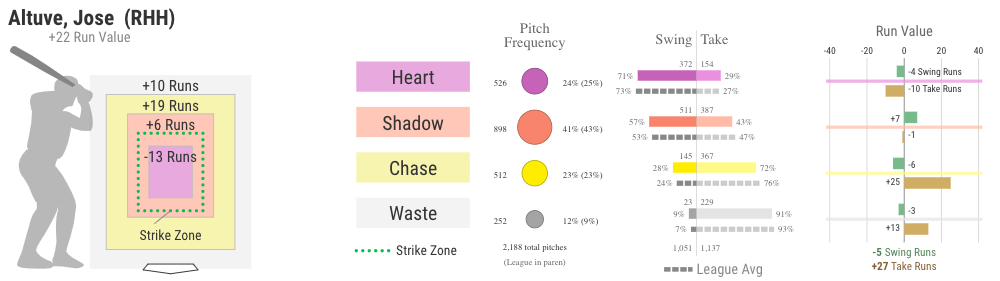
Here, we see that Altuve’s value came in large part from laying off of poor pitches, letting him put his bat to more of the competitive pitches. Relative to the rest of the league, he did less damage to them, but by not generating outs on the bad stuff, he made his way on base.
Here’s 2020.
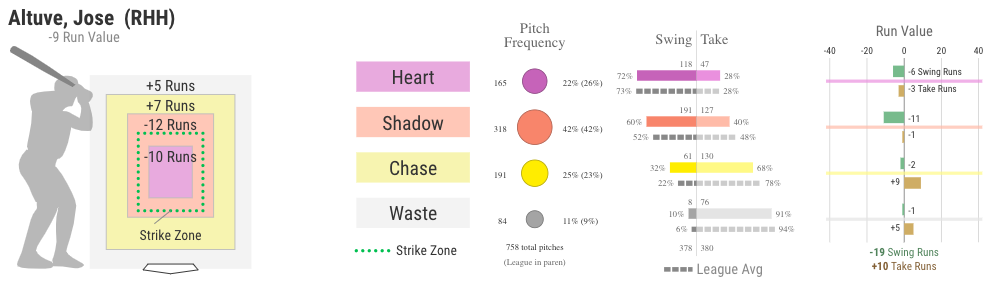
His swing rate in the “chase” zone is up — this is basically the same info as his O-swing increasing, but now we can quantify its impact. And we say that, in total, Altuve’s gone from a truly elite hitter against the chase zone to a just decent one. The bigger difference is that he quality of contact and results in the shadow zone, where competitive breaking pitches typically end up, has plummeted. But, going back to his contact statistics, he’s still hitting these balls just as often. His chase contact rate sits at 67.3%, just barely down from his 68.6% mark. The difference is that he’s swinging at them more, and he’s hitting them poorly. These are the pitches that are contributing to his terrible sweet spot rate.
To emphasize how his change has affected him, I re-scaled his contact profile to show how often an outcome happened as a percent of his plate appearances. This approach is imperfect — foul balls are muddling the data — but because any errors I’m making are consistent across all years, the trends still hold.
| Season | Hard Hit/PA | Sweet Spot/PA | Barrels/PA | Weak Contact/PA | K% | BB% |
|---|---|---|---|---|---|---|
| 2015 | 24.6 | 26.7 | 2.7 | 3.5 | 9.7 | 4.8 |
| 2016 | 29.8 | 32.3 | 5.6 | 2.5 | 9.8 | 8.4 |
| 2017 | 22.4 | 26.8 | 5.3 | 4.3 | 12.7 | 8.8 |
| 2018 | 26.2 | 26.4 | 4.6 | 3.2 | 13.2 | 9.2 |
| 2019 | 26.7 | 22.0 | 6.3 | 3.6 | 15 | 7.5 |
| 2020 | 24.4 | 18.2 | 3.4 | 6.2 | 18.6 | 8.1 |
Viewed this way, we can really see how much that uptick in strikeouts is affecting him. Altuve is ending a plate appearance with a ball hit at the ideal launch angle less than 20% of the time, which drastically limits his opportunities to record a hit. Here’s how this is affecting his outcomes.
| Season | BA | OBP | SLG | HR/PA | wOBA | wRC+ |
|---|---|---|---|---|---|---|
| 2015 | 0.313 | 0.353 | 0.459 | 0.022 | 0.347 | 124 |
| 2016 | 0.338 | 0.396 | 0.531 | 0.033 | 0.391 | 152 |
| 2017 | 0.346 | 0.41 | 0.547 | 0.036 | 0.405 | 160 |
| 2018 | 0.316 | 0.386 | 0.451 | 0.022 | 0.364 | 134 |
| 2019 | 0.298 | 0.352 | 0.550 | 0.057 | 0.374 | 138 |
| 2020 | 0.219 | 0.286 | 0.344 | 0.024 | 0.274 | 77 |
In some respects, 2019 was something of a harbinger of his decline. Despite the uptick in HR adding to his hit total, his average and OBP actually dropped. Now that he’s hitting home runs at a rate more in line with his established career floor, the house of cards has collapsed.
Where Do the Astros Go From Here?
This is a piece about team management, not about fixing José Altuve. And that’s because their batting order issues are larger than Altuve, even if he’s been the most glaring example.
I feel obligated to acknowledge that Baker did displace Altuve from the top end of the order, at least for a little while. On August 15th, Altuve was dropped to seventh in the order in a win against the Mariners. He moved up to sixth for the next three games, and then promptly gave him his spot back in the lineup. He went 4-15 with a .000 ISO and no walks in that time period. Equally telling as Baker’s hesitance to move Altuve when he struggled was how he replaced him: by slotting in Josh Reddick, who now has three consecutive seasons under his belt with a wRC+ under 100.
By narrowly viewing his team in certain roles rather than showing a willingness to experiment, Baker almost certainly left dozens of runs on the board. When George Springer rested, it was typically Myles Straw who replaced him in the leadoff spot. Yuli Gurriel held on to his spot in the heart of the team’s order despite struggling mightily, and Martin Maldonado’s unexpectedly strong year was somewhat wasted batting 9th.
In a different world, we could have seen long stretches of the year where Michael Brantley and his team-leading .364 OBP lead off, followed by Bregman and Springer. Kyle Tucker, who is second in batter WAR for the team, could hit cleanup, and Maldonado’s 110 WRC+ would have suited him just fine fifth in the order, especially against righties. Carlos Correa, Gurriel, Altuve, and Reddick wouldn’t be permanently sent down to the bottom of the order — Gurriel and Correa in particular feasted on lefties this year, and could move up against them, with Brantley potentially moving down.
Calling for mixing and matching lineups based on lineups and performance shouldn’t be revolutionary. Their first-round opponents, the Minnesota Twins, have experimented with lineups for the better part of two years, even batting a catcher at leadoff in the playoffs last year. The Oakland A’s, who won the Astros’ division, have made a habit of moving batters around in their order depending on platoon situations. The White Sox have different lineup orders for lefties and righties. It doesn’t take a payroll stuffed with hedge fund titans and computer science PhDs to figure this out — these numbers can be found on the internet for free!
There’s an entirely defensible position that having Dusty Baker bungle the Astros’ lineups and in-game choices is a form of punishment beyond what the MLB brought down on them, and I take no stance on that for the purposes of this piece. But when the Astros decide to move on from him, I just ask that no other team subject themselves to this mess. Winners learn, adapt, and grow over time. Losers continue to bat struggling players second because they have a $26m base salary.
Photo by Juan DeLeon/Icon Sportswire | Adapted by Justin Paradis (@freshmeatcomm on Twitter)
Wow that graphic is cool
You think managing platoons is difficult? I think its more difficult to stick with a player and identify real talent than simply look at a spreadsheet of splits and match-up data – a monkey could hold up that report which would be generated by pressing print on a public website. The real skill is knowing that a few fluky ABs or overly broad or overly specific generalizations don’t really justify decisions. I find the idea that analysts squeeze out runs to be laughable. Every bit of credit is due to the players and it doesn’t happen because of match-up data. I can assure you that they will squeeze out runs with or without analysts. IMO You greatly overvalue a lot of things that don’t matter. It is also the mechanism for promoting your own work – its cyclical, predictable and necessary for analysts to do this. Kyle Tucker is a good counterexample to your lines of thinking. He is not a great hitter but he has been in the middle of a lot of run production. The warm body occupying his lineup spot will be in the middle of run production – its not strategy, its inevitable. I would bet you that in the best case, the analysts engage in a zero sum game and I my instincts tell me that they are a net negative. You have the problem of thinking that MLB baseball is a giant simulation – its not. I think we have OOTP to thank for this.
All this amounts to is an elaborate attempt to qualify Altuve’s poor season in terms of run production. Literally almost any metric would reach a similar conclusion.
Min is about to go home and Hou is about to advance as I write this comment. Min played things super cute and while we cant really conclude that it cost them, it didn’t appear to improve their run scoring. There is an old saying in sports and it is something along the lines of you need to dance with the girl that you came with… I would biol it own to let the players play or you want your best players on the field – I don’t think having a bunch of folks that stumble through the basics of the game really contribute to success of the players. The getting canned should be Rocco if you insist on that type of negativity. They started a player with zero hits in his career and jerked around players and it probably cost them their season, but on the plus side they didn’t engage in any old school tactics.