


Something strange is happening in Oakland. When the “Launch Angle Revolution” began, we started seeing hitters change their approach to hit the ball in the air to hit more home runs. Prime examples of individuals doing this were players like Justin Turner and JD Martinez who went from Quad-A players to All-Stars seemingly overnight. Those are examples of individual players going out of their way to change their swing and approach, but there are some teams that are doing this on an organizational level.
The team most infamous for using advanced statistics to obtain a competitive edge will probably always be the early 2000s Oakland A’s (specifically 2002). This is due to the release of the book Moneyball by Michael Lewis and the subsequent movie that was released starring Brad Pitt and Jonah Hill. The A’s are well known for looking for players that were miscast as “flawed” before they have had the chance to succeed. The overarching theme of the Moneyball philosophy is to find cheap players who can give you similar levels of performance as players who are more expensive. However, due to how popular the story of the A’s became and how fast other teams adapted to implementing advanced statistics into their front offices, they lost their original competitive advantage.
Once the secrets are out, teams need to try and find new secrets to stay ahead of the pack. For the A’s, there is one statistical philosophy that stood out to me as something that A’s must be emphasizing at the major league level. Increasing each of their hitter’s launch angle to hit the ball in the air more often. This observation of mine is not exactly the most insightful out there as seemingly every team is trying to hit the ball out of the ballpark. Where the difference comes in is how drastic the change in launch angle some of their hitters have seen in recent years.
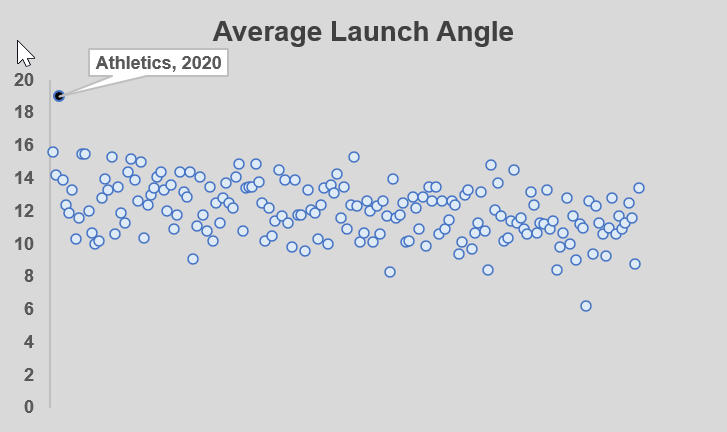
In the visualization above, you can see each team’s season average launch angle over the last five years. In the top left corner, you can see this year’s Oakland A’s at an average 19-degree launch angle, which is the highest of any team in the Statcast era by quite a bit (the second highest is the 2020 Angels at 15.6-degrees). Of course, we do not have a full season’s worth of data, but they are just so far above every other team in recorded history that it is something we need to be talking about more.
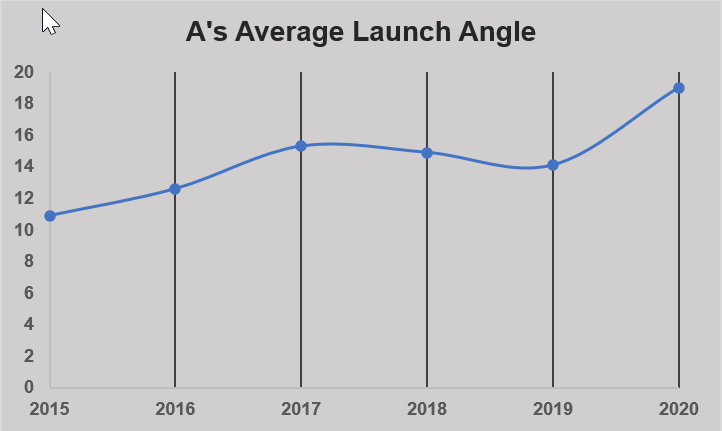
There has been a steady increase in their launch angle over time which only makes this look like something they have been embracing for at least a couple years. Obviously, the general idea behind increasing your average launch angle is to hit more home runs, but this begs the question of whether there is a relationship between a team’s average launch angle and their success at the plate. Using the extremely nifty website Baseball Savant, we can use other hitting statistics and run-scoring metrics to determine if a relationship exists.
In the image below, you will find a correlation matrix based on expected hitting statistics and the other run-scoring metrics mentioned above. For those who might not be familiar with what a correlation coefficient is, it is a number between 1.0 and -1.0 which determines if there is a relationship between two different variables. For example, hitters with a high xSLG% should also have a high xwOBA because the correlation coefficient between those two variables is extremely close to one. If the correlation coefficient is close to -1 then it is saying the two variables seem to have an inverse relationship with each other where when one rises, the other one should fall. Typically, anything above .7 or below -.7 indicates that a strong relationship might exist. The closer you get to 0, the less significant your result will probably end up being.
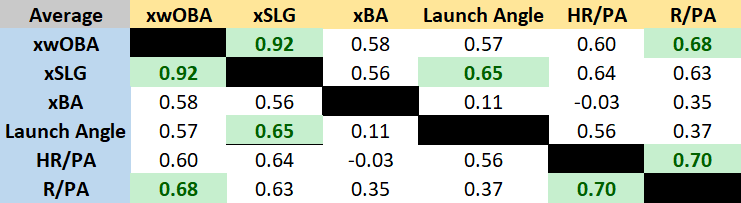
Let us start by looking at variables that seem to have a strong relationship with Launch Angle. Fortunately, we have a variable (xSLG) that seems to have somewhat of a positive relationship with the launch angle. This makes sense as the more you hit balls into the outfield, the more likely you are to record an extra-base hit. So, we know an increase in a hitter’s launch angle should be accompanied by an increase in their SLG%. This is valuable information because now we can look at the xSLG variable and see that there is an extremely strong relationship between xSLG and xwOBA. This makes sense because there is somewhat of a correlation between xwOBA and launch angle.
Every plate appearance is a battle between the hitter and the opposing team’s pitching and defense. Your goal as an organization should be to maximize the number of runs you score to help you win more games (Wow, how insightful Joe). By taking each team’s total runs scored and dividing it by the number of plate appearances they had in a season, we can see which teams are getting the most value out of each plate appearance. The same is done with each team’s total number of home runs. The correlation matrix tells us that teams that have a higher R/PA generally have a higher xwOBA. We already bridged the gap between launch angle and xwOBA, and the R/PA relationship with launch angle is showing a potential relationship between the two.
Using the information, we gathered from the correlation matrix we can conclude that there is certainly some type of link between a hitter’s average launch angle and their success at the plate. This could be part of the motivation behind the A’s steady increase in launch angle over the last couple of years. However, we do not know for sure that this is in fact something they are doing intentionally or if they are making some other change to hitters that just happens to be linked to increasing their launch angle. One way we can attempt to support our hypothesis is to look at individual players who have come to the A’s from other organizations or left the A’s for another team and see if there is a change in their average launch angle.
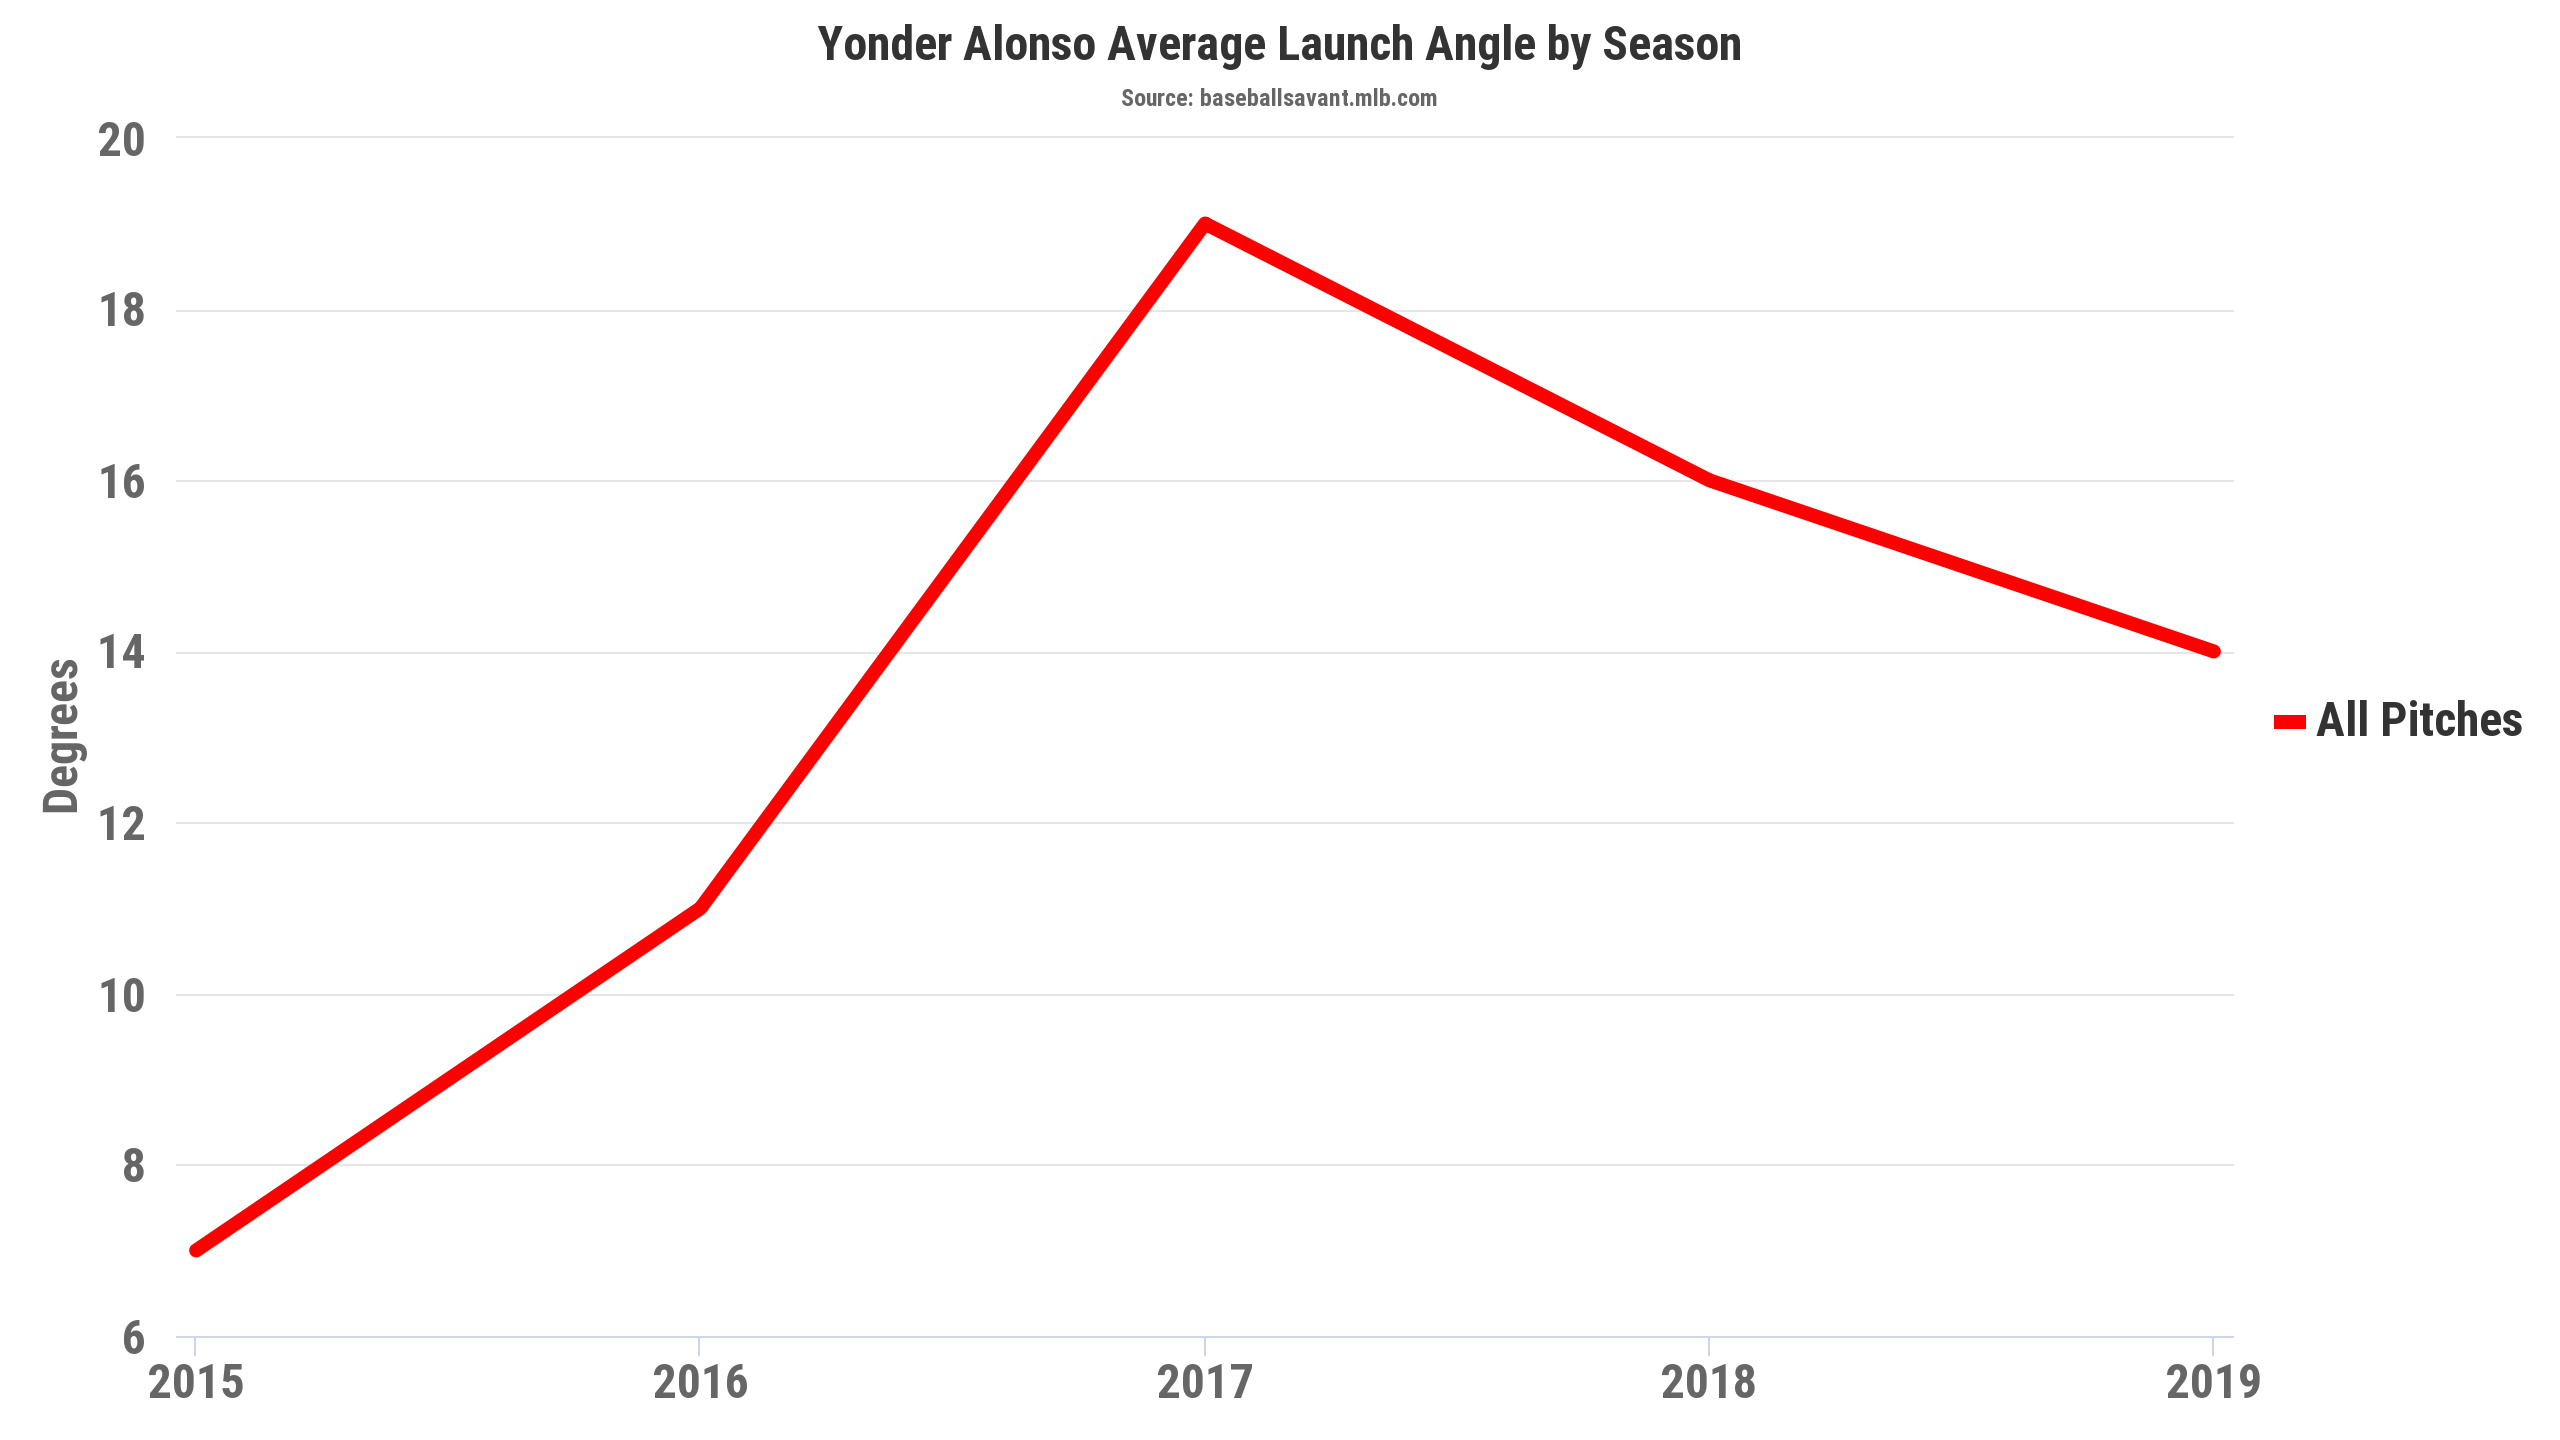
Yonder Alonso came to A’s in 2016 and struggled in his first year with the organization. However, his 2017 season was the first and only time he ever made an all-star team. He went from a below replacement level player in 2016 to an all-star while seeing an incredible increase in his launch angle. He was traded to the Mariners in July of 2017, and when he left Oakland, his hitting fell off quite a bit (139 wRC+ to 118). After the 2017 season, he saw his launch angle return to its original level and has not been an above-average hitter since 2017. This is just one case, but it is certainly interesting how the A’s were able to work with a player over a year and get him to lift the ball more and successfully turn a below replacement level player into a valuable trade chip (Boog Powell, who ended up being not great). We have looked at an example of a player coming to the A’s and then leaving, but what about when a player comes to the A’s and stays?
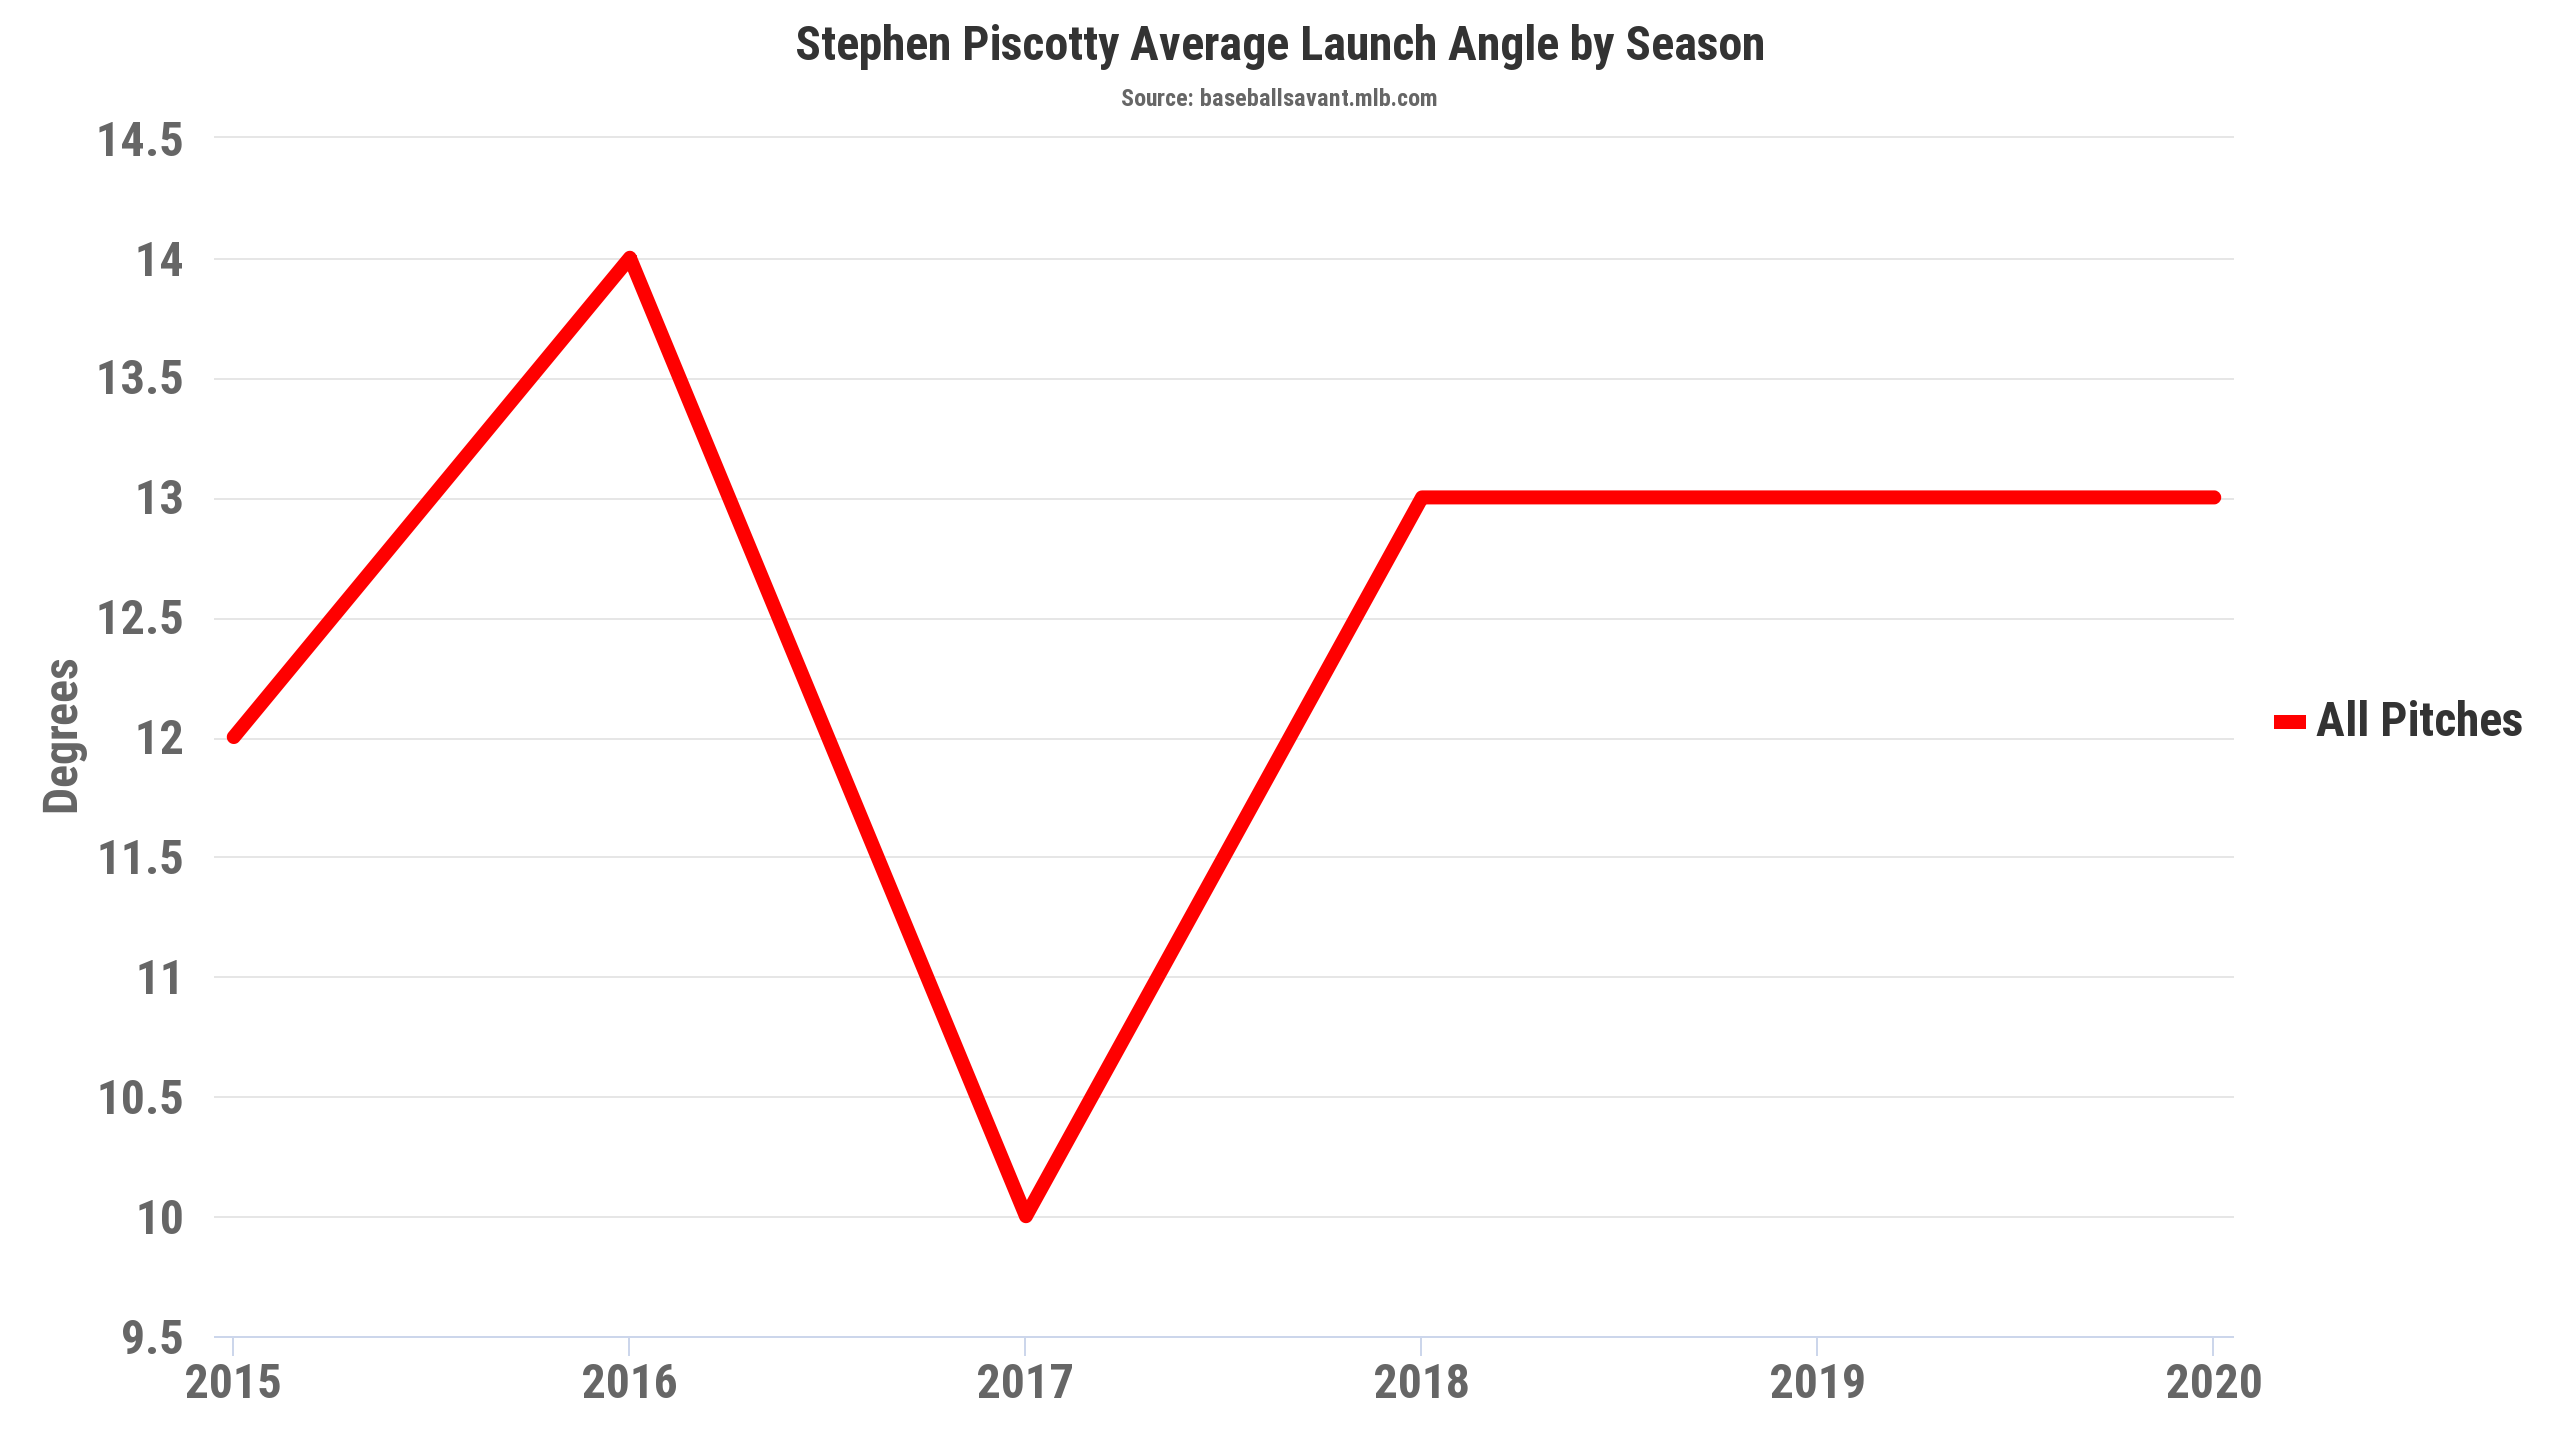
Above, we can see an example of a player who played in the majors for other teams and came to the A’s. Stephen Piscotty came to the A’s in 2018 and saw a dramatic increase in his launch angle from the previous year. That could be due to his mother’s battle with ALS in 2017, and he has returned to his 2015-16 form, but it is certainly noteworthy that he stopped lifting the ball in St. Louis and saw more success once coming to Oakland.

The second example is a more recent one with Robbie Grossman who came to the A’s in 2019 but was a below-average hitter. However, thus far in 2020, he has been nothing short of incredible. At age 30, he has a career-high in wRC+ (183) and fWAR (1.2). It is quite astounding that he has produced more WAR in 23 games this season than he has in any full season.
There are so many examples of A’s players increasing their launch angle as they spend more time in Oakland (Khris Davis, Marcus Semien among others) and the overall team trend shows that this could potentially be their approach when changing hitters’ swings. I doubt this is the only statistic the A’s are trying to maximize to develop their young players into better hitters and increase their offensive efficiency.
The “Launch Angle Revolution” has influenced the game in a way that could change how baseball is played for the rest of its existence. The A’s and their 19-degree launch angle are in first place in the AL West at 20-10, and whatever sauce they have cooking up there could be something other teams could take note of and potentially implement into their strategy.
Featured image by Justin Paradis (@freshmeatcomm on Twitter)
I love the A’s, my favorite team in any sport (Yes, we exist) and love to see them exploiting what they find as an advantage. But man, sometimes watching this squad will remind you of an elite beer league softball team haha. sometimes extremely frustrating not being able to get runners home from 3rd with less than 2 outs but i guess if you watch any team everyday you’ll notice the little things. Hope they can translate this into playoff baseball
I’m very high on this A’s team and I think they have a real shot at making a run to the WS. They just need to escape the 3 game wild card round and hope the Yankees lose or get hurt.
Another change I’ve noticed with Oakland over the past few years is more emphasis on defense (not that it matters much in fantasy baseball). Chapman and Olson both have multiple gold gloves. Laureano is an excellent defensive outfielder. Sean Murphy is an excellent defensive catcher. Semien is now considered a pretty good defensive SS. Overall, the As are considered one of the better defensive teams in the league.
Probably my least favorite part of the Moneyball movie was how Billy “didn’t care about defense” because it was actually the opposite of that. This A’s team is pretty incredible on the defensive end and it might be worth looking into how players like Semien transformed over the years.