(Photo by Kevin Abele/Icon Sportswire)
Welcome back to my series on pitching metrics. This week, I’m going back to my regular style of updates. This includes updated rankings, analysis of several individual pitchers, and a new table: PD scores for just the past 30 days. Last week, we discovered that the majority of strikeout outliers work themselves out in two moths of data, and so it can be helpful to look at smaller sample sizes.
Without further ado, here are the updated rankings:
TABLE A – QUALIFIED STARTERS
| Rank |
Name |
ERA |
Pitcher Score |
Previous Score |
Score Change |
PD Score |
Predicted K% |
Actual K% |
K% Difference |
BB% |
xSLG |
SLG-xSLG |
| 1 |
Max Scherzer |
1.95 |
105.9% |
101.4% |
4.5% |
111.7% |
35.6% |
39.4% |
-3.8% |
5.6% |
0.333 |
-0.025 |
| 2 |
Jacob deGrom |
1.49 |
105.5% |
104.3% |
1.2% |
103.0% |
31.4% |
33.9% |
-2.5% |
7.3% |
0.280 |
-0.017 |
| 3 |
Justin Verlander |
1.24 |
98.9% |
99.2% |
-0.3% |
91.2% |
26.8% |
31.9% |
-5.1% |
5.2% |
0.289 |
-0.041 |
| 4 |
Noah Syndergaard |
3.06 |
98.8% |
98.8% |
0.0% |
99.1% |
30.6% |
28.3% |
2.3% |
4.8% |
0.343 |
0.021 |
| 5 |
Chris Sale |
3.00 |
98.8% |
100.3% |
-1.5% |
102.3% |
32.1% |
34.0% |
-2.0% |
6.5% |
0.365 |
-0.015 |
| 6 |
Patrick Corbin |
2.87 |
96.4% |
98.1% |
-1.7% |
98.7% |
29.8% |
32.7% |
-3.0% |
6.9% |
0.372 |
-0.048 |
| 7 |
Gerrit Cole |
2.20 |
95.4% |
96.3% |
-0.9% |
94.1% |
29.8% |
38.2% |
-8.4% |
6.6% |
0.356 |
-0.045 |
| 8 |
Aaron Nola |
2.18 |
93.3% |
93.4% |
-0.1% |
85.3% |
24.1% |
24.9% |
-0.9% |
6.1% |
0.325 |
-0.055 |
| 9 |
Blake Snell |
2.36 |
93.1% |
91.0% |
2.1% |
91.1% |
27.9% |
29.5% |
-1.7% |
7.7% |
0.366 |
-0.042 |
| 10 |
Charlie Morton |
2.84 |
91.5% |
94.9% |
-3.4% |
86.8% |
26.8% |
31.2% |
-4.5% |
7.8% |
0.359 |
0.019 |
| 11 |
Trevor Bauer |
2.77 |
91.4% |
89.8% |
1.6% |
90.5% |
27.3% |
29.6% |
-2.4% |
8.5% |
0.384 |
-0.054 |
| 12 |
Sean Newcomb |
2.49 |
91.0% |
92.0% |
-1.0% |
77.3% |
22.3% |
24.2% |
-2.0% |
11.7% |
0.302 |
-0.019 |
| 13 |
James Paxton |
2.95 |
90.6% |
91.1% |
-0.6% |
90.2% |
26.5% |
30.9% |
-4.5% |
7.7% |
0.394 |
-0.058 |
| 14 |
Lance McCullers Jr. |
3.89 |
90.1% |
92.0% |
-1.9% |
88.7% |
26.6% |
25.5% |
1.1% |
9.6% |
0.390 |
-0.038 |
| 15 |
Masahiro Tanaka |
4.79 |
90.0% |
90.3% |
-0.3% |
98.5% |
28.9% |
23.4% |
5.5% |
6.5% |
0.456 |
-0.005 |
| 16 |
Luis Severino |
2.20 |
89.7% |
87.8% |
1.9% |
88.1% |
25.7% |
30.5% |
-4.9% |
6.3% |
0.391 |
-0.109 |
| 17 |
Vince Velasquez |
3.82 |
89.6% |
88.2% |
1.4% |
82.8% |
25.4% |
29.2% |
-3.9% |
8.1% |
0.357 |
0.063 |
| 18 |
Jon Gray |
5.68 |
89.6% |
88.8% |
0.8% |
88.4% |
27.4% |
26.2% |
1.2% |
6.6% |
0.395 |
0.058 |
| 19 |
Jose Berrios |
3.86 |
89.2% |
89.1% |
0.1% |
86.7% |
23.8% |
25.1% |
-1.3% |
4.8% |
0.388 |
-0.026 |
| 20 |
Kyle Gibson |
3.54 |
88.6% |
89.6% |
-1.0% |
87.8% |
26.4% |
25.5% |
0.9% |
10.5% |
0.404 |
-0.061 |
| 21 |
Carlos Carrasco |
4.50 |
88.3% |
89.1% |
-0.8% |
92.8% |
26.8% |
23.4% |
3.4% |
6.1% |
0.442 |
-0.031 |
| 22 |
Luis Castillo |
5.64 |
87.3% |
88.4% |
-1.1% |
96.3% |
30.2% |
22.0% |
8.2% |
8.9% |
0.478 |
-0.003 |
| 23 |
Alex Wood |
4.48 |
86.9% |
87.8% |
-0.9% |
87.2% |
24.0% |
22.6% |
1.4% |
4.9% |
0.423 |
-0.030 |
| 24 |
Dylan Bundy |
4.46 |
86.8% |
86.8% |
0.0% |
100.1% |
29.9% |
28.3% |
1.6% |
6.8% |
0.510 |
-0.016 |
| 25 |
Gio Gonzalez |
2.27 |
86.7% |
86.0% |
0.7% |
77.8% |
22.2% |
24.2% |
-2.0% |
9.4% |
0.362 |
-0.025 |
| 26 |
Corey Kluber |
1.96 |
86.7% |
85.6% |
1.1% |
82.6% |
22.7% |
27.5% |
-4.9% |
2.9% |
0.395 |
-0.067 |
| 27 |
Caleb Smith |
4.03 |
86.2% |
87.6% |
-1.4% |
84.3% |
24.4% |
29.6% |
-5.2% |
11.2% |
0.413 |
-0.055 |
| 28 |
Mike Clevinger |
3.36 |
86.1% |
86.5% |
-0.4% |
83.0% |
23.6% |
20.5% |
3.1% |
8.3% |
0.405 |
-0.023 |
| 29 |
Jameson Taillon |
3.97 |
85.8% |
84.8% |
1.0% |
78.2% |
20.1% |
22.1% |
-2.0% |
6.6% |
0.377 |
-0.013 |
| 30 |
Tyler Skaggs |
3.27 |
85.5% |
85.1% |
0.4% |
82.9% |
23.9% |
25.1% |
-1.3% |
7.9% |
0.413 |
-0.031 |
| 31 |
Tyler Anderson |
5.07 |
85.4% |
86.5% |
-1.1% |
83.2% |
24.7% |
20.4% |
4.3% |
9.6% |
0.416 |
0.073 |
| 32 |
Rick Porcello |
3.59 |
84.9% |
85.4% |
-0.5% |
75.2% |
19.4% |
22.3% |
-3.0% |
5.0% |
0.369 |
-0.007 |
| 33 |
Matt Boyd |
3.23 |
84.8% |
86.3% |
-1.5% |
75.7% |
21.8% |
18.6% |
3.2% |
8.5% |
0.374 |
-0.057 |
| 34 |
J.A. Happ |
4.08 |
84.6% |
86.4% |
-1.8% |
81.4% |
24.1% |
30.0% |
-5.9% |
6.9% |
0.415 |
-0.038 |
| 35 |
Zack Greinke |
3.44 |
84.5% |
86.2% |
-1.7% |
89.7% |
25.4% |
26.6% |
-1.3% |
3.8% |
0.471 |
-0.047 |
| 36 |
Tyson Ross |
3.31 |
84.2% |
85.2% |
-1.0% |
79.0% |
21.8% |
24.0% |
-2.2% |
8.8% |
0.404 |
-0.054 |
| 37 |
Stephen Strasburg |
3.20 |
84.2% |
82.8% |
1.4% |
85.3% |
24.7% |
29.3% |
-4.6% |
6.0% |
0.446 |
-0.068 |
| 38 |
Nick Pivetta |
3.48 |
84.0% |
83.6% |
0.4% |
81.8% |
23.3% |
27.6% |
-4.4% |
6.7% |
0.425 |
-0.079 |
| 39 |
Kevin Gausman |
4.63 |
83.7% |
84.1% |
-0.4% |
89.9% |
26.6% |
22.2% |
4.4% |
5.6% |
0.483 |
-0.006 |
| 40 |
Mike Foltynewicz |
2.22 |
83.4% |
81.4% |
2.0% |
71.4% |
20.8% |
28.2% |
-7.4% |
10.6% |
0.364 |
-0.040 |
| 41 |
German Marquez |
4.38 |
83.1% |
80.6% |
2.5% |
72.4% |
20.8% |
21.8% |
-1.0% |
9.5% |
0.374 |
0.056 |
| 42 |
Chris Archer |
4.24 |
83.0% |
83.4% |
-0.4% |
86.4% |
26.4% |
23.7% |
2.7% |
8.1% |
0.469 |
-0.050 |
| 43 |
Tanner Roark |
3.38 |
82.5% |
82.9% |
-0.4% |
76.5% |
20.9% |
21.2% |
-0.3% |
8.3% |
0.410 |
-0.062 |
| 44 |
Cole Hamels |
3.63 |
82.4% |
82.0% |
0.4% |
87.5% |
25.6% |
23.7% |
1.9% |
8.7% |
0.484 |
-0.044 |
| 45 |
Clayton Richard |
4.67 |
81.7% |
81.4% |
0.3% |
77.0% |
21.4% |
19.4% |
2.0% |
7.9% |
0.424 |
-0.008 |
| 46 |
Jakob Junis |
3.62 |
81.5% |
79.3% |
2.2% |
79.5% |
21.4% |
22.8% |
-1.4% |
5.8% |
0.443 |
-0.034 |
| 47 |
Miles Mikolas |
2.49 |
81.3% |
81.1% |
0.2% |
76.4% |
18.5% |
18.5% |
0.0% |
2.8% |
0.425 |
-0.073 |
| 48 |
Dallas Keuchel |
4.13 |
81.3% |
82.8% |
-1.5% |
73.9% |
19.1% |
18.6% |
0.4% |
6.5% |
0.409 |
0.014 |
| 49 |
Michael Fulmer |
4.73 |
80.8% |
81.6% |
-0.8% |
81.5% |
22.1% |
19.4% |
2.7% |
9.5% |
0.466 |
-0.048 |
| 50 |
Kyle Freeland |
3.48 |
80.8% |
82.0% |
-1.2% |
73.0% |
19.3% |
20.7% |
-1.4% |
7.4% |
0.410 |
-0.013 |
| 51 |
Jake Arrieta |
2.66 |
80.5% |
80.1% |
0.4% |
64.7% |
14.7% |
17.2% |
-2.5% |
7.4% |
0.358 |
-0.030 |
| 52 |
Luke Weaver |
4.41 |
79.7% |
82.1% |
-2.4% |
73.3% |
20.3% |
21.5% |
-1.2% |
7.6% |
0.426 |
-0.052 |
| 53 |
Michael Wacha |
2.41 |
79.3% |
76.9% |
2.4% |
74.5% |
22.1% |
21.3% |
0.8% |
9.4% |
0.439 |
-0.162 |
| 54 |
Jhoulys Chacin |
3.39 |
79.1% |
78.1% |
1.0% |
70.7% |
19.4% |
17.2% |
2.2% |
10.0% |
0.417 |
-0.067 |
| 55 |
Jose Urena |
4.60 |
78.6% |
77.7% |
0.9% |
74.5% |
19.2% |
19.6% |
-0.4% |
5.8% |
0.448 |
-0.039 |
| 56 |
Jake Odorizzi |
4.14 |
78.6% |
79.5% |
-0.9% |
82.0% |
23.7% |
22.6% |
1.1% |
9.6% |
0.498 |
-0.002 |
| 57 |
James Shields |
4.40 |
78.5% |
77.3% |
1.2% |
75.7% |
21.4% |
16.3% |
5.1% |
9.3% |
0.458 |
-0.108 |
| 58 |
Chad Bettis |
4.02 |
78.4% |
78.4% |
0.0% |
74.1% |
20.2% |
16.0% |
4.2% |
7.5% |
0.448 |
-0.034 |
| 59 |
Kyle Hendricks |
3.59 |
78.4% |
76.8% |
1.6% |
76.8% |
20.6% |
19.3% |
1.3% |
5.7% |
0.467 |
-0.047 |
| 60 |
Jon Lester |
2.44 |
78.1% |
76.4% |
1.7% |
76.3% |
21.8% |
21.2% |
0.6% |
8.7% |
0.467 |
-0.106 |
| 61 |
David Price |
4.08 |
78.0% |
77.8% |
0.2% |
71.3% |
19.1% |
23.3% |
-4.3% |
9.5% |
0.435 |
-0.052 |
| 62 |
Zack Godley |
5.12 |
78.0% |
79.5% |
-1.5% |
79.8% |
23.8% |
21.0% |
2.8% |
11.2% |
0.492 |
-0.051 |
| 63 |
Julio Teheran |
4.31 |
77.7% |
84.3% |
-6.6% |
77.2% |
21.8% |
18.9% |
2.9% |
11.1% |
0.478 |
-0.022 |
| 64 |
Jose Quintana |
4.30 |
77.7% |
76.8% |
0.9% |
68.2% |
18.2% |
22.4% |
-4.2% |
11.4% |
0.419 |
0.007 |
| 65 |
Marco Gonzales |
3.38 |
77.6% |
76.7% |
0.9% |
71.6% |
17.2% |
21.4% |
-4.2% |
6.2% |
0.443 |
-0.047 |
| 66 |
Aaron Sanchez |
4.48 |
77.4% |
75.9% |
1.5% |
77.1% |
22.3% |
17.8% |
4.5% |
12.8% |
0.482 |
-0.081 |
| 67 |
Reynaldo Lopez |
3.42 |
76.7% |
75.6% |
1.1% |
68.9% |
19.4% |
16.3% |
3.1% |
10.5% |
0.436 |
-0.075 |
| 68 |
Tyler Mahle |
4.38 |
75.6% |
75.7% |
-0.1% |
74.1% |
20.9% |
22.3% |
-1.4% |
8.8% |
0.486 |
-0.008 |
| 69 |
Sean Manaea |
3.59 |
74.1% |
76.6% |
-2.5% |
76.4% |
20.3% |
17.6% |
2.7% |
5.5% |
0.521 |
-0.142 |
| 70 |
Daniel Mengden |
2.91 |
74.0% |
73.4% |
0.6% |
71.4% |
17.7% |
16.2% |
1.5% |
2.7% |
0.489 |
-0.129 |
| 71 |
Trevor Williams |
3.84 |
73.5% |
72.6% |
0.9% |
64.9% |
15.9% |
16.9% |
-1.1% |
7.9% |
0.453 |
-0.066 |
| 72 |
Brandon McCarthy |
4.83 |
73.1% |
72.8% |
0.3% |
62.3% |
14.1% |
18.8% |
-4.8% |
6.9% |
0.440 |
0.024 |
| 73 |
Marco Estrada |
5.29 |
72.7% |
71.2% |
1.5% |
74.2% |
19.8% |
17.3% |
2.5% |
6.1% |
0.526 |
0.017 |
| 74 |
Felix Hernandez |
5.33 |
72.6% |
70.5% |
2.1% |
67.0% |
16.7% |
19.1% |
-2.5% |
8.9% |
0.479 |
-0.053 |
| 75 |
Derek Holland |
4.91 |
71.1% |
[Unranked] |
[Unranked] |
66.7% |
18.0% |
20.0% |
-2.0% |
9.4% |
0.497 |
-0.042 |
| 76 |
Ivan Nova |
4.96 |
71.0% |
71.0% |
0.0% |
73.7% |
19.2% |
17.6% |
1.6% |
3.8% |
0.545 |
-0.059 |
| 77 |
Jason Hammel |
5.17 |
70.8% |
72.6% |
-1.8% |
74.4% |
19.0% |
14.7% |
4.3% |
6.4% |
0.552 |
-0.101 |
| 78 |
Chris Stratton |
4.50 |
70.1% |
69.1% |
1.0% |
66.2% |
17.9% |
20.2% |
-2.3% |
10.3% |
0.507 |
-0.074 |
| 79 |
Chad Kuhl |
3.86 |
69.6% |
69.6% |
0.0% |
69.1% |
20.3% |
22.0% |
-1.7% |
8.7% |
0.532 |
-0.080 |
| 80 |
Danny Duffy |
5.81 |
68.9% |
69.3% |
-0.4% |
71.9% |
19.3% |
17.1% |
2.2% |
10.8% |
0.560 |
-0.049 |
| 81 |
Lucas Giolito |
7.08 |
68.5% |
68.5% |
0.0% |
61.8% |
17.5% |
11.0% |
6.5% |
13.8% |
0.499 |
-0.044 |
| 82 |
Mike Leake |
4.71 |
68.2% |
67.3% |
0.9% |
70.5% |
16.1% |
15.4% |
0.7% |
5.3% |
0.560 |
-0.092 |
| 83 |
Andrew Cashner |
5.02 |
67.6% |
65.8% |
1.8% |
66.0% |
16.8% |
19.3% |
-2.5% |
10.6% |
0.539 |
-0.015 |
| 84 |
Homer Bailey |
6.68 |
62.1% |
62.1% |
0.0% |
64.2% |
15.8% |
13.0% |
2.8% |
8.2% |
0.600 |
-0.036 |
|
TABLE B – NON-QUALIFIED STARTERS (minimum 10 IP)
| Name |
IP |
ERA |
Pitcher Score |
PD Score |
Predicted K% |
Actual K% |
K% Difference |
xSLG |
SLG-xSLG |
| Mike Montgomery |
11.2 |
0.8 |
99.7% |
94.4% |
24.8% |
22.0% |
2.8% |
0.300 |
-0.125 |
| Shohei Ohtani |
49.1 |
3.1 |
97.3% |
99.1% |
34.0% |
30.5% |
3.5% |
0.363 |
-0.044 |
| Ross Stripling |
38.0 |
1.9 |
96.0% |
83.5% |
22.9% |
32.2% |
-9.3% |
0.277 |
0.065 |
| Kenta Maeda |
51.1 |
3.7 |
95.0% |
94.9% |
28.7% |
30.3% |
-1.7% |
0.366 |
0.037 |
| Domingo German |
27.0 |
6.3 |
90.8% |
92.3% |
28.3% |
22.4% |
5.9% |
0.405 |
-0.015 |
| Johnny Cueto |
32.0 |
0.8 |
89.8% |
76.2% |
22.3% |
22.2% |
0.0% |
0.311 |
-0.105 |
| Eduardo Rodriguez |
66.0 |
3.7 |
89.8% |
84.7% |
24.4% |
27.6% |
-3.3% |
0.368 |
-0.009 |
| Trevor Cahill |
48.2 |
2.8 |
89.2% |
92.2% |
28.5% |
25.0% |
3.5% |
0.425 |
-0.072 |
| John Gant |
15.0 |
6.0 |
89.2% |
90.3% |
26.8% |
29.2% |
-2.4% |
0.413 |
-0.057 |
| Carlos Martinez |
54.0 |
1.8 |
88.9% |
72.8% |
19.5% |
22.8% |
-3.3% |
0.300 |
-0.055 |
| Robbie Ray |
27.2 |
4.9 |
88.7% |
92.1% |
30.1% |
36.3% |
-6.3% |
0.432 |
-0.013 |
| Walker Buehler |
46.0 |
2.7 |
88.4% |
72.5% |
19.7% |
27.2% |
-7.6% |
0.305 |
-0.021 |
| Andrew Heaney |
60.2 |
3.1 |
88.2% |
86.1% |
24.9% |
23.6% |
1.3% |
0.398 |
-0.057 |
| Garrett Richards |
61.0 |
3.3 |
88.0% |
83.8% |
26.1% |
26.9% |
-0.8% |
0.385 |
-0.050 |
| Joe Musgrove |
19.0 |
1.9 |
87.7% |
77.9% |
20.8% |
21.8% |
-1.0% |
0.350 |
0.025 |
| Jordan Montgomery |
27.1 |
3.6 |
87.5% |
79.9% |
21.5% |
19.8% |
1.7% |
0.366 |
-0.010 |
| Hyun-Jin Ryu |
29.2 |
2.1 |
87.1% |
79.3% |
24.8% |
31.3% |
-6.5% |
0.367 |
-0.059 |
| Nathan Eovaldi |
11.0 |
3.3 |
86.9% |
73.3% |
17.1% |
20.0% |
-3.0% |
0.330 |
-0.093 |
| Jaime Barria |
36.1 |
2.5 |
86.1% |
90.1% |
24.8% |
20.4% |
4.4% |
0.452 |
-0.111 |
| Jack Flaherty |
39.1 |
3.2 |
85.9% |
79.6% |
23.6% |
26.1% |
-2.5% |
0.385 |
-0.038 |
| CC Sabathia |
57.2 |
3.6 |
85.6% |
78.7% |
20.9% |
18.0% |
2.9% |
0.384 |
0.035 |
| Frankie Montas |
14.0 |
0.6 |
84.5% |
60.4% |
14.9% |
17.0% |
-2.2% |
0.276 |
-0.026 |
| Clayton Kershaw |
49.0 |
2.8 |
84.0% |
82.2% |
23.1% |
26.5% |
-3.5% |
0.428 |
-0.036 |
| Nick Kingham |
29.0 |
4.0 |
83.8% |
83.0% |
24.5% |
25.4% |
-0.9% |
0.436 |
-0.043 |
| Austin Bibens-Dirkx |
11.0 |
6.6 |
83.5% |
93.1% |
25.6% |
20.8% |
4.8% |
0.508 |
-0.018 |
| Fernando Romero |
36.1 |
4.0 |
83.4% |
82.6% |
25.0% |
21.5% |
3.5% |
0.439 |
-0.059 |
| Blaine Hardy |
28.1 |
3.8 |
83.2% |
71.7% |
18.2% |
15.4% |
2.8% |
0.368 |
0.001 |
| Jason Vargas |
30.1 |
7.7 |
82.8% |
84.7% |
23.5% |
18.8% |
4.7% |
0.461 |
0.070 |
| Yu Darvish |
40.0 |
5.0 |
82.7% |
78.2% |
24.1% |
27.2% |
-3.2% |
0.418 |
0.007 |
| Dylan Covey |
22.1 |
2.8 |
82.7% |
67.3% |
17.7% |
21.2% |
-3.5% |
0.346 |
-0.065 |
| Anibal Sanchez |
22.0 |
2.5 |
81.7% |
76.2% |
18.2% |
21.4% |
-3.3% |
0.418 |
-0.005 |
| Michael Soroka |
14.2 |
3.7 |
81.6% |
87.8% |
25.4% |
21.7% |
3.7% |
0.498 |
-0.054 |
| Wade LeBlanc |
35.1 |
2.3 |
81.5% |
77.1% |
18.0% |
18.2% |
-0.2% |
0.427 |
-0.102 |
| Nick Tropeano |
49.2 |
4.4 |
81.4% |
85.0% |
26.0% |
20.5% |
5.5% |
0.481 |
-0.019 |
| Jordan Lyles |
34.0 |
5.3 |
81.2% |
76.2% |
19.7% |
21.8% |
-2.1% |
0.425 |
0.064 |
| Zack Wheeler |
63.0 |
4.6 |
80.9% |
76.7% |
20.6% |
22.4% |
-1.8% |
0.432 |
-0.028 |
| Sam Gaviglio |
24.1 |
2.6 |
80.2% |
84.3% |
21.8% |
20.8% |
0.9% |
0.492 |
-0.007 |
| Jeremy Hellickson |
43.1 |
2.3 |
80.0% |
77.3% |
20.5% |
20.7% |
-0.3% |
0.448 |
-0.087 |
| Joey Lucchesi |
47.1 |
3.2 |
80.0% |
78.4% |
23.6% |
24.9% |
-1.4% |
0.456 |
-0.033 |
| Hector Velazquez |
10.2 |
2.5 |
80.0% |
91.4% |
23.4% |
22.7% |
0.6% |
0.543 |
-0.091 |
| Ryan Yarbrough |
14.2 |
4.9 |
79.0% |
60.9% |
15.1% |
20.3% |
-5.3% |
0.352 |
0.041 |
| Lance Lynn |
56.0 |
5.5 |
78.7% |
73.5% |
20.2% |
21.3% |
-1.2% |
0.441 |
-0.012 |
| Junior Guerra |
60.1 |
2.8 |
78.6% |
73.5% |
20.8% |
22.7% |
-2.0% |
0.442 |
-0.093 |
| Sonny Gray |
63.2 |
4.8 |
78.5% |
72.6% |
21.3% |
20.4% |
0.9% |
0.437 |
-0.008 |
| Yonny Chirinos |
22.2 |
4.4 |
78.3% |
75.9% |
20.1% |
21.0% |
-0.9% |
0.462 |
-0.043 |
| David Hess |
23.1 |
3.5 |
78.0% |
75.7% |
18.4% |
12.6% |
5.8% |
0.465 |
0.007 |
| Wei-Yin Chen |
35.1 |
5.9 |
77.6% |
67.5% |
17.1% |
16.3% |
0.8% |
0.416 |
0.122 |
| Brent Suter |
56.2 |
4.8 |
77.4% |
77.2% |
20.1% |
19.7% |
0.4% |
0.483 |
-0.014 |
| Clay Buchholz |
24.0 |
1.9 |
77.2% |
77.5% |
20.6% |
22.8% |
-2.2% |
0.487 |
-0.195 |
| Jordan Zimmermann |
31.1 |
4.9 |
76.3% |
78.0% |
20.6% |
23.7% |
-3.2% |
0.503 |
-0.047 |
| Steven Matz |
52.2 |
3.4 |
76.0% |
62.3% |
18.3% |
21.7% |
-3.4% |
0.402 |
-0.001 |
| Jaime Garcia |
47.1 |
6.1 |
76.0% |
72.2% |
20.2% |
20.5% |
-0.4% |
0.468 |
0.061 |
| Matt Moore |
52.0 |
7.6 |
75.7% |
76.6% |
20.7% |
15.7% |
5.0% |
0.501 |
0.040 |
| Trevor Richards |
23.2 |
4.9 |
75.7% |
70.9% |
19.7% |
22.4% |
-2.7% |
0.463 |
-0.019 |
| Francisco Liriano |
57.2 |
3.9 |
75.7% |
80.7% |
24.3% |
19.2% |
5.1% |
0.529 |
-0.156 |
| Zach Eflin |
33.2 |
3.7 |
75.5% |
69.8% |
20.3% |
21.5% |
-1.3% |
0.459 |
-0.032 |
| Tyler Chatwood |
53.2 |
4.0 |
75.3% |
62.4% |
17.6% |
19.2% |
-1.6% |
0.412 |
-0.080 |
| Chase Anderson |
65.0 |
4.6 |
74.8% |
68.5% |
18.2% |
15.9% |
2.3% |
0.459 |
-0.018 |
| Luis Perdomo |
14.0 |
8.4 |
74.4% |
68.5% |
21.2% |
22.1% |
-0.9% |
0.465 |
0.058 |
| Andrew Triggs |
41.1 |
5.2 |
73.0% |
75.9% |
21.4% |
23.6% |
-2.3% |
0.533 |
-0.120 |
| Adam Wainwright |
18.0 |
4.0 |
72.9% |
55.9% |
14.0% |
17.1% |
-3.1% |
0.400 |
0.035 |
| Mike Fiers |
60.1 |
4.3 |
72.6% |
71.7% |
18.3% |
16.1% |
2.2% |
0.510 |
-0.004 |
| Zach Davies |
43.0 |
5.2 |
72.3% |
69.1% |
18.7% |
16.3% |
2.4% |
0.497 |
-0.003 |
| Drew Pomeranz |
37.0 |
6.8 |
72.1% |
65.2% |
16.7% |
20.8% |
-4.2% |
0.473 |
0.070 |
| Mike Minor |
59.1 |
5.8 |
71.7% |
77.9% |
21.4% |
20.1% |
1.3% |
0.563 |
-0.020 |
| Marcus Stroman |
37.1 |
7.7 |
71.2% |
72.9% |
21.2% |
18.2% |
3.0% |
0.537 |
-0.082 |
| Ty Blach |
60.2 |
4.9 |
70.9% |
60.7% |
14.7% |
11.1% |
3.6% |
0.460 |
-0.047 |
| Matt Harvey |
45.1 |
5.2 |
70.4% |
63.7% |
16.2% |
18.2% |
-2.0% |
0.486 |
0.006 |
| Jake Faria |
47.2 |
5.5 |
70.4% |
68.1% |
19.0% |
18.2% |
0.7% |
0.516 |
-0.093 |
| Dillon Peters |
24.2 |
5.8 |
70.0% |
62.0% |
16.3% |
14.4% |
1.9% |
0.480 |
-0.011 |
| Jeff Samardzija |
35.2 |
6.6 |
69.9% |
68.8% |
17.7% |
15.7% |
2.0% |
0.527 |
-0.084 |
| Andrew Suarez |
43.2 |
4.7 |
69.9% |
66.2% |
15.8% |
23.5% |
-7.8% |
0.510 |
-0.040 |
| Elieser Hernandez |
18.0 |
4.5 |
69.2% |
70.2% |
21.0% |
12.5% |
8.5% |
0.546 |
0.042 |
| Eric Skoglund |
49.2 |
6.7 |
69.1% |
70.3% |
17.3% |
18.0% |
-0.7% |
0.548 |
-0.018 |
| Adam Plutko |
18.1 |
3.9 |
68.9% |
70.6% |
16.9% |
16.7% |
0.2% |
0.552 |
-0.014 |
| Brandon Woodruff |
11.2 |
8.5 |
68.7% |
68.9% |
21.2% |
17.5% |
3.7% |
0.543 |
-0.064 |
| Matt Wisler |
17.1 |
3.6 |
68.7% |
73.6% |
20.7% |
18.6% |
2.1% |
0.575 |
-0.160 |
| Brandon Finnegan |
20.2 |
7.4 |
68.0% |
63.0% |
16.0% |
13.6% |
2.4% |
0.513 |
0.040 |
| Dan Straily |
36.0 |
3.5 |
67.6% |
72.5% |
20.2% |
17.3% |
2.9% |
0.582 |
-0.177 |
| Ben Lively |
23.2 |
6.9 |
67.2% |
62.8% |
17.9% |
19.1% |
-1.3% |
0.522 |
0.023 |
| Kendall Graveman |
34.1 |
7.6 |
67.0% |
67.6% |
17.1% |
17.1% |
0.0% |
0.557 |
-0.015 |
| Doug Fister |
61.0 |
4.1 |
67.0% |
56.8% |
12.1% |
14.2% |
-2.2% |
0.486 |
-0.035 |
| Ian Kennedy |
65.2 |
5.8 |
67.0% |
70.5% |
17.1% |
20.5% |
-3.4% |
0.577 |
-0.051 |
| Alex Cobb |
52.1 |
6.2 |
66.2% |
58.5% |
13.6% |
13.5% |
0.1% |
0.507 |
0.063 |
| Eric Lauer |
34.1 |
6.8 |
65.9% |
55.2% |
13.6% |
19.1% |
-5.5% |
0.489 |
0.076 |
| Sal Romano |
65.0 |
6.2 |
65.9% |
57.6% |
13.5% |
16.2% |
-2.7% |
0.506 |
-0.010 |
| Daniel Gossett |
24.1 |
5.2 |
64.9% |
66.2% |
15.5% |
11.8% |
3.7% |
0.576 |
-0.081 |
| Brett Anderson |
15.1 |
7.6 |
64.9% |
67.1% |
18.0% |
11.1% |
6.9% |
0.582 |
0.009 |
| Joe Biagini |
18.2 |
7.7 |
64.9% |
65.9% |
16.7% |
14.4% |
2.3% |
0.574 |
-0.080 |
| Steven Brault |
26.0 |
5.5 |
63.8% |
69.2% |
20.0% |
13.4% |
6.6% |
0.611 |
-0.213 |
| Taijuan Walker |
13.0 |
3.5 |
62.7% |
57.6% |
15.1% |
16.1% |
-1.1% |
0.548 |
-0.156 |
| Bartolo Colon |
66.1 |
4.3 |
62.4% |
58.8% |
11.7% |
14.3% |
-2.6% |
0.560 |
-0.068 |
| Jarlin Garcia |
33.0 |
3.6 |
61.0% |
65.1% |
18.0% |
16.7% |
1.3% |
0.620 |
-0.222 |
| Matt Koch |
53.0 |
3.9 |
59.9% |
62.6% |
14.6% |
12.9% |
1.7% |
0.619 |
-0.149 |
| Hector Santiago |
32.1 |
6.1 |
59.8% |
62.0% |
16.5% |
15.9% |
0.6% |
0.616 |
-0.037 |
| Bryan Mitchell |
32.0 |
6.5 |
59.3% |
47.1% |
11.8% |
10.4% |
1.4% |
0.523 |
-0.027 |
| Rich Hill |
24.2 |
6.2 |
58.1% |
59.4% |
16.3% |
21.7% |
-5.5% |
0.621 |
-0.055 |
| Ryan Carpenter |
12.0 |
6.8 |
57.4% |
58.5% |
14.9% |
10.7% |
4.2% |
0.624 |
-0.047 |
| Miguel Gonzalez |
12.1 |
12.4 |
56.8% |
66.3% |
15.5% |
7.6% |
7.9% |
0.684 |
0.099 |
| Josh Tomlin |
30.0 |
8.1 |
55.9% |
73.8% |
19.1% |
12.9% |
6.2% |
0.746 |
-0.019 |
| Carson Fulmer |
31.0 |
8.1 |
55.3% |
56.5% |
14.6% |
16.6% |
-2.1% |
0.640 |
-0.136 |
| Martin Perez |
22.1 |
9.7 |
55.1% |
51.8% |
11.6% |
10.9% |
0.6% |
0.610 |
0.060 |
| Chris Tillman |
26.2 |
10.5 |
51.6% |
49.4% |
11.9% |
9.5% |
2.4% |
0.641 |
0.011 |
|
TABLE C – RECENT PD METRICS (Last 30 Days – Qualified Starters)
PLAYER ANALYSIS
Max Scherzer (SP, Washington Nationals)
The last two weeks, Jacob deGrom held the top spot in my rankings, but he’s now been usurped again by Mad Max. No offense to Kershaw or anyone else, but Scherzer is seriously making the case for himself as the best pitcher in baseball, and he’s doing it the most reliable way – by straight up missing bats. His Contact% and Swinging Strike rate are both tops among qualified starters, and it’s not even particularly close. He’s simply been unhittable this year, even moreso than previous years. His Swinging Strike rate of 18% is the best of his career, by far. So yes, that 40% K rate is actually very believable.
Looking at his individual pitch data, I wasn’t really expecting to find much to talk about, but to my surprise, Scherzer has a bad pitch! Here is the breakdown of his arsenal this year:
Pitch Type
|
Usage |
Sw-Str% |
Contact% |
wRC+ Allowed |
| Fourseam (FA) |
49.8% |
15.8% |
68.4% |
29 |
| Slider (SL) |
15.4% |
28.3% |
50.4% |
27 |
| Changeup (CH) |
15.1% |
18.7% |
63.2% |
47 |
| Cutter (FC) |
12.0% |
18.2% |
72.0% |
133 |
| Curveball (CU) |
6.9% |
7.4% |
80.0% |
262 |
|
One of them clearly stands out as being far less effective. And it’s not just a small sample outlier either – his curveball has a negative pitch value over his whole career. It’s not the biggest deal, considering he’s only throwing it seven percent of the time. But I do wonder, given how outstanding his other options are, why he feels the need to keep throwing that occasional curve. Not that it really matters when you’re on track to win the Cy Young…
Patrick Corbin (SP, Arizona D-Backs)
I apologize if you are tired of reading about Corbin, but given his continuously high rankings I feel compelled to keep discussing him. Most of you should be aware of the story about his velocity taking a worrisome downward spike towards the end of April. But with seven starts under his belt now with that reduced velocity, it seems pretty clear that he’s still very effective. His metrics from the period with reduced velocity still suggest a strikeout rate in the 25-30 percent range, which is quite good for a strong contact manager. In fact, over the past 30 days his PD score is still top 20 in MLB of qualified starters, with a B+ grade. His overall score does show small drops the past few weeks – but this is more a statement about just how good he was earlier, rather than him being bad now. Basically, he’s not the super-dominant pitcher who started the season, but he is still pretty good.
Other than velocity, the other story with Corbin has been his slider usage. Corbin’s slider is by far his best weapon, with a whiff rate near 30%, so it’s important that he throws it frequently. But it’s possible to go too far in that direction, since even a very good pitch needs other pitches to make it effective. In Corbin’s start on May 30th against the Reds, he threw the slider over 50% of the time, his highest rate this year. He struck out 10 batters in that game, but also gave up two homers and six runs. That hard contact could be an indication that hitters were sitting on the slider. In his next start, it was back down to 32% and with it he returned to his successful ways. It may be an oversimplification, but I found that interesting.
Jon Gray (SP, Colorado Rockies)
Scanning down the list by ERA, Gray easily stands out as a highly ranked pitcher with a very ugly ERA. The last time I talked about him, in early May, he seemed ready to put his early-season struggles behind him, raising his PD score from the C level up to B. Since then, he has appeared to continue struggling, by his ERA. His current mark of 5.4 is certainly not what owners were hoping for. But there are some good signs to be found in his numbers. His PD score has actually increased since then, up to B+, in the top 20, fully supporting his excellent strikeout rate. In other words, his fantastic FIP for May (2.8) is quite believable. Interestingly, his full season metric line above looks remarkably similar to Luis Severino’s, whose ERA is less than half of Gray’s.
As you may have guessed, Coors field is a big part of the problem. Gray’s home ERA this year is 6.5. But there seems to be a fair amount of bad luck affecting Gray as well. Particularly at home, his BABIP of .404 is much higher than his career average at home of .340. This seems unlikely to continue. He’s also sporting a low LOB% of just 63%. With positive values (though small) in both of my “luck indicator” columns (K% difference and SLG-xSLG), that makes him four for four in the bad luck department, so I believe this makes him a fairly solid “buy low” candidate. Coors field is likely to scare off owners, and he can probably be had cheaply with that ERA. There is one note of caution for head-to-head leagues – the Rockies are at home most of the final month of the season, including the full last week. So he may not be very helpful come playoff time.
Blake Snell (SP, Tampa Bay Rays)
Snell is the classic breakout story of 2018, turning himself into a top 10 starter at age 25, so I think he presents a great opportunity to see if the metrics could have predicted this. Spoiler alert: kinda. With the PD metrics, I typically like to check two things: whether they support the strikeout rate, and whether they are better or worse than previous years. To find a breakout, ideally you’re looking for someone whose metrics have improved, but not the overall results, and is the right age where they are likely to be improving generally. We’re looking for a confluence of two events: 1) a young pitcher likely to get better, and 2) positive corrections in the stats due to previously poor luck. When both of these things line up, that’s how breakouts happen.
Between 2016 and 2017, Snell’s PD metrics were essentially unchanged. So he wouldn’t have passed the “metrics improving” test. But on the other side, the metrics did suggest some poor luck in 2017. Despite putting up nearly identical metrics, his strikeout rate fell significantly in 2017, so he was under-performing there. So there was certainly some signs of a breakout incoming, though maybe not as clear as we would have hoped. However, given his age and prospect pedigree, it would have been logical to assume some improvements this year, and combined with poor luck in the previous year, this could have been enough for some savvy folks to see it coming.
Dylan Bundy (SP, Baltimore Orioles)
Bundy seems to have fully recovered now from his disastrous start a month ago. Since then, he’s put up a 2.5 ERA to go along with his 29% strikeout rate. Hopefully you’ve been reading my columns where I had rated him a “BUY” more than once. We are now seeing the fruits of that investment. Yes, there will continue to be some blowup games, as he is not the greatest contact manager and plays in a tough park/division. But a 30% strikeout true talent level is too good to pass up – his predicted K% is sixth best in all of MLB. His recent success has been buoyed by some good luck in terms of low BABIP and high LOB rates – but for the overall season, both numbers are very much in line with his career. So you could say this good luck recently was more of a correction to earlier bad luck, than anything else.
Like Snell, Bundy presents an interesting opportunity to see if the metrics could have predicted his breakout. And in Bundy’s case, it should have been even more obvious than Snell. Between 2016 and 2017, Bundy showed real improvements in his PD metrics, across the board of the three most important ones (Contact%, SwStr, and O-Swing%). However despite these improvements, his strikeout rate barely budged at all, indicating some poor luck in 2017. He’s also 25 years old, the same as Snell, and was previously a hot prospect as well. He’s just been in the league longer, and not fantastic, so people forgot he was a formerly elite prospect. But “bad luck in previous year + right age & prospect status” seems like a decent recipe for predicting breakouts.
Trevor Bauer (SP, Cleveland Indians)
Speaking of breakouts, Bauer has been simply amazing this year. At 27 years old and with four full MLB seasons under his belt, he’s a different story from Snell and Bundy. But he is breaking out all the same, currently rated as 12th best in MLB by my rankings. This is what his plate discipline metrics look like for his career:
| Year |
IP |
ERA |
Contact% |
SwStr% |
O-Swing% |
F-Strike% |
| 2014 |
153.0 |
4.2 |
80.0% |
9.0% |
31.5% |
56.4% |
| 2015 |
176.0 |
4.6 |
78.3% |
9.6% |
28.8% |
59.1% |
| 2016 |
190.0 |
4.3 |
79.1% |
9.0% |
26.3% |
59.9% |
| 2017 |
176.1 |
4.2 |
77.8% |
9.2% |
27.4% |
56.9% |
| 2018 |
78.0 |
2.8 |
72.1% |
12.7% |
29.9% |
62.2% |
|
So for four straight years, there weren’t really any major changes at all in his profile. But this year, seemingly out of nowhere, everything is just much better. Along with those improvements, his strikeout rate is way up, as to be expected, and this explains the majority of his success. But where did this come from?
To explain, I’d recommend reading Nick’s profile of Bauer for 2018 on his FanGraphs page. Essentially, in mid-2017 he stared cutting back on his cutter, and started throwing more sliders instead. It turns out his slider is much better pitch. His slider usage increased gradually throughout the second half of 2017, up to about 15% where it sits for 2018. In graph form, here is his slider usage vs. cutters, along with his ERA the past two years:
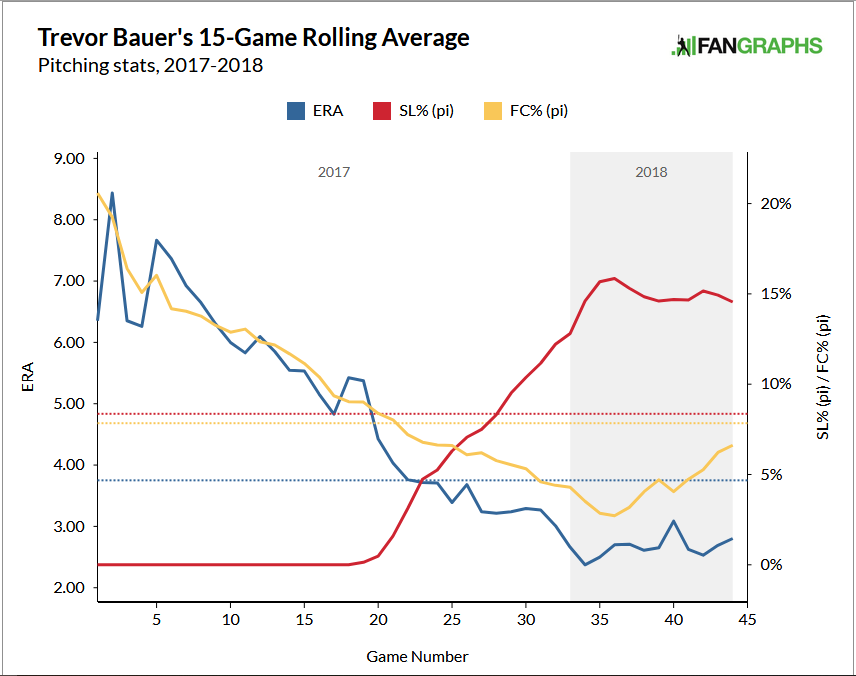
It’s interesting just how closely his ERA line follows his cutter usage. I have to say it looks like Nick really hit the nail on the head here. But because that change was gradual, and late in the season, it didn’t show up in his full season metrics. He was also fairly bad in the first half of 2017, dragging down his overall numbers. So this is a good lesson in how full season plate discipline metrics can fail to tell the complete story, and sometimes you need to dive deeper.
Ross Stripling (SP, Los Angeles Dodgers)
I’d be remiss not to mention Stripling, who is surprising a lot of people this year by transforming into the Ace of the Dodgers staff. For the past couple of my updates, he has held the distinction of holding the largest discrepancy between his predicted K% and actual results, indicating some serious good luck on the strikeout side. Last week the gap between those two numbers was over 12%. But in two starts last week, he closed the gap significantly down to 9%. And he did it in a very interesting way.
If you remember from last week, in general these gaps are getting closed more by the strikeout rates moving than the metrics moving, about 75% to 25%. But it would appear that Stripling has been going against the grain. In just those two starts, his metrics were so excellent that his predicted K% rose by five percent, up to a now respectable 23%. His gap is still the largest in MLB, but you have to be encouraged by those last few starts. I’m certainly less pessimistic on his outlook than I was a week ago. But in the end, it would probably be a mistake to assume he will continue closing his gap in this manner. Since he looks like just an average strikeout pitcher overall, and is relying much more on managing contact, which is less reliable, I would still absolutely consider selling.


Thoughts on Mike Montgomery his numbers his last 12 starts dating back to last year have been phenomenal.
I like what I see in Montgomery’s profile, though he’s a bit hard to figure out, with the constant movement back & forth between starting and the bullpen. The reason I like him is that he seems to have figured out that his changeup is his best pitch, and is now throwing it more. That’s always a good sign, and I’ll definitely be keeping an eye on him.
Now only if he would get a guaranteed a spot when Darvish gets back. Chatwood is terrible.
Hey Chaz, really good stuff here. Maybe you can help me out, Im struggling with trying to give my roster a boost and I’ve been holding out hope for Manaea and Castillo to turn it around. Thus far, they haven’t. I was toying with the idea of adding Eaton(who’ll likely be recalled this weekend) as a Soto owner, and someone that could use a little more OF production. My roster is below, would you bail on Manaea, Castillo(or another arm) to make that happen?
5×5 HTH OBP and QS 10 team league
C Gary Sanchez
1B Rizzo
2B/SS Javier Baez,
3B Manny Machado
SS Jean Segura
OF Kemp
OF Soto
OF Haniger
UTIL Travis Shaw 3B
UTIL Ozzie Albies 2B
UTIL 1B/2B/3B Carpenter
Bench OF DeSheilds
SP Luke Weaver
SP Mike Clevinger
RP Brad Boxberger
SP Carlos Carrasco
SP E-Rod
RP Kenley Jansen
RP Craig Kimbrel
SP SP Flaherty
Bench SP L.Castillo
Bench SP Sean Manaea
Bench SP Milokas
Bench SP Carlos Martinez
DL RP Britton
DL SP Yu Darvish
Are you hopeful about Tanaka? It’s been brutal for the most part this year…
I’m also wondering this. I really enjoyed the three separate tables, and the 30-day table definitely made me wonder if it’s time to buy on Tanaka before his return to form becomes a little more evident.