(Photo by George Walker/Icon Sportswire)
Welcome back to my series on plate discipline/pitching metrics. This time, I’m going to focus on a close examination of the core principle behind my work – the so-called “strikeout rate discrepancies” predicted by plate discipline metrics compared to the actual rate. At this point, roughly two months of baseball are complete, which is as good a time as any to pause and take a look back. That way we can compare the data after 1 month to current data, and see how the predictions hold up on a month-to-month basis. I’m sure there still are a lot of doubts surrounding this whole theory, and honestly I can’t blame anyone. This is fairly new stuff, and after all, I’m just some guy on the internet. Why should you believe me? So let’s put the numbers to the test.
To get things started, here are the qualified starting pitchers who currently sport a greater discrepancy than +/- five points. If you recall, 5% is the upper end of the margin for error, so under my theory any discrepancies beyond that amount should be considered red flags. This table is sorted by the K% difference, with the over-achievers on top and under-achievers on the bottom.
Right off the bat, we can easily see just how far this list has been reduced since it was first introduced towards the end of April. At that point, there were 29 pitchers with a discrepancy larger than five points. Now we are down to just eleven. Already, this goes a long way towards validating my theory that these discrepancies in small samples should mostly work themselves out as more innings are compiled. The size of the largest discrepancies are also coming down. In that first list, the largest outlier was +13.6, and there were a handful over ten percent. Now, there are no qualified SP over ten points. Gerrit Cole is posting the largest discrepancy at -9. Furthermore, of those eleven pitchers, half of them are right around the five point line. There are really only 4-5 qualified guys left in the league who are meaningfully separated from that line. So it seems very clear that at least part of my theory is holding up – the discrepancies are indeed shrinking and vanishing as more time goes by.
The fact that the discrepancies are shrinking doesn’t tell the full story though. I think we also need to look at which side of things are moving. It could be that the strikeout rates are changing to support the metrics, or vice versa. If the strikeout rates are what’s moving, that would support my theory that the metrics are the truest reflection of the underlying strikeout skills. But if it’s the opposite, that would make the PD metrics less useful. If that was true, my theory would be more like the tail wagging the dog, and not predictive in the slightest. So let’s drill down into that original set of outliers, and see how things have played out since then.
To examine this, I am going to take the “predicted K%” from a month ago, and see how it compares to changes in the actual K% from that time up to now. My goal is to measure two things:
1) Each “predicted K%” value indicated a direction that the K% should move going forward from that point in time. For example, if the predicted value was higher than the actual K% during that first update, the predicted direction would be “up”. The first thing I want to measure is just what percentage of players at least got the direction right. That should serve as a good starting point. If this is a low percentage…well, I guess it’s back to the drawing board for me.
2) It’s not just the direction that matters. If the model predicts a +10% change in strikeouts, but you just get +1%, well that’s not really validating the model. Obviously some discrepancies still remain, so I’m accepting that the changes in strikeout rates are going to fall short of the predicted changes. Extreme outliers just need more data to stabilize, that’s the nature of statistics. But the second thing I want to measure is the predominant factor involved in the “gap closure”. Basically, I want to know: was it the strikeouts that have changed to meet the predicted rates, or was it the metrics that changed to meet the strikeout rates? My assumption here is that both sets of data will move a bit, but if my theory holds up, we should clearly see the strikeout rate movement as the predominant factor.
Here are the results:
|
|
| Name |
Original Discrepancy |
Current Discrepancy |
K% Direction Predicted |
Direction Moved |
K% Actual Change |
Gap Closure from K% |
| Steven Matz |
-13.60% |
-3.60% |
Down |
Down |
-9.70% |
99.90% |
| Derek Holland |
-11.10% |
-3.30% |
Down |
Down |
-3.70% |
44.89% |
| Gerrit Cole |
-7.40% |
-9.15% |
Down |
Up |
1.40% |
N/A (no closure) |
| Mike Foltynewicz |
-7.10% |
-6.70% |
Down |
Down |
-2.60% |
58.28% |
| Marco Gonzales |
-6.90% |
-3.85% |
Down |
Down |
-6.40% |
78.49% |
| Carlos Martinez |
-6.90% |
-2.45% |
Down |
Down |
-5.40% |
97.00% |
| Jose Berrios |
-6.70% |
-0.60% |
Down |
Down |
-5.30% |
97.77% |
| Hyun-Jin Ryu |
-6.20% |
-6.50% |
Down |
Up |
0.60% |
N/A (no closure) |
| Rich Hill |
-5.90% |
-5.45% |
Down |
Down |
-2.50% |
59.79% |
| Jaime Garcia |
-5.80% |
-0.60% |
Down |
Down |
-4.20% |
94.64% |
| Rick Porcello |
-5.70% |
-2.55% |
Down |
Down |
-2.30% |
87.98% |
| Jake Arrieta |
-5.50% |
-2.75% |
Down |
Down |
-6.00% |
77.32% |
| Caleb Smith |
-5.50% |
-5.95% |
Down |
Down |
-2.80% |
42.60% |
| Jameson Taillon |
-5.50% |
-2.30% |
Down |
Down |
-2.00% |
73.53% |
| Junior Guerra |
-5.00% |
-2.10% |
Down |
Down |
-1.40% |
46.56% |
| Carlos Carrasco |
5.20% |
2.60% |
Up |
Up |
2.90% |
98.94% |
| Masahiro Tanaka |
5.30% |
5.25% |
Up |
Down |
-0.50% |
N/A (no closure) |
| Tyler Anderson |
5.30% |
3.75% |
Up |
Down |
-3.90% |
N/A (no closure) |
| CC Sabathia |
5.50% |
2.85% |
Up |
Up |
2.30% |
97.74% |
| Aaron Sanchez |
7.00% |
5.15% |
Up |
Up |
2.90% |
88.41% |
| James Shields |
7.20% |
4.45% |
Up |
Up |
5.10% |
82.49% |
| Matt Boyd |
7.80% |
2.35% |
Up |
Up |
4.10% |
90.22% |
| Lucas Giolito |
8.00% |
6.85% |
Up |
Up |
2.50% |
77.42% |
| Mike Fiers |
8.90% |
2.95% |
Up |
Up |
2.00% |
20.41% |
| Luis Castillo |
9.80% |
8.35% |
Up |
Up |
2.50% |
85.01% |
First off, just a quick note: there were 29 pitchers in the original discrepancy list but only 25 here. The explanation for that is four of those guys were injured or moved to the bullpen after that update. Only starting innings are included in the data, so essentially these four pitchers were not given any chance to close their gaps, and it doesn’t make sense to include them. For the record, those pitchers are Robbie Ray, Miguel Gonzalez, Steven Brault, and Josh Tomlin.
To quantify my earlier observation that the size of discrepancies is coming down, we can take a quick look at the averages. In the first article, the average discrepancy of all listed outliers was around seven points. Now, that’s down to just 4 points, within the margin for error. That is another data point in support of the idea that the discrepancies are being reduced over time. It also gives us some clues as to the time frame it takes for these things to stabilize. On average, the discrepancies are being reduced by almost half, over a month or so.
Moving on, let’s try to answer the two questions posed above.
Q1) Did the model predict that strikeout rates would move in the right direction?
A1) Yes, it would appear so. 21 of the 25 pitchers got the predicted direction correct, which is a solid 84% success rate. Furthermore, of the four pitchers whose predictions weren’t correct, three of them only moved a tiny amount in said wrong direction. Tyler Anderson is the sole major outlier here.
Q2) What about the amounts? Are the strikeouts changing, or have we been wasting our time reading this nonsense??
A2) Again, it does look like we pass the test here. The last column on the table shows (for pitchers who did close their gap at least partially) what portion of that closure was from the strikeout side. As you can see, most pitchers (81%) are over 50% and many are at 90+. There is again only a single major outlier, Mike Fiers and his 20%. The average contribution towards the gap closure from strikeout rates is 76%. In retrospect, this fits nicely with the statistical data from my original piece. As a reminder, here are the two graphs showing the correlations between strikeouts and the two PD metrics I use to predict them:
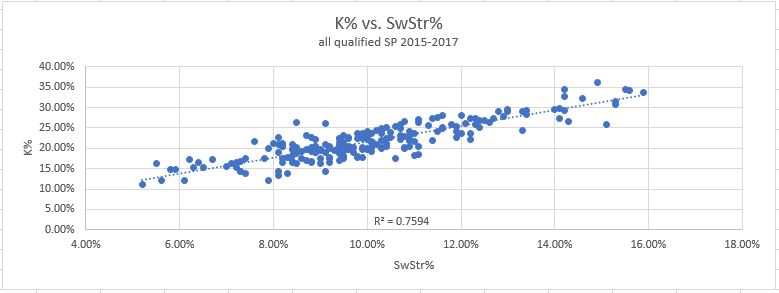
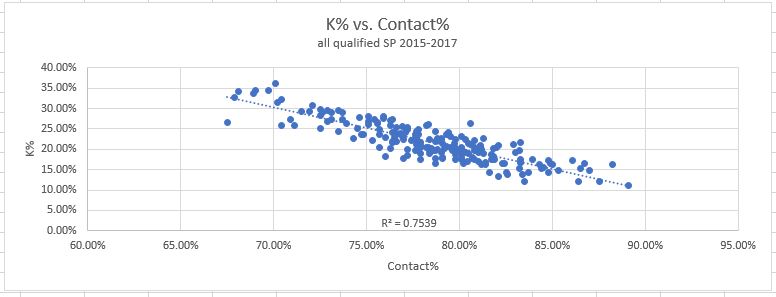
Do those R-squared values seem familiar? R-squared values are another way of saying “the data fits this model X percent of the time”, so the fact that the predictions are roughly 75% accurate should be pretty much exactly what we expected.
Overall I am certainly encouraged by these results. It’s only two months of data, but 75-84% accurate predictions (depending on measurement) seems pretty solid and also in line with what we know from my previous work. There is one VERY important caveat though, in that I am only analyzing the most extreme outliers here. This is important to understand. The metrics just aren’t going to be very useful for analyzing every pitcher, since the vast majority of them are operating within their normal expected range. But the evidence does seem to support my methodology for identifying the largest outliers, and also predict what will happen to them going forward.
So this is good. I’m happy I get to keep working on this and not throw it all out the window. But, these results don’t come without downsides. If a system is designed to catch outliers, but the outliers are disappearing, at some point the system stops being useful. Going forward, I’ll need to take this account in order to stay relevant. With that being said, and also incorporating some feedback from readers, I’m going to start by splitting out the rankings into two tables. I’ll present the qualified SP first in one table, and then present another table for the guys with less innings. Here you go:
RANKINGS
Table A – Qualified Starters
| Rank |
Name |
ERA |
Pitcher Score |
Previous Score |
Score Change |
PD Score |
Predicted K% |
Actual K% |
K% Difference |
BB% |
xSLG |
SLG – xSLG |
| 1 |
Jacob deGrom |
1.52 |
104.3% |
105.5% |
-1.1% |
99.6% |
30.6% |
32.8% |
-2.2% |
7.3% |
0.273 |
-0.013 |
| 2 |
Max Scherzer |
2.13 |
101.4% |
103.7% |
-2.3% |
105.1% |
33.7% |
38.2% |
-4.5% |
6.4% |
0.349 |
-0.016 |
| 3 |
Chris Sale |
2.76 |
100.3% |
101.8% |
-1.5% |
104.3% |
32.9% |
34.8% |
-1.9% |
6.7% |
0.358 |
-0.010 |
| 4 |
Justin Verlander |
1.11 |
99.2% |
98.9% |
0.3% |
91.9% |
27.1% |
32.3% |
-5.3% |
5.0% |
0.290 |
-0.034 |
| 5 |
Noah Syndergaard |
3.06 |
98.8% |
98.5% |
0.3% |
99.1% |
30.6% |
28.3% |
2.3% |
4.8% |
0.343 |
0.021 |
| 6 |
Patrick Corbin |
2.47 |
98.1% |
99.5% |
-1.3% |
99.8% |
30.7% |
32.7% |
-2.0% |
7.1% |
0.357 |
-0.051 |
| 7 |
Gerrit Cole |
2.05 |
96.3% |
98.7% |
-2.4% |
95.4% |
30.3% |
39.4% |
-9.2% |
6.9% |
0.352 |
-0.057 |
| 8 |
Charlie Morton |
2.26 |
94.9% |
99.2% |
-4.3% |
87.9% |
27.3% |
31.6% |
-4.3% |
8.2% |
0.321 |
0.016 |
| 9 |
Aaron Nola |
2.27 |
93.4% |
91.7% |
1.7% |
86.3% |
24.7% |
24.6% |
0.1% |
6.3% |
0.330 |
-0.046 |
| 10 |
Lance McCullers Jr. |
3.98 |
92.0% |
95.8% |
-3.8% |
91.1% |
27.3% |
26.4% |
0.9% |
9.7% |
0.380 |
-0.025 |
| 11 |
Sean Newcomb |
2.75 |
92.0% |
92.5% |
-0.5% |
78.0% |
22.6% |
26.6% |
-4.1% |
12.0% |
0.293 |
0.007 |
| 12 |
James Paxton |
3.10 |
91.1% |
89.6% |
1.5% |
91.8% |
27.7% |
32.7% |
-5.1% |
7.3% |
0.398 |
-0.071 |
| 13 |
Blake Snell |
2.56 |
91.0% |
89.2% |
1.8% |
90.1% |
27.4% |
27.3% |
0.1% |
8.3% |
0.387 |
-0.046 |
| 14 |
Masahiro Tanaka |
4.62 |
90.3% |
90.1% |
0.3% |
95.9% |
28.1% |
22.8% |
5.3% |
6.7% |
0.435 |
-0.017 |
| 15 |
Trevor Bauer |
2.61 |
89.8% |
90.3% |
-0.5% |
89.5% |
26.7% |
28.6% |
-2.0% |
8.3% |
0.399 |
-0.084 |
| 16 |
Kyle Gibson |
3.57 |
89.6% |
88.5% |
1.1% |
88.0% |
26.6% |
24.8% |
1.8% |
10.5% |
0.392 |
-0.044 |
| 17 |
Carlos Carrasco |
3.98 |
89.1% |
89.6% |
-0.5% |
93.2% |
27.0% |
24.4% |
2.6% |
5.5% |
0.434 |
-0.044 |
| 18 |
Jose Berrios |
3.67 |
89.1% |
87.8% |
1.3% |
87.4% |
24.1% |
24.7% |
-0.6% |
4.8% |
0.395 |
-0.041 |
| 19 |
Jon Gray |
5.40 |
88.8% |
89.0% |
-0.1% |
86.9% |
26.6% |
26.3% |
0.3% |
5.9% |
0.395 |
0.055 |
| 20 |
Luis Castillo |
5.49 |
88.4% |
89.2% |
-0.8% |
97.5% |
30.9% |
22.5% |
8.4% |
9.2% |
0.471 |
0.004 |
| 21 |
Vince Velasquez |
4.08 |
88.2% |
87.1% |
1.2% |
79.4% |
24.2% |
28.5% |
-4.3% |
8.5% |
0.353 |
0.081 |
| 22 |
Luis Severino |
2.28 |
87.8% |
89.5% |
-1.7% |
87.2% |
25.5% |
29.2% |
-3.8% |
7.2% |
0.410 |
-0.115 |
| 23 |
Alex Wood |
3.75 |
87.8% |
89.5% |
-1.7% |
86.5% |
23.2% |
23.1% |
0.1% |
4.0% |
0.406 |
-0.030 |
| 24 |
Caleb Smith |
3.51 |
87.6% |
89.0% |
-1.4% |
83.1% |
24.0% |
29.9% |
-6.0% |
11.3% |
0.386 |
-0.066 |
| 25 |
Dylan Bundy |
4.46 |
86.8% |
85.6% |
1.2% |
100.1% |
29.9% |
28.3% |
1.6% |
6.8% |
0.510 |
-0.016 |
| 26 |
Tyler Anderson |
4.72 |
86.5% |
89.3% |
-2.8% |
83.8% |
24.7% |
20.9% |
3.8% |
9.4% |
0.405 |
0.069 |
| 27 |
Mike Clevinger |
3.14 |
86.5% |
86.5% |
0.0% |
83.2% |
23.5% |
21.5% |
2.0% |
8.1% |
0.401 |
-0.039 |
| 28 |
J.A. Happ |
3.84 |
86.4% |
85.8% |
0.6% |
83.5% |
24.7% |
29.5% |
-4.9% |
6.7% |
0.405 |
-0.042 |
| 29 |
Matt Boyd |
3.00 |
86.3% |
86.4% |
-0.1% |
76.5% |
22.0% |
19.6% |
2.4% |
8.7% |
0.360 |
-0.071 |
| 30 |
Zack Greinke |
3.65 |
86.2% |
87.0% |
-0.7% |
91.9% |
26.7% |
27.1% |
-0.5% |
3.8% |
0.463 |
-0.038 |
| 31 |
Gio Gonzalez |
2.10 |
86.0% |
86.7% |
-0.8% |
75.7% |
21.5% |
23.2% |
-1.7% |
10.3% |
0.358 |
-0.022 |
| 32 |
Corey Kluber |
2.17 |
85.6% |
84.4% |
1.2% |
83.7% |
23.1% |
26.1% |
-3.1% |
3.3% |
0.417 |
-0.077 |
| 33 |
Rick Porcello |
3.65 |
85.4% |
86.2% |
-0.8% |
77.4% |
20.2% |
22.7% |
-2.6% |
4.9% |
0.377 |
-0.017 |
| 34 |
Tyson Ross |
3.29 |
85.2% |
84.2% |
1.0% |
80.2% |
22.4% |
24.9% |
-2.5% |
8.8% |
0.399 |
-0.068 |
| 35 |
Tyler Skaggs |
3.60 |
85.1% |
85.8% |
-0.7% |
82.8% |
24.3% |
25.1% |
-0.8% |
7.5% |
0.417 |
-0.026 |
| 36 |
Jameson Taillon |
4.53 |
84.8% |
83.7% |
1.2% |
77.4% |
19.8% |
22.1% |
-2.3% |
7.0% |
0.385 |
0.008 |
| 37 |
Julio Teheran |
4.20 |
84.3% |
85.9% |
-1.6% |
83.0% |
23.9% |
20.6% |
3.3% |
10.9% |
0.429 |
0.009 |
| 38 |
Kevin Gausman |
4.31 |
84.1% |
86.3% |
-2.3% |
87.6% |
25.7% |
21.0% |
4.7% |
6.1% |
0.463 |
-0.009 |
| 39 |
Nick Pivetta |
3.26 |
83.6% |
83.0% |
0.6% |
83.0% |
23.8% |
28.8% |
-5.0% |
6.0% |
0.438 |
-0.095 |
| 40 |
Chris Archer |
4.29 |
83.4% |
81.4% |
2.0% |
89.1% |
27.3% |
23.5% |
3.8% |
8.1% |
0.482 |
-0.061 |
| 41 |
Tanner Roark |
3.17 |
82.9% |
81.3% |
1.6% |
77.6% |
21.1% |
22.5% |
-1.4% |
7.4% |
0.412 |
-0.076 |
| 42 |
Dallas Keuchel |
3.39 |
82.8% |
82.8% |
0.0% |
74.0% |
19.0% |
18.6% |
0.3% |
6.3% |
0.389 |
0.020 |
| 43 |
Stephen Strasburg |
3.13 |
82.8% |
83.4% |
-0.5% |
83.7% |
24.2% |
28.6% |
-4.4% |
6.6% |
0.454 |
-0.075 |
| 44 |
Luke Weaver |
4.63 |
82.1% |
83.0% |
-0.9% |
75.9% |
21.7% |
21.5% |
0.2% |
8.1% |
0.411 |
-0.038 |
| 45 |
Kyle Freeland |
3.43 |
82.0% |
84.6% |
-2.5% |
74.5% |
19.9% |
20.4% |
-0.6% |
7.8% |
0.403 |
-0.010 |
| 46 |
Cole Hamels |
3.74 |
82.0% |
84.0% |
-1.9% |
85.5% |
24.7% |
23.2% |
1.5% |
9.2% |
0.476 |
-0.045 |
| 47 |
Michael Fulmer |
4.60 |
81.6% |
84.9% |
-3.3% |
83.5% |
22.8% |
20.1% |
2.7% |
9.3% |
0.469 |
-0.047 |
| 48 |
Clayton Richard |
4.97 |
81.4% |
82.7% |
-1.3% |
77.3% |
21.6% |
19.8% |
1.8% |
8.5% |
0.430 |
0.008 |
| 49 |
Mike Foltynewicz |
2.55 |
81.4% |
81.4% |
-0.1% |
70.0% |
20.4% |
27.1% |
-6.7% |
11.4% |
0.382 |
-0.026 |
| 50 |
Miles Mikolas |
2.58 |
81.1% |
80.3% |
0.8% |
76.2% |
18.5% |
19.5% |
-1.1% |
2.7% |
0.427 |
-0.087 |
| 51 |
German Marquez |
4.21 |
80.6% |
80.0% |
0.7% |
69.9% |
19.5% |
21.0% |
-1.5% |
9.3% |
0.391 |
0.022 |
| 52 |
Jake Arrieta |
2.16 |
80.1% |
79.0% |
1.1% |
64.3% |
14.5% |
17.2% |
-2.8% |
8.2% |
0.360 |
-0.049 |
| 53 |
Zack Godley |
4.38 |
79.5% |
82.3% |
-2.8% |
80.8% |
24.3% |
21.4% |
2.9% |
11.2% |
0.478 |
-0.060 |
| 54 |
Jake Odorizzi |
3.34 |
79.5% |
80.6% |
-1.1% |
83.1% |
24.0% |
23.5% |
0.5% |
9.7% |
0.494 |
-0.035 |
| 55 |
Jakob Junis |
3.61 |
79.3% |
76.6% |
2.7% |
78.1% |
20.6% |
22.1% |
-1.6% |
6.1% |
0.464 |
-0.038 |
| 56 |
Chad Bettis |
3.68 |
78.4% |
77.3% |
1.1% |
73.5% |
19.9% |
15.2% |
4.7% |
8.2% |
0.445 |
-0.047 |
| 57 |
Jhoulys Chacin |
3.69 |
78.1% |
77.9% |
0.2% |
69.9% |
19.3% |
16.7% |
2.6% |
10.4% |
0.425 |
-0.057 |
| 58 |
Lance Lynn |
5.94 |
78.1% |
78.9% |
-0.8% |
74.4% |
20.5% |
21.5% |
-1.0% |
14.2% |
0.455 |
0.005 |
| 59 |
David Price |
4.04 |
77.8% |
77.2% |
0.6% |
71.8% |
18.9% |
22.8% |
-3.9% |
10.0% |
0.441 |
-0.063 |
| 60 |
Jose Urena |
4.69 |
77.7% |
78.9% |
-1.2% |
72.3% |
18.4% |
19.6% |
-1.2% |
5.7% |
0.446 |
-0.036 |
| 61 |
James Shields |
4.46 |
77.3% |
77.6% |
-0.3% |
72.7% |
20.3% |
15.8% |
4.5% |
9.8% |
0.454 |
-0.138 |
| 62 |
Michael Wacha |
2.71 |
76.9% |
76.8% |
0.1% |
72.9% |
21.7% |
20.4% |
1.3% |
9.6% |
0.461 |
-0.158 |
| 63 |
Jose Quintana |
4.78 |
76.8% |
74.9% |
1.9% |
68.8% |
18.8% |
21.9% |
-3.1% |
11.6% |
0.435 |
0.013 |
| 64 |
Kyle Hendricks |
3.16 |
76.8% |
75.3% |
1.5% |
75.3% |
20.3% |
20.3% |
-0.1% |
5.2% |
0.478 |
-0.075 |
| 65 |
Marco Gonzales |
3.60 |
76.7% |
73.0% |
3.6% |
71.6% |
17.4% |
21.2% |
-3.9% |
6.0% |
0.455 |
-0.046 |
| 66 |
Sean Manaea |
3.34 |
76.6% |
78.6% |
-2.0% |
78.4% |
21.0% |
18.9% |
2.1% |
4.6% |
0.502 |
-0.143 |
| 67 |
Jon Lester |
2.71 |
76.4% |
78.1% |
-1.6% |
75.8% |
21.6% |
20.7% |
0.9% |
8.4% |
0.486 |
-0.098 |
| 68 |
Aaron Sanchez |
4.77 |
75.9% |
78.7% |
-2.8% |
75.8% |
21.9% |
16.7% |
5.2% |
12.7% |
0.494 |
-0.080 |
| 69 |
Tyler Mahle |
4.76 |
75.7% |
76.1% |
-0.5% |
73.7% |
20.7% |
22.1% |
-1.4% |
8.7% |
0.482 |
0.014 |
| 70 |
Francisco Liriano |
3.90 |
75.7% |
72.0% |
3.7% |
80.7% |
24.3% |
19.2% |
5.1% |
12.4% |
0.529 |
-0.156 |
| 71 |
Reynaldo Lopez |
2.93 |
75.6% |
74.3% |
1.3% |
69.7% |
20.1% |
16.7% |
3.4% |
10.3% |
0.457 |
-0.089 |
| 72 |
Daniel Mengden |
2.85 |
73.4% |
71.7% |
1.7% |
72.8% |
18.1% |
16.2% |
1.9% |
2.3% |
0.507 |
-0.133 |
| 73 |
Brandon McCarthy |
5.02 |
72.8% |
73.5% |
-0.7% |
62.4% |
14.3% |
17.7% |
-3.5% |
7.5% |
0.445 |
0.033 |
| 74 |
Jason Hammel |
5.23 |
72.6% |
69.7% |
2.9% |
77.2% |
19.9% |
15.0% |
4.9% |
6.3% |
0.546 |
-0.099 |
| 75 |
Trevor Williams |
3.43 |
72.6% |
73.0% |
-0.4% |
65.4% |
16.0% |
17.1% |
-1.1% |
7.9% |
0.468 |
-0.089 |
| 76 |
Marco Estrada |
5.68 |
71.2% |
74.6% |
-3.5% |
72.8% |
19.1% |
16.5% |
2.6% |
6.7% |
0.536 |
0.023 |
| 77 |
Ivan Nova |
4.96 |
71.0% |
69.9% |
1.1% |
73.7% |
19.2% |
17.6% |
1.6% |
3.8% |
0.545 |
-0.059 |
| 78 |
Ty Blach |
4.90 |
70.9% |
71.7% |
-0.8% |
60.7% |
14.7% |
11.1% |
3.6% |
8.5% |
0.460 |
-0.047 |
| 79 |
Felix Hernandez |
5.83 |
70.5% |
71.7% |
-1.2% |
66.5% |
16.6% |
18.8% |
-2.3% |
9.6% |
0.503 |
-0.054 |
| 80 |
Chad Kuhl |
3.94 |
69.6% |
67.4% |
2.1% |
69.5% |
20.2% |
22.2% |
-2.0% |
8.8% |
0.536 |
-0.071 |
| 81 |
Ian Kennedy |
5.15 |
69.3% |
69.9% |
-0.6% |
71.9% |
17.5% |
20.8% |
-3.3% |
7.7% |
0.555 |
-0.061 |
| 82 |
Danny Duffy |
5.71 |
69.3% |
65.0% |
4.3% |
73.6% |
19.8% |
18.6% |
1.2% |
10.7% |
0.567 |
-0.065 |
| 83 |
Chris Stratton |
4.97 |
69.1% |
67.5% |
1.7% |
65.5% |
17.8% |
19.2% |
-1.5% |
10.8% |
0.515 |
-0.060 |
| 84 |
Lucas Giolito |
7.53 |
68.5% |
73.6% |
-5.1% |
63.4% |
18.5% |
11.6% |
6.9% |
14.3% |
0.510 |
-0.041 |
| 85 |
Mike Leake |
4.93 |
67.3% |
66.4% |
0.9% |
68.5% |
15.4% |
13.9% |
1.5% |
5.7% |
0.560 |
-0.093 |
| 86 |
Bartolo Colon |
3.70 |
66.7% |
63.8% |
2.9% |
62.2% |
12.9% |
14.7% |
-1.9% |
3.0% |
0.526 |
-0.069 |
| 87 |
Andrew Cashner |
5.07 |
65.8% |
64.5% |
1.3% |
64.6% |
16.5% |
19.7% |
-3.3% |
11.3% |
0.553 |
-0.030 |
| 88 |
Homer Bailey |
6.68 |
62.1% |
61.1% |
1.0% |
64.2% |
15.8% |
13.0% |
2.8% |
8.2% |
0.600 |
-0.036 |
|
Table B – 10 IP Minimum
| Name |
IP |
ERA |
Pitcher Score |
PD Score |
Predicted K% |
Actual K% |
K% Difference |
BB% |
xSLG |
SLG – xSLG |
| Shohei Ohtani |
40.1 |
3.35 |
96.7% |
97.6% |
33.1% |
32.3% |
0.8% |
8.7% |
0.361 |
-0.037 |
| Kenta Maeda |
51.1 |
3.68 |
95.0% |
94.9% |
28.7% |
30.3% |
-1.7% |
8.3% |
0.366 |
0.037 |
| Domingo German |
20.1 |
6.64 |
91.7% |
92.2% |
28.6% |
26.7% |
1.9% |
11.6% |
0.392 |
-0.014 |
| Trevor Cahill |
44 |
2.25 |
90.9% |
92.5% |
28.7% |
24.6% |
4.1% |
5.4% |
0.405 |
-0.089 |
| Ross Stripling |
26 |
2.42 |
90.4% |
74.6% |
18.5% |
31.1% |
-12.6% |
2.8% |
0.292 |
0.081 |
| Walker Buehler |
41 |
2.20 |
89.8% |
72.3% |
19.7% |
30.0% |
-10.4% |
5.6% |
0.285 |
-0.028 |
| Johnny Cueto |
32 |
0.84 |
89.8% |
76.2% |
22.3% |
22.2% |
0.0% |
5.1% |
0.311 |
-0.105 |
| Eduardo Rodriguez |
53.2 |
4.02 |
89.3% |
85.0% |
25.0% |
28.0% |
-3.1% |
8.2% |
0.376 |
-0.008 |
| John Gant |
15 |
6.00 |
89.2% |
90.3% |
26.8% |
29.2% |
-2.4% |
6.2% |
0.413 |
-0.057 |
| Carlos Martinez |
50 |
1.62 |
88.9% |
73.2% |
20.0% |
22.4% |
-2.5% |
10.5% |
0.302 |
-0.062 |
| Robbie Ray |
27.2 |
4.88 |
88.7% |
92.1% |
30.1% |
36.3% |
-6.3% |
13.7% |
0.432 |
-0.013 |
| Andrew Heaney |
46.2 |
3.09 |
87.7% |
85.9% |
25.7% |
26.7% |
-1.1% |
8.9% |
0.403 |
-0.038 |
| Jordan Montgomery |
27.1 |
3.62 |
87.5% |
79.9% |
21.5% |
19.8% |
1.7% |
10.3% |
0.366 |
-0.010 |
| Hyun-Jin Ryu |
29.2 |
2.12 |
87.1% |
79.3% |
24.8% |
31.3% |
-6.5% |
8.7% |
0.367 |
-0.059 |
| Fernando Romero |
28.2 |
1.88 |
86.5% |
80.1% |
24.8% |
25.0% |
-0.2% |
11.2% |
0.380 |
-0.115 |
| Jack Flaherty |
29.1 |
2.15 |
85.8% |
77.5% |
24.2% |
27.7% |
-3.5% |
8.0% |
0.373 |
-0.062 |
| Jordan Lyles |
22.2 |
3.97 |
85.7% |
82.5% |
22.9% |
25.5% |
-2.7% |
8.5% |
0.407 |
0.033 |
| Blaine Hardy |
16.1 |
2.76 |
85.4% |
75.7% |
20.1% |
18.8% |
1.3% |
2.9% |
0.366 |
0.028 |
| Nick Kingham |
24 |
3.75 |
85.4% |
82.1% |
24.6% |
26.0% |
-1.5% |
4.2% |
0.409 |
-0.002 |
| Jaime Barria |
30.1 |
2.97 |
84.8% |
88.1% |
23.5% |
19.4% |
4.1% |
6.5% |
0.457 |
-0.112 |
| Clayton Kershaw |
44 |
2.86 |
84.3% |
83.6% |
23.9% |
26.5% |
-2.7% |
5.5% |
0.433 |
-0.024 |
| Garrett Richards |
54 |
3.67 |
84.3% |
79.5% |
24.3% |
25.6% |
-1.4% |
12.0% |
0.406 |
-0.040 |
| Wade LeBlanc |
26.1 |
1.71 |
84.2% |
79.7% |
17.6% |
18.6% |
-1.0% |
3.9% |
0.408 |
-0.102 |
| CC Sabathia |
50.2 |
3.73 |
83.7% |
77.4% |
20.2% |
17.3% |
2.9% |
6.4% |
0.400 |
0.024 |
| Austin Bibens-Dirkx |
11 |
6.55 |
83.5% |
93.1% |
25.6% |
20.8% |
4.8% |
1.9% |
0.508 |
-0.018 |
| Sam Gaviglio |
11.1 |
2.38 |
83.4% |
88.8% |
22.9% |
26.1% |
-3.2% |
6.5% |
0.480 |
-0.061 |
| Anibal Sanchez |
15 |
3.60 |
83.1% |
84.4% |
21.9% |
21.9% |
-0.1% |
7.8% |
0.455 |
0.019 |
| Yu Darvish |
40 |
4.95 |
82.7% |
78.2% |
24.1% |
27.2% |
-3.2% |
11.7% |
0.418 |
0.007 |
| Michael Soroka |
14.2 |
3.68 |
81.6% |
87.8% |
25.4% |
21.7% |
3.7% |
5.8% |
0.498 |
-0.054 |
| Wei-Yin Chen |
29.1 |
5.22 |
81.1% |
71.4% |
19.0% |
15.6% |
3.4% |
10.9% |
0.395 |
0.123 |
| Zack Wheeler |
50 |
5.40 |
80.1% |
78.3% |
21.4% |
23.6% |
-2.3% |
8.4% |
0.454 |
-0.036 |
| Joey Lucchesi |
47.1 |
3.23 |
80.0% |
78.4% |
23.6% |
24.9% |
-1.4% |
7.8% |
0.456 |
-0.033 |
| Hector Velazquez |
10.2 |
2.53 |
80.0% |
91.4% |
23.4% |
22.7% |
0.6% |
4.6% |
0.543 |
-0.091 |
| Jeremy Hellickson |
43 |
2.30 |
79.9% |
77.6% |
20.6% |
21.0% |
-0.4% |
3.7% |
0.452 |
-0.086 |
| Nick Tropeano |
45 |
3.80 |
79.8% |
82.9% |
25.5% |
20.4% |
5.1% |
8.8% |
0.489 |
-0.041 |
| Zach Eflin |
22 |
3.27 |
79.1% |
70.2% |
20.8% |
26.1% |
-5.3% |
7.6% |
0.414 |
-0.033 |
| Yonny Chirinos |
22.2 |
4.37 |
78.3% |
75.9% |
20.1% |
21.0% |
-0.9% |
8.0% |
0.462 |
-0.043 |
| Ryan Yarbrough |
14.2 |
4.91 |
77.9% |
60.9% |
15.1% |
20.3% |
-5.3% |
7.8% |
0.367 |
0.026 |
| Jason Vargas |
20.1 |
10.62 |
77.3% |
86.8% |
24.9% |
20.2% |
4.7% |
9.6% |
0.548 |
0.104 |
| Sonny Gray |
49.2 |
5.98 |
77.0% |
72.0% |
20.6% |
18.6% |
2.0% |
11.9% |
0.453 |
-0.020 |
| Jaime Garcia |
45.2 |
5.52 |
76.5% |
72.3% |
20.5% |
21.1% |
-0.6% |
10.3% |
0.462 |
0.044 |
| David Hess |
17.1 |
4.15 |
76.3% |
78.3% |
19.3% |
13.9% |
5.4% |
6.9% |
0.504 |
0.003 |
| Jordan Zimmermann |
31.1 |
4.88 |
76.3% |
78.0% |
20.6% |
23.7% |
-3.2% |
6.7% |
0.503 |
-0.047 |
| Tyler Chatwood |
48.1 |
4.10 |
75.9% |
60.7% |
17.1% |
19.8% |
-2.7% |
20.3% |
0.392 |
-0.065 |
| Trevor Richards |
23.2 |
4.94 |
75.7% |
70.9% |
19.7% |
22.4% |
-2.7% |
13.1% |
0.463 |
-0.019 |
| Dylan Covey |
17.1 |
3.63 |
75.6% |
59.7% |
14.9% |
18.4% |
-3.6% |
9.2% |
0.390 |
-0.086 |
| Chase Anderson |
55 |
4.42 |
75.5% |
69.9% |
18.7% |
16.6% |
2.1% |
9.6% |
0.460 |
-0.005 |
| Brent Suter |
51.2 |
4.88 |
75.4% |
75.7% |
19.2% |
18.8% |
0.4% |
4.9% |
0.500 |
-0.014 |
| Matt Moore |
40.2 |
8.19 |
75.3% |
77.9% |
21.3% |
15.9% |
5.4% |
10.1% |
0.515 |
0.029 |
| Junior Guerra |
48.1 |
2.98 |
74.8% |
69.3% |
19.9% |
22.0% |
-2.1% |
10.0% |
0.465 |
-0.118 |
| Luis Perdomo |
14 |
8.36 |
74.4% |
68.5% |
21.2% |
22.1% |
-0.9% |
11.7% |
0.465 |
0.058 |
| Mike Minor |
54.1 |
5.63 |
73.1% |
79.5% |
22.2% |
21.2% |
0.9% |
5.1% |
0.556 |
-0.021 |
| Andrew Triggs |
41.1 |
5.23 |
73.0% |
75.9% |
21.4% |
23.6% |
-2.3% |
9.9% |
0.533 |
-0.120 |
| Adam Wainwright |
18 |
4.00 |
72.9% |
55.9% |
14.0% |
17.1% |
-3.1% |
15.9% |
0.400 |
0.035 |
| Steven Matz |
45.2 |
3.55 |
72.7% |
59.4% |
17.4% |
21.0% |
-3.6% |
10.8% |
0.427 |
-0.006 |
| Zach Davies |
43 |
5.23 |
72.3% |
69.1% |
18.7% |
16.3% |
2.4% |
9.0% |
0.497 |
-0.003 |
| Mike Fiers |
49 |
4.78 |
72.0% |
71.4% |
18.2% |
15.2% |
3.0% |
4.7% |
0.516 |
-0.003 |
| Elieser Hernandez |
15 |
2.40 |
71.8% |
70.0% |
20.4% |
14.3% |
6.1% |
1.8% |
0.510 |
-0.037 |
| Marcus Stroman |
37.1 |
7.71 |
71.2% |
72.9% |
21.2% |
18.2% |
3.0% |
10.2% |
0.537 |
-0.082 |
| Clay Buchholz |
11 |
1.64 |
71.0% |
70.7% |
18.3% |
13.2% |
5.1% |
2.6% |
0.525 |
-0.201 |
| Matt Harvey |
40.1 |
4.91 |
70.5% |
65.6% |
16.9% |
18.8% |
-2.0% |
4.6% |
0.497 |
0.009 |
| Jake Faria |
47.2 |
5.48 |
70.4% |
68.1% |
19.0% |
18.2% |
0.7% |
10.8% |
0.516 |
-0.093 |
| Derek Holland |
53.1 |
4.73 |
70.4% |
66.9% |
18.0% |
21.3% |
-3.3% |
9.8% |
0.508 |
-0.056 |
| Dillon Peters |
24.2 |
5.84 |
70.0% |
62.0% |
16.3% |
14.4% |
1.9% |
11.7% |
0.480 |
-0.011 |
| Jeff Samardzija |
35.2 |
6.56 |
69.9% |
68.8% |
17.7% |
15.7% |
2.0% |
13.9% |
0.527 |
-0.084 |
| Drew Pomeranz |
32 |
6.75 |
69.4% |
63.9% |
16.6% |
20.4% |
-3.9% |
12.5% |
0.500 |
0.045 |
| Eric Skoglund |
49.2 |
6.70 |
69.1% |
70.3% |
17.3% |
18.0% |
-0.7% |
6.5% |
0.548 |
-0.018 |
| Adam Plutko |
18.1 |
3.93 |
68.9% |
70.6% |
16.9% |
16.7% |
0.2% |
6.9% |
0.552 |
-0.014 |
| Brandon Woodruff |
11.2 |
8.49 |
68.7% |
68.9% |
21.2% |
17.5% |
3.7% |
12.3% |
0.543 |
-0.064 |
| Matt Wisler |
17.1 |
3.63 |
68.7% |
73.6% |
20.7% |
18.6% |
2.1% |
7.1% |
0.575 |
-0.160 |
| Andrew Suarez |
36.2 |
5.65 |
68.2% |
64.2% |
15.2% |
23.9% |
-8.7% |
5.2% |
0.519 |
-0.005 |
| Brandon Finnegan |
20.2 |
7.40 |
68.0% |
63.0% |
16.0% |
13.6% |
2.4% |
14.6% |
0.513 |
0.040 |
| Dan Straily |
31.2 |
3.69 |
67.6% |
73.3% |
20.2% |
16.9% |
3.3% |
12.5% |
0.587 |
-0.156 |
| Ben Lively |
23.2 |
6.85 |
67.1% |
62.8% |
17.9% |
19.1% |
-1.3% |
8.7% |
0.524 |
0.021 |
| Doug Fister |
55 |
4.09 |
67.1% |
57.2% |
12.7% |
15.0% |
-2.3% |
6.9% |
0.487 |
-0.028 |
| Kendall Graveman |
34.1 |
7.60 |
67.0% |
67.6% |
17.1% |
17.1% |
0.0% |
8.2% |
0.557 |
-0.015 |
| Sal Romano |
55 |
5.89 |
66.9% |
55.4% |
13.0% |
15.5% |
-2.6% |
11.5% |
0.477 |
0.005 |
| Eric Lauer |
29.1 |
7.67 |
66.2% |
57.0% |
14.7% |
19.1% |
-4.4% |
10.2% |
0.497 |
0.073 |
| Brett Anderson |
15.1 |
7.63 |
64.9% |
67.1% |
18.0% |
11.1% |
6.9% |
8.3% |
0.582 |
0.009 |
| Joe Biagini |
18.2 |
7.71 |
64.9% |
65.9% |
16.7% |
14.4% |
2.3% |
10.0% |
0.574 |
-0.080 |
| Steven Brault |
26 |
5.54 |
63.8% |
69.2% |
20.0% |
13.4% |
6.6% |
12.5% |
0.611 |
-0.213 |
| Taijuan Walker |
13 |
3.46 |
62.7% |
57.6% |
15.1% |
16.1% |
-1.1% |
8.9% |
0.548 |
-0.156 |
| Alex Cobb |
46.1 |
6.80 |
62.2% |
54.4% |
11.7% |
11.5% |
0.2% |
5.5% |
0.534 |
0.075 |
| Daniel Gossett |
19.1 |
6.05 |
61.7% |
64.6% |
16.0% |
13.1% |
2.9% |
7.1% |
0.608 |
-0.089 |
| Hector Santiago |
24 |
6.38 |
61.4% |
67.1% |
19.2% |
19.3% |
-0.2% |
13.8% |
0.628 |
-0.058 |
| Jarlin Garcia |
33 |
3.55 |
61.0% |
65.1% |
18.0% |
16.7% |
1.3% |
9.9% |
0.620 |
-0.222 |
| Bryan Mitchell |
32 |
6.47 |
59.3% |
47.1% |
11.8% |
10.4% |
1.4% |
16.9% |
0.523 |
-0.027 |
| Rich Hill |
24.2 |
6.20 |
58.1% |
59.4% |
16.3% |
21.7% |
-5.5% |
11.3% |
0.621 |
-0.055 |
| Miguel Gonzalez |
12.1 |
12.41 |
56.8% |
66.3% |
15.5% |
7.6% |
7.9% |
9.1% |
0.684 |
0.099 |
| Josh Tomlin |
30 |
8.10 |
55.9% |
73.8% |
19.1% |
12.9% |
6.2% |
3.6% |
0.746 |
-0.019 |
| Matt Koch |
46 |
4.50 |
55.8% |
58.2% |
12.8% |
11.3% |
1.5% |
6.7% |
0.644 |
-0.138 |
| Carson Fulmer |
31 |
8.13 |
55.3% |
56.5% |
14.6% |
16.6% |
-2.1% |
15.3% |
0.640 |
-0.136 |
| Martin Perez |
22.1 |
9.67 |
55.1% |
51.8% |
11.6% |
10.9% |
0.6% |
10.1% |
0.610 |
0.060 |
| Chris Tillman |
26.2 |
10.46 |
51.6% |
49.4% |
11.9% |
9.5% |
2.4% |
12.4% |
0.641 |
0.011 |
|
Data is current through games of Tuesday, May 29. Methodologies for the calculations remain unchanged from last week. Pitcher score is weighted 50/50 between PD score and xSLG. PD score is weighted as 3 points O-Swing%, 3 points Contact%, 3 points SwStr%, 1 point F-Strike%.
Predicted K% is calculated only from Contact% and SwStr%.
For both “K% difference” and “SLG-xSLG” columns, a negative number indicates good luck that should regress negatively going forward. A positive number indicates bad luck that should regress positively.
ERA, BB%, and SLG-xSLG are included for reference only and not included in any calculations.
![]()


Chaz,
Great article! Can you tell me how Gossett’s ranking would change if you only looked at his last two games? Thanks!
thanks! Gossett has pitched slightly better in the last couple games on the PD side, mainly by making substantial improvements in his O-Swing% which should help a bit. But the main strikeout predictors (Contact% and SwStr%) are very close to his overall numbers. The StatCast side is also in line with overall production, and not very good (xSLG of .626 for those 2 games). So overall the last two games probably don’t change a whole lot.
Interesting. I asked because he’s had a noticeable mph spike and I wondered about the performance impact? Thanks!