Introduction
Not every stolen base opportunity is created equal. Just because a runner is fast, or records a high sprint speed or home to first time does not immediately lead to aggressiveness on the base paths. The amount of factors that go into the decision-making process to send a runner is almost limitless, though it’s clear some aspects come into consideration with a bit more weight than others. The key is identifying those variables in each opportunity and determining the likelihood a runner will take off for that tempting open base in front of them.
First and foremost, a player must simply be given the opportunity to steal. The first step: they have to get on base. But on top of that, once they’re on base, they have to be presented with a base to steal, so no runner can be in front of them. Beyond that, the pitcher has to throw at least one pitch that doesn’t result in contact by the batter and is fielded cleanly by the catcher. If all those things fall into place you have yourself a Stolen Base Opportunity (SBO).
Then comes the decision to steal, or at least attempt to steal the open base in front of the runner now on base with an SBO. Will they make it? Does the catcher have a good arm? Does the pitcher have a strong pick-off move? Is the risk of losing the baserunner worth the reward of sitting in scoring position for the batter to potentially knock them the rest of the way around the bases? How many outs are there? Is the runner’s team winning or losing? Will the runner get hurt? So many questions to ask one’s self, and it’s safe to assume someone within the runner’s organization has thought these things through before the first pitch of the game was ever thrown. The decision-making process shows up over time in the form of tendencies. These tendencies can be measured and over the right amount of time a reliable quantification of intent and aggressiveness can be shown not only for the runners, but for the others involved in the opportunities as well.
I set out to touch on a few of these variables that come into play when runners are presented with an SBO. The following is a breakdown of the metrics that came about from studying the data and tendencies created over the past four seasons (2019-2022) when an SBO presented itself across MLB. Special thanks to Justin Filteau for assisting with the data collection on this project. Without him, this study would never have gotten off the ground.
SBOT vs OPT
Austin Bristow II introduced us to Stolen Base Opportunity Taken (SBOT) a few years ago. Taking advantage of the opportunities provided to would-be base stealers is not a new concept, as discussed by Scott Spratt back in this 2016 piece on Fangraphs. Though it’s been discussed in the past it’s worth providing a synopsis of what SBOT is and why it’s important, especially while trying to analyze a runner’s intent.
First and foremost, let’s define a Stolen Base Opportunity (SBO). For these purposes, an SBO is considered any portion of a plate appearance where a runner sits on first base or second base with the next base open and at least one Stolen Base Pitch (we’ll get to that in a bit) is thrown or a stolen base attempt is made. It should be noted that there can be multiple SBO during the same plate appearance, in the case a runner on first base successfully steals second during a plate appearance and another Stolen Base Pitch is thrown while the same runner now sits on second base with third base open. An SBO is also recorded when a runner attempts a stolen base while the next base is not open, in the case of a double steal) or the attempt is made on home plate.
Now it seemed logical to break down these opportunities a bit further so Opportunity Pitches Taken (OPT) was created. OPT breaks down each SBO into pitches that provide the runner an opportunity to steal. In any given stolen base opportunity a pitcher may throw any number of pitches, but only select outcomes of the pitch can possibly lead to a stolen base attempt. For example, a pitch thrown that results in any sort of contact by the batter (ball in play, foul ball) cannot lead to a stolen base attempt simply due to the nature of the rules. A pitch thrown that results in a wild pitch or passed ball negates the ability of the runner to attempt a stolen base. On top of that, any pitch that results in the batter being given first base (ie; intentional walk, hit by pitch, catcher’s interference), doesn’t provide a stolen base opportunity to the runner.
So, we will [finally] define a Stolen Base Pitch (SBP) as any pitch thrown, while a runner is on first base or second base with the next base open, that is fielded cleanly by the catcher and does not result in contact by the batter or in the batter advancing to first base. This is important to differentiate from the total pitches thrown during an SBO, especially when considering tendencies of the pitcher on the mound – whether they “pitch to contact” or nibble around the edges of the zone will come into play as they provide more or fewer opportunities for the base runner to decide whether or not they want to make their attempt on the next base or not.
For the majority of the remainder of this piece, I’ll be specifically calling out SBO and SBP when it relates to a runner on first base with the opportunity to steal second. Based on the number of opportunities and total attempts made on third base in the past four years, the sample of data strictly related to stolen base attempts on second base provides a bit more nuance for these purposes. For a bit of perspective, between 2019 and 2022, roughly 60% of all SBO came with the opportunity to steal second base compared to third base. In contrast, roughly 87% of all stolen base attempts came on second base compared to third base. Don’t worry, we’ll come back to those opportunities to steal third base later on. I’ll be referring to anything specifically referencing opportunities on second base with a 2 added to the end of the metric and anything specifically referencing opportunities on third base with a 3, just to keep things a bit more clear.

Because it’s based on pitches, OPT2b unsurprisingly becomes reliable in season quicker, stabilizing at 33 pitches. Simply put, runners who run more often do it with seeing less SBP2b per SBO2b, or Pitches Per Opportunity (PPO). Runners who are more passive on the basepaths rack up many more SBP2b without attempting any steals.
When I say “reliable”, I’m referencing the number of events needed to confidently represent the entirety of the final season stat line. More details on how reliability is calculated can be found by reading Jonah Pemstein and Sean Dolinar’s 2015 piece on Fangraphs titled A New Way To Look At Sample Size. Russell Carlton explains why the o.7 mark is a good one in his Baseball Prospectus piece titled Baseball Stable: Reliably Stable (You Keep Using That Word)
“I looked for the point where the reliability estimate/correlation crossed .70, because at that point, the R-squared is (just shy of) 50 percent. We have accounted for 50 percent of the variance just by keeping…the circumstances (roughly) the same.”
In contrast, SBOT2b was found to become reliable in season at 40 SBO2b.
The runner isn’t the only one involved in an SBO. Sure, some base runners will run regardless of the other variables, but every situation has more going on than just the speed of the runner. For the purposes of this study, I looked at the impact the pitcher, catcher, batter, manager, and certain game situations can have on a runner’s intent to take the next open base when presented with an opportunity. The wonderful thing about SBOT and OPT is they can be calculated for anyone involved in the SBO. The runner, pitcher, batter, catcher, and manager each have their own base running tendencies and metrics associated with them, though some are more reliable than others.


Besides the runner himself, the pitcher (not the catcher) presents the most reliable OPT in-season. This is somewhat understandable as the pitcher has fewer variables himself during an SBO as they typically see the same catcher, or the same two catchers, all season whereas the catcher is provided multiple pitchers, all with different arsenals, tendencies, and abilities. The pitcher is provided with a consistent backstop with a relatively stable pop time to consider, so the only true variable is under their control more so than their battery mate.


The other two individuals that play at least some role in whether a runner decides to steal are the manager, who ultimately makes the call to provide the green light or not, and the hitter at the plate. Ultimately, it should be safe to assume the manager, in general, is taking into account every variable when deciding whether to send their runner or not – the speed of the runner, the pop time of the catcher, the weather, the time of day, the score, the injury concerns, and so much more. If they themselves aren’t, then there’s at least someone in the front office or analytics department who has taken it all into account and provided that data to the manager and players. It’s all baked in. And because all of those variables change from opportunity to opportunity, and the skillsets of the manager’s players change over time, their OPT (and even more so their SBOT) is less reliable as it stands alone. So, perhaps don’t put as much stock into the “their manager doesn’t like to run” narrative, at least not at face value.


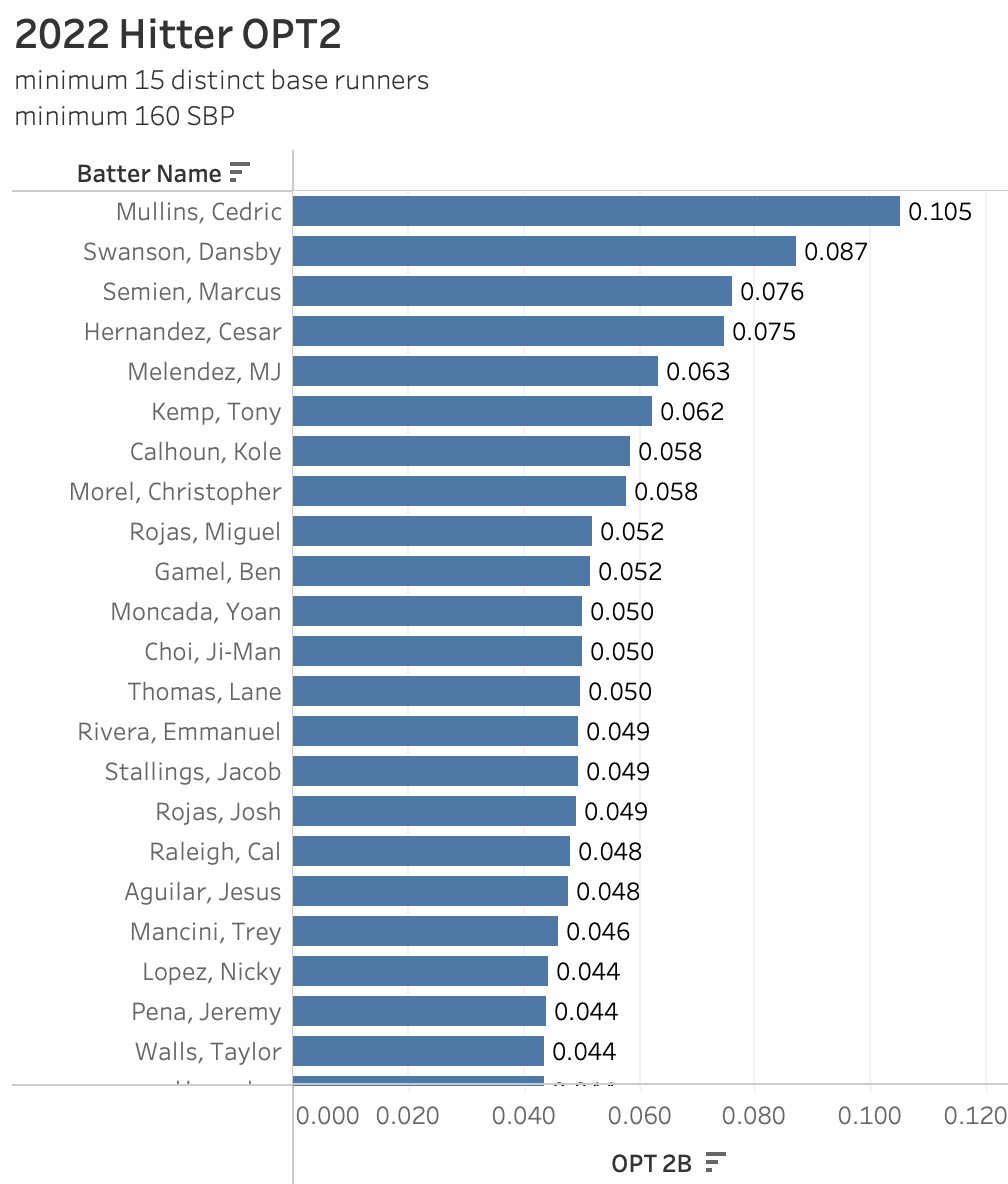
The other narrative one may have come across is the idea that when there are certain batters at the plate, runners are less likely to take the risk of stealing a base. On the surface, there’s some truth to this, as a hitter’s OPT will stabilize at about 160 pitches in-season. The catch here is that this number is mostly reliant on the runners themselves. To put it in perspective, in 2022 only 24 hitters saw 20 or more different base runners in an SBO2b during their plate appearance. 590 hitters saw 10 or fewer different runners in the same situation. So, there very well could be something to conclude from seeing a hitter with a high OPT and a high number of distinct runners during their plate appearance, on its own the stat provides less reliability without filtering out the noise built in.
Variables
So, now we have metrics that help us measure how often a runner takes advantage of opportunities presented to them as a whole, but each one of those opportunities is not created equal. There are many variables that are taken into account and some play to the strengths and weaknesses of each individual runner. It can be difficult, and close to impossible, to filter out all of the noise when determining the very specific tendencies of a runner and, ultimately, quantify the runner’s intent to attempt a stolen base in any particular situation. So, it’s important to focus on the variables that carry the most weight and go from there.
This is where I call upon Kyle Bland, Director of Analytics for Pitcher List, to help out. Kyle was able to run the data from the last four seasons (2019-2022) through a logistic regression model and determined the weight that specific variables (that we had at our disposal) had on the likelihood a runner would attempt a stolen base. Variables in question included the catcher’s average pop time to second base, the runner’s average sprint speed, the handedness of the pitcher, the score differential at the time of the SBO2b, and the number of outs at the time of the SBO2b. The model found that the ability of the players themselves (catchers’ pop time and runners’ sprint speed) held the strongest weight, though the game situations still played their own role in the runner’s (or manager’s) decision-making.

It should be noted that the weights presented here are specifically for SBO2b. We’ll get into the weights for SBO3b later on, but it’s interesting to note that though catcher pop time plays a larger role in SBO2b, it was found to have a negligible impact on SBO3b.
Splits
Now we have some variables to work with. There are two directions to take this information. The first is to look at player splits in different situations and compare their SBOT to their split SBOT, to identify specific situations a runner is more comfortable, or even likely to make an attempt on the next open base. For the purpose of these splits, I simply wanted to compare a runner’s tendencies in close-to-binary situations (pop time above or below league average, positive or negative run differential, number of outs, pitcher handedness).
As was discussed earlier with SBOT and OPT, the splits of each of these metrics can be calculated for the other positions involved in the SBO as well, with the runners’ sprint speed being plugged in place of their controlled variable. Because we’re only interested in how the individual’s SBOT performs in these specific split situations, the weights discussed earlier don’t come into play. Don’t worry, they become rather important later on when we look into the second direction.
To measure the intent a runner has to run in any given situation, it’s important to separately visualize the differences in their tendencies in different situations, and then aggregate the variances of each split together. This provides a measurement that shows whether a runner is typically being held back or benefiting from seeing specific situations during their SBO or if they are less influenced by the variables in question. Consider it a sort of “luck” measurement, one in which some runners are influenced by, while others are not. I have termed this metric Stolen Base Intent (SBI), and, like SBOT and OPT, it can be calculated for pitchers, catchers, and hitters, but we’ll focus on the runners for the time being.
The metric can/will evolve as more data becomes available that can be shown to influence stolen base attempts as a whole, but in its current form, it takes into account a runner’s stolen base attempt splits revolving around pitcher handedness (L v R), score differential (Runner’s team is up, down, or tied), catcher pop time to 2B (<2 vs 2+), and outs at the time of the SBO (0, 1, or 2). Each split SBOT2b is subtracted from the runners’ full SBOT2b and that difference is squared. Each squared difference is added to each other and divided by one less of the number of splits used, which is currently 10. This is simply calculating the variance between the different split SBOT2b, using the runner’s full SBOT2b as the mean. (In an effort to make it easier to read the result is then multiplied by 100). Here’s a simplified version of the equation:
SBI = (∑(SBOT split – SBOT)2 / 9) * 100
The higher variances between a runner’s splits will result in a higher SBI, which in turn indicates the runner tends to run more often only when specific situations are presented to them during an SBO. Lower variances between splits result in a lower SBI, indicating a runner is less influenced by the variables in general, and their stolen base rate is a more accurate representation of their intent in any given situation.
To break it down into segments, there are four types of extremes.
Low SBI + High SBOT – These runners run a lot and don’t necessarily care about the situation or the variables at hand. Their SBOT will carry more weight across different SBO.
High SBI + High SBOT – These runners may have run a lot, but their SBOT may be untrustworthy based on the situations they were presented. Their high SBI would indicate they prefer specific situations during their SBO and may have gotten lucky with the variables presented during that stretch of SBO.
High SBI + Low SBOT – These runners aren’t running much and it is likely due to the fact they are picking their spots carefully. If they were to find themselves in more favorable opportunities that played to their split preferences they may run more often.
Low SBI + Low SBOT – These runners aren’t running, regardless of the situation
Here are a few examples from 2022:
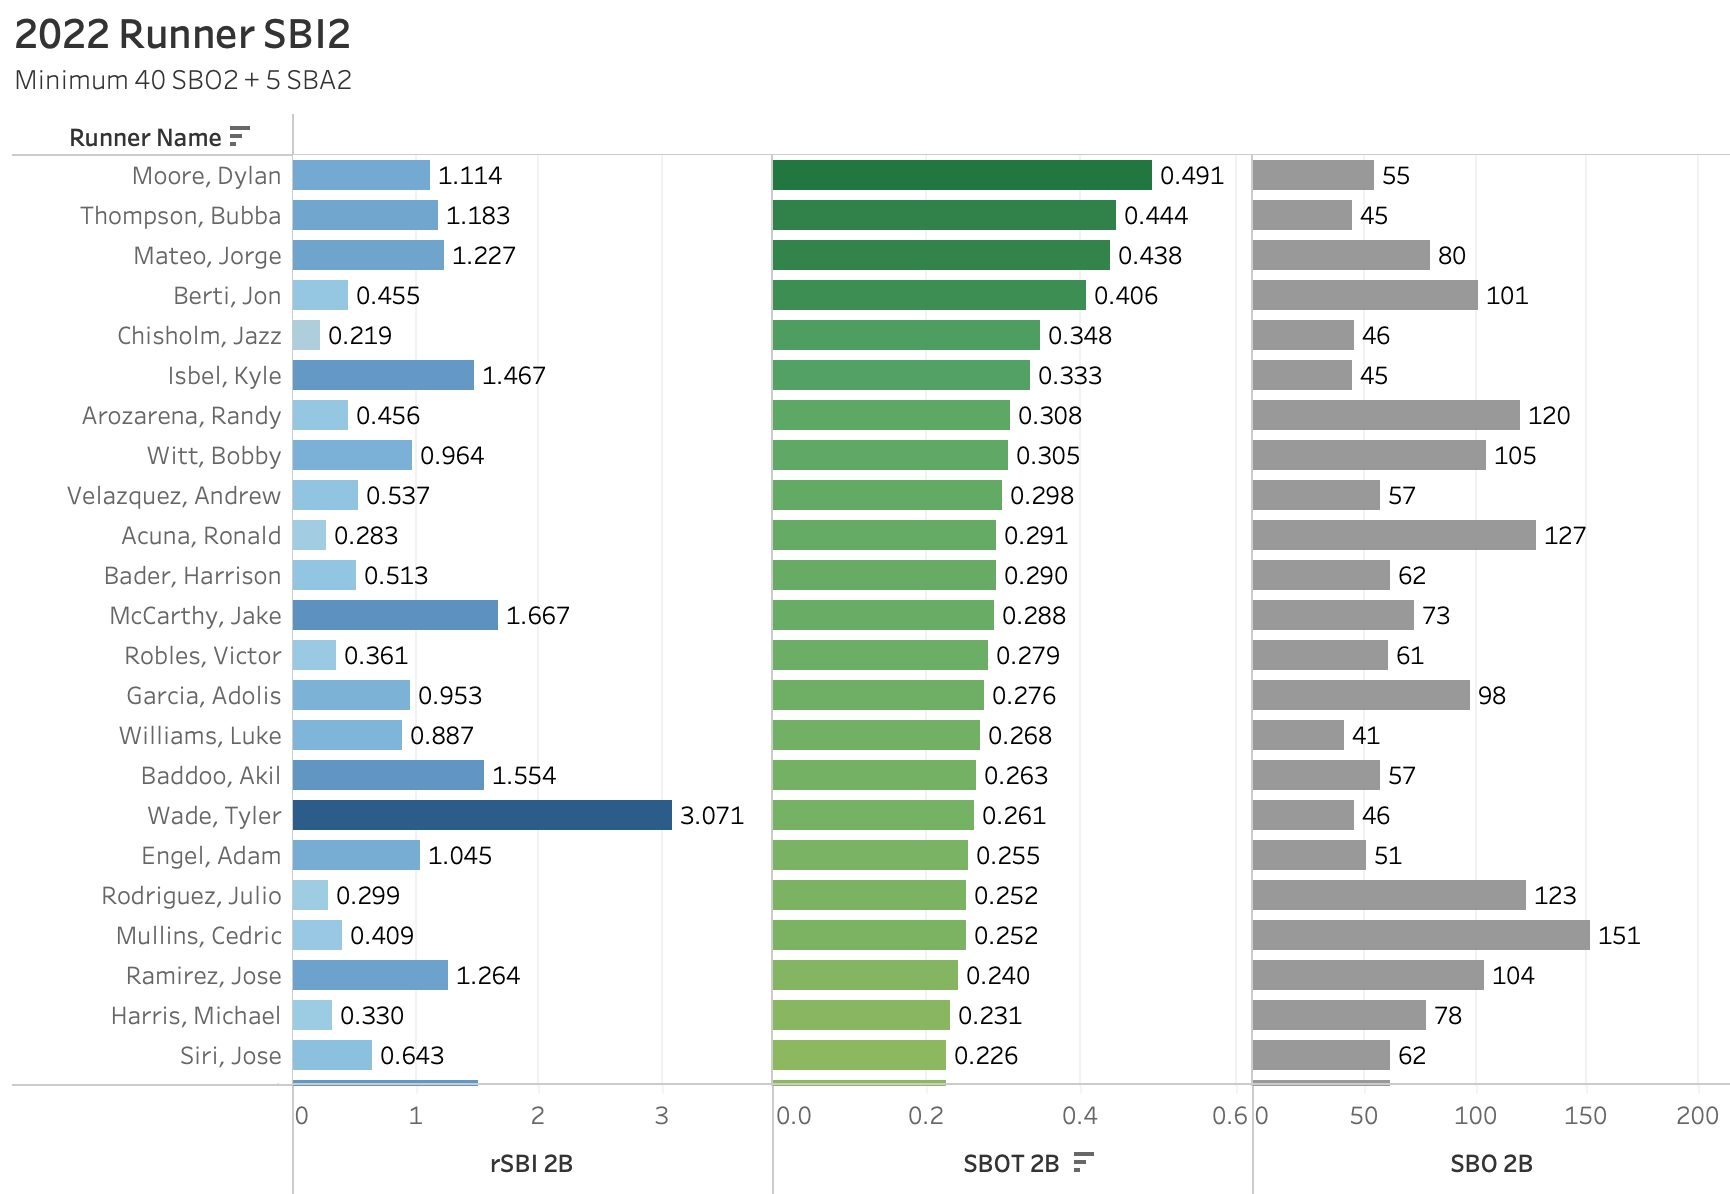
This first chart would indicate that Tyler Wade may have benefited from being in specific situations more conducive to his tendencies, while players like Jazz Chisholm Jr., Ronald Acuña Jr., and Julio Rodríguez were less influenced by the specific situations they were put in through the season and their SBOT2b would carry more weight from opportunity to opportunity. If we break down Wade’s splits in full we’ll see exactly what tendencies in 2022 led to such a high SBI.
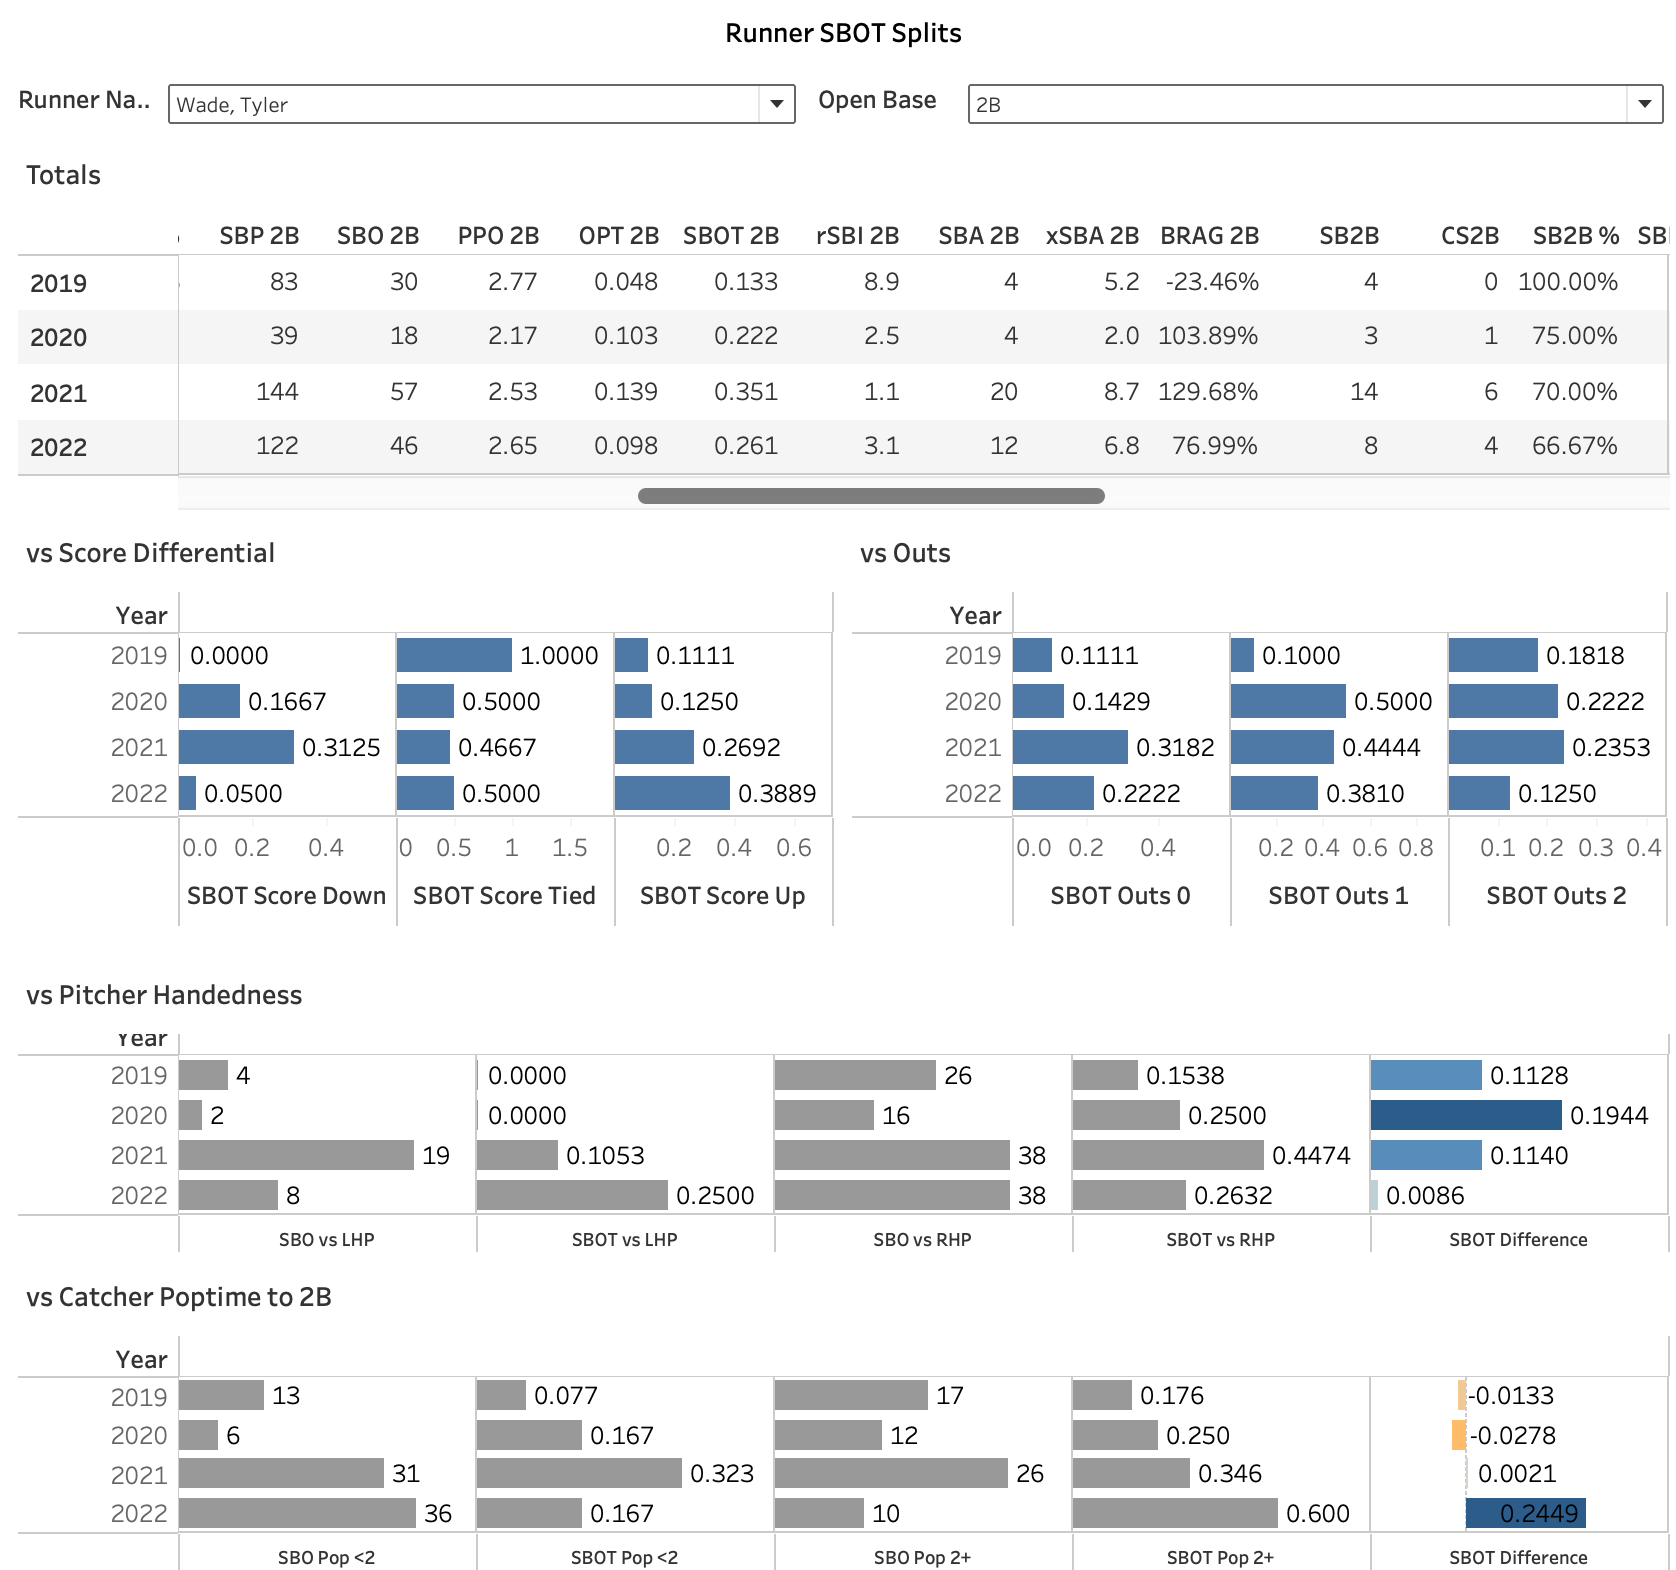
When on second base, Wade favored running against catchers with low pop times tremendously over those with stronger throws. Pitcher-handedness didn’t come into play too much in 2022, though he did consider the score a bit more as well. Compare these to his 2021 lines and you’ll find a much more stable SBI due to the evenness of his splits and thus his decision-making.
Now let’s consider runners with low SBI2b
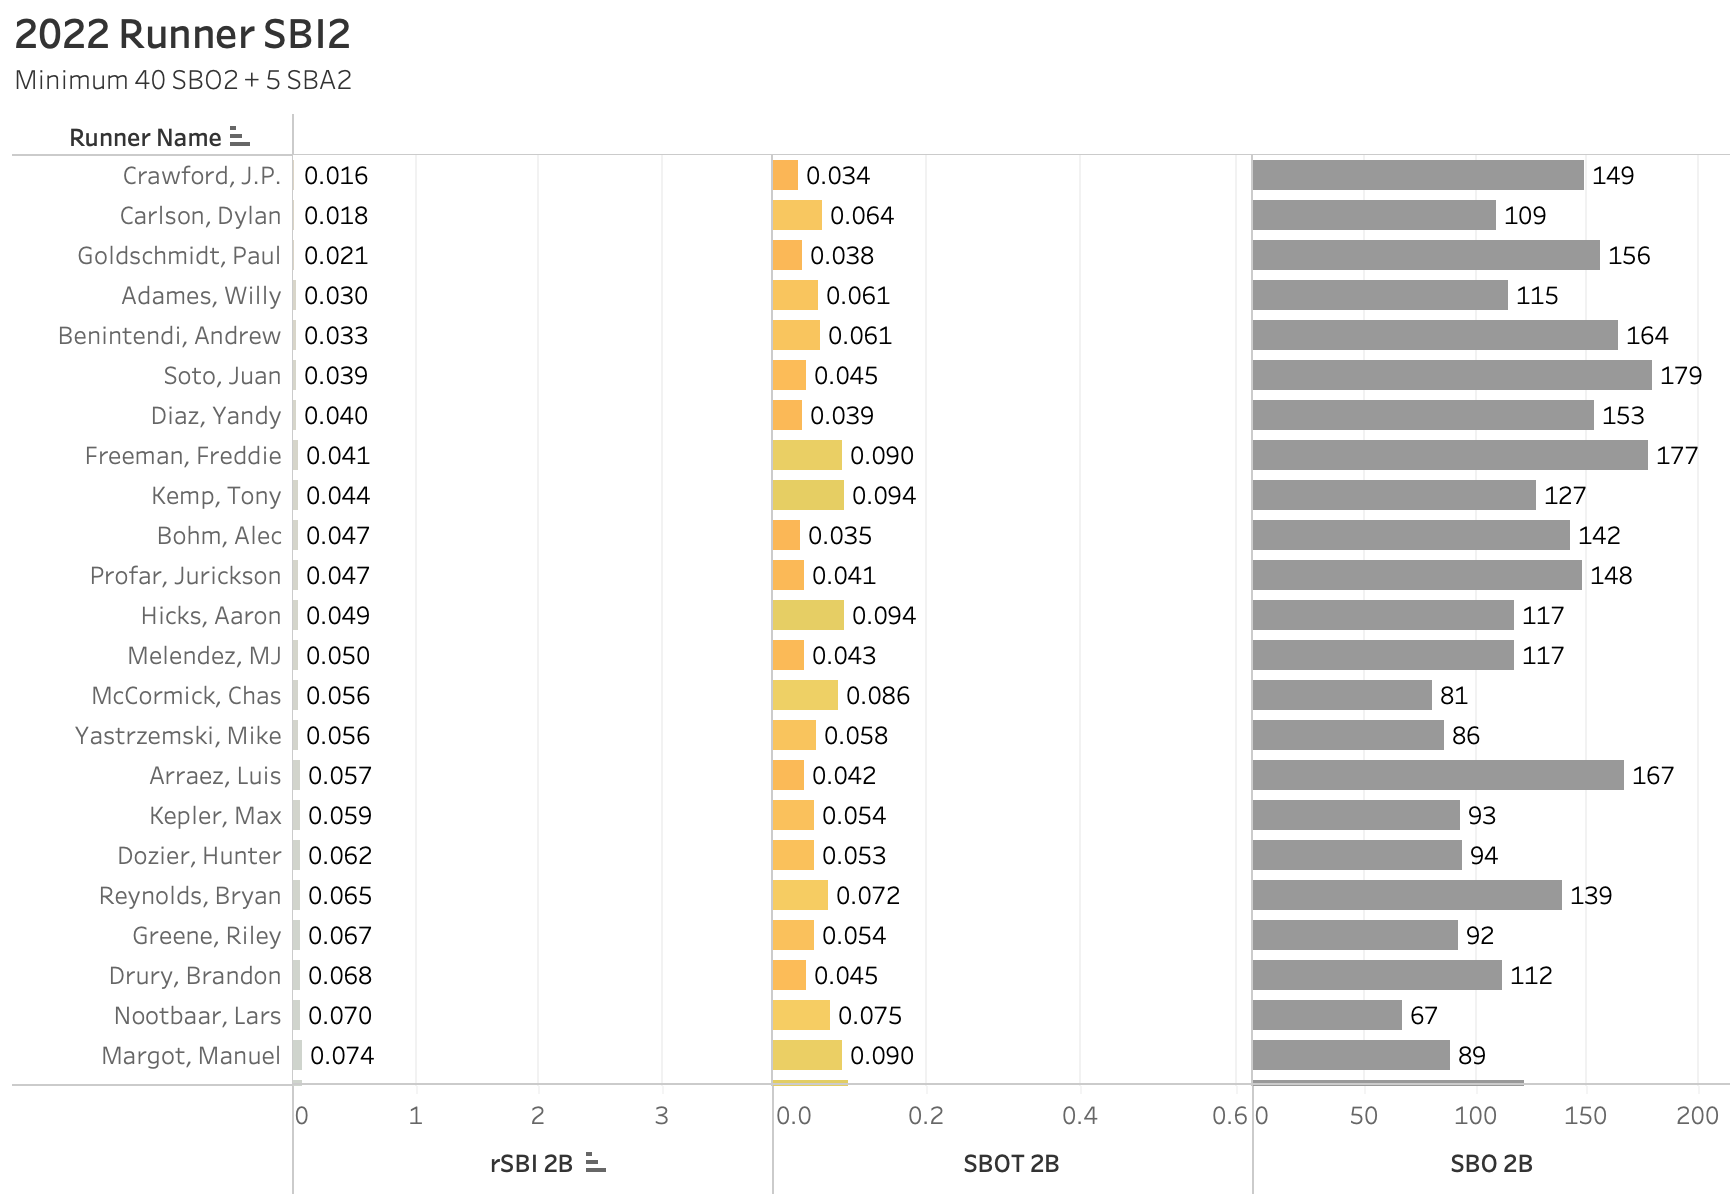
Those runners who put up an above-average SBOT2b in 2022 (Freddie Freeman, Tony Kemp, Aaron Hicks, Chas McCormick, Manuel Margot) were able to volume their way to viable stolen base attempt totals simply due to the fact that they are not easily influenced by the variables presented during their SBO2b. The runners on this list with extremely low SBOT2b (J.P. Crawford, Paul Goldschmidt, Yandy Díaz, Alec Bohm) simply should not be expected to run in almost any situation.
Calculating xSBA and BRAG
While SBI can be useful in determining what runners may have lucked into good situations that benefit them based on their specific tendencies, there’s also the opportunity to measure which runners are being over- or under-aggressive on the basepaths based on the overarching variables discussed earlier.
Based on the model mentioned earlier, put together by Kyle Bland, we can now estimate the stolen base attempts we would expect a runner to make based on the influence those variables have on any given SBO. The model determined there were different weights put on each variable based on whether it was an SBO2b or SBO3b, so it’s important to differentiate between the two to calculate a more true Expected Stolen Base Attempt (xSBA) total. The full equation for xSBA looks more complicated than it actually is, but what you just need to understand about it is that each variable is weighted based on the influence it has on the runner making an SBA during that SBO and it can be used to calculate the likelihood of an SBA happening in any given situation, based on the variables provided. (Note: The “e” in the final equation is a constant called Euler’s number)
y2b = -22.1721 + (0.5348 if RHP) + (0.0661 * Score Diff) + (0.5913 * Sprint Speed) + (0.1865 * Outs) + (1.3171 * Pop Time to 2B)
y3b = -17.2374 + (-0.46 if RHP) + (0.0481 * Score Diff) + (0.4852 * Sprint Speed) + (-0.0633 * Outs)
xSBA = 1 – 1/(1+ey)
Once we calculate xSBA we can then compare it to the actual SBA to determine how under- or over-aggressive a runner has been over a certain time frame, while controlling for sprint speed, pop time, game score, outs, and pitcher handedness. This is called a runner’s Base Running Aggressiveness (BRAG)
BRAG = (SBA / (xSBA2b + xSBA3b)) – 1
We can safely ignore expected stolen base attempts on home plate as every runner safely rounds down to zero.
Here’s a leaderboard of runners who were more aggressive compared to their xSBA, after controlling for the variables listed earlier.
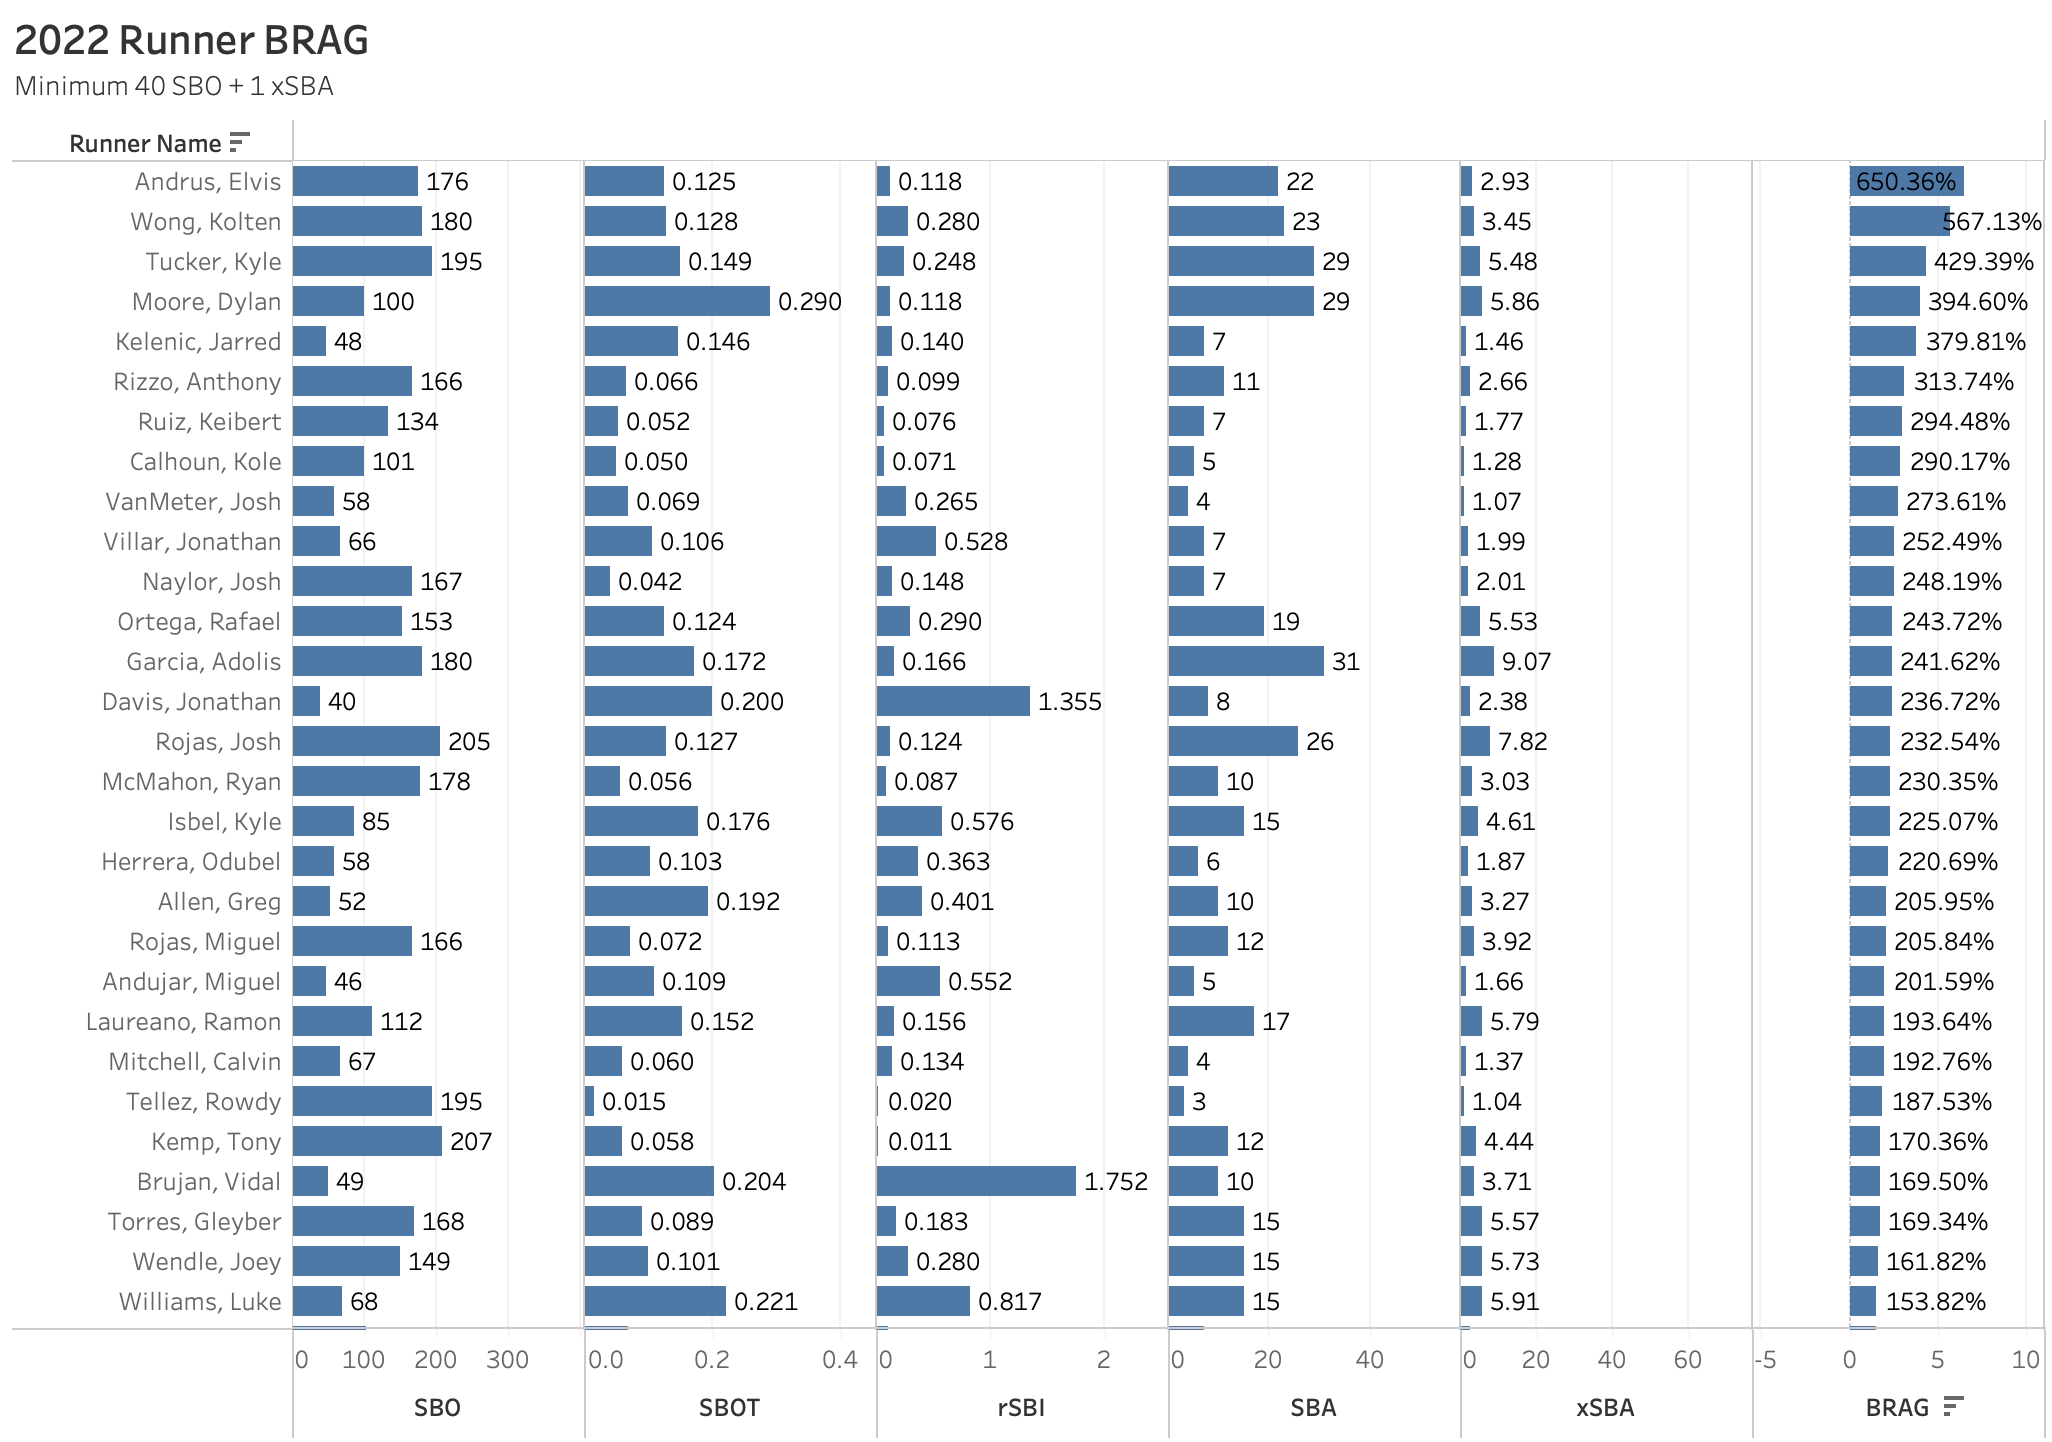
Most notable on the list are Elvis Andrus, Kolten Wong, Kyle Tucker, Rafael Ortega, Josh Rojas, Gleyber Torres, Joey Wendle, and Adolis García as they each had the most opportunities (>145 SBO) and took full advantage (>0.08 SBOT), despite the expectation to the contrary. Of that group, Wong, Tucker, Wendle, and Ortega recorded the highest SBI (>0.245) and could have benefited from favorable situations throughout the year that played into their strengths and tendencies as base stealers.
As for runners that were a bit less aggressive than would have been expected
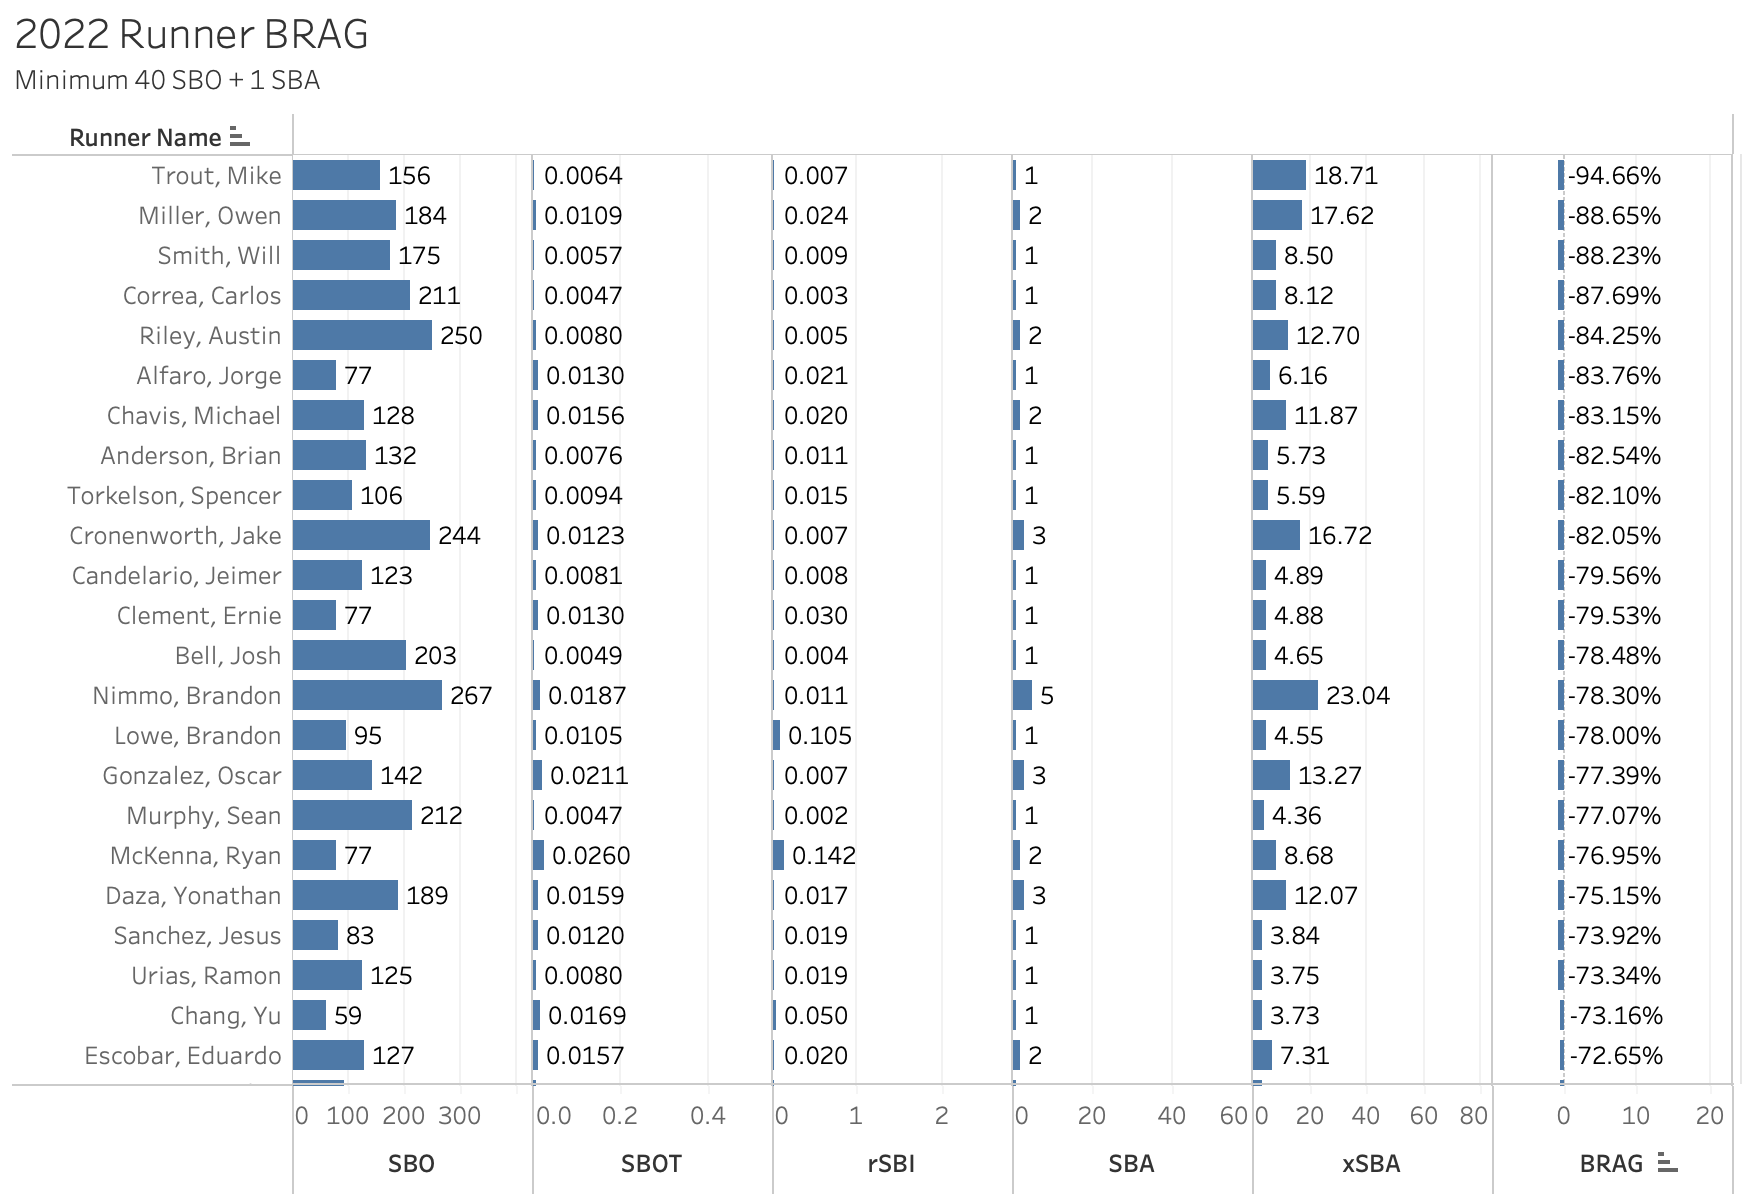
There are other variables that come into play regarding a runner’s intent to steal, some of which are completely out of their control. The most notable one that was not taken into account in this study was recent injury or fear of future injury. Enter Mike Trout, the least aggressive runner on this list and most would assume strictly due to the risk of future injury that could come from the aggressive act of attempting a stolen base. It’s possible those on this list with higher SBI could find themselves with more SBA in the future as their future SBO provides more favorable variables to their liking. Overall, this list of players, on the surface, seems to have the ability to run more often than they do, but for other reasons not included in this study, they simply take it slow, or at least they did in 2022.
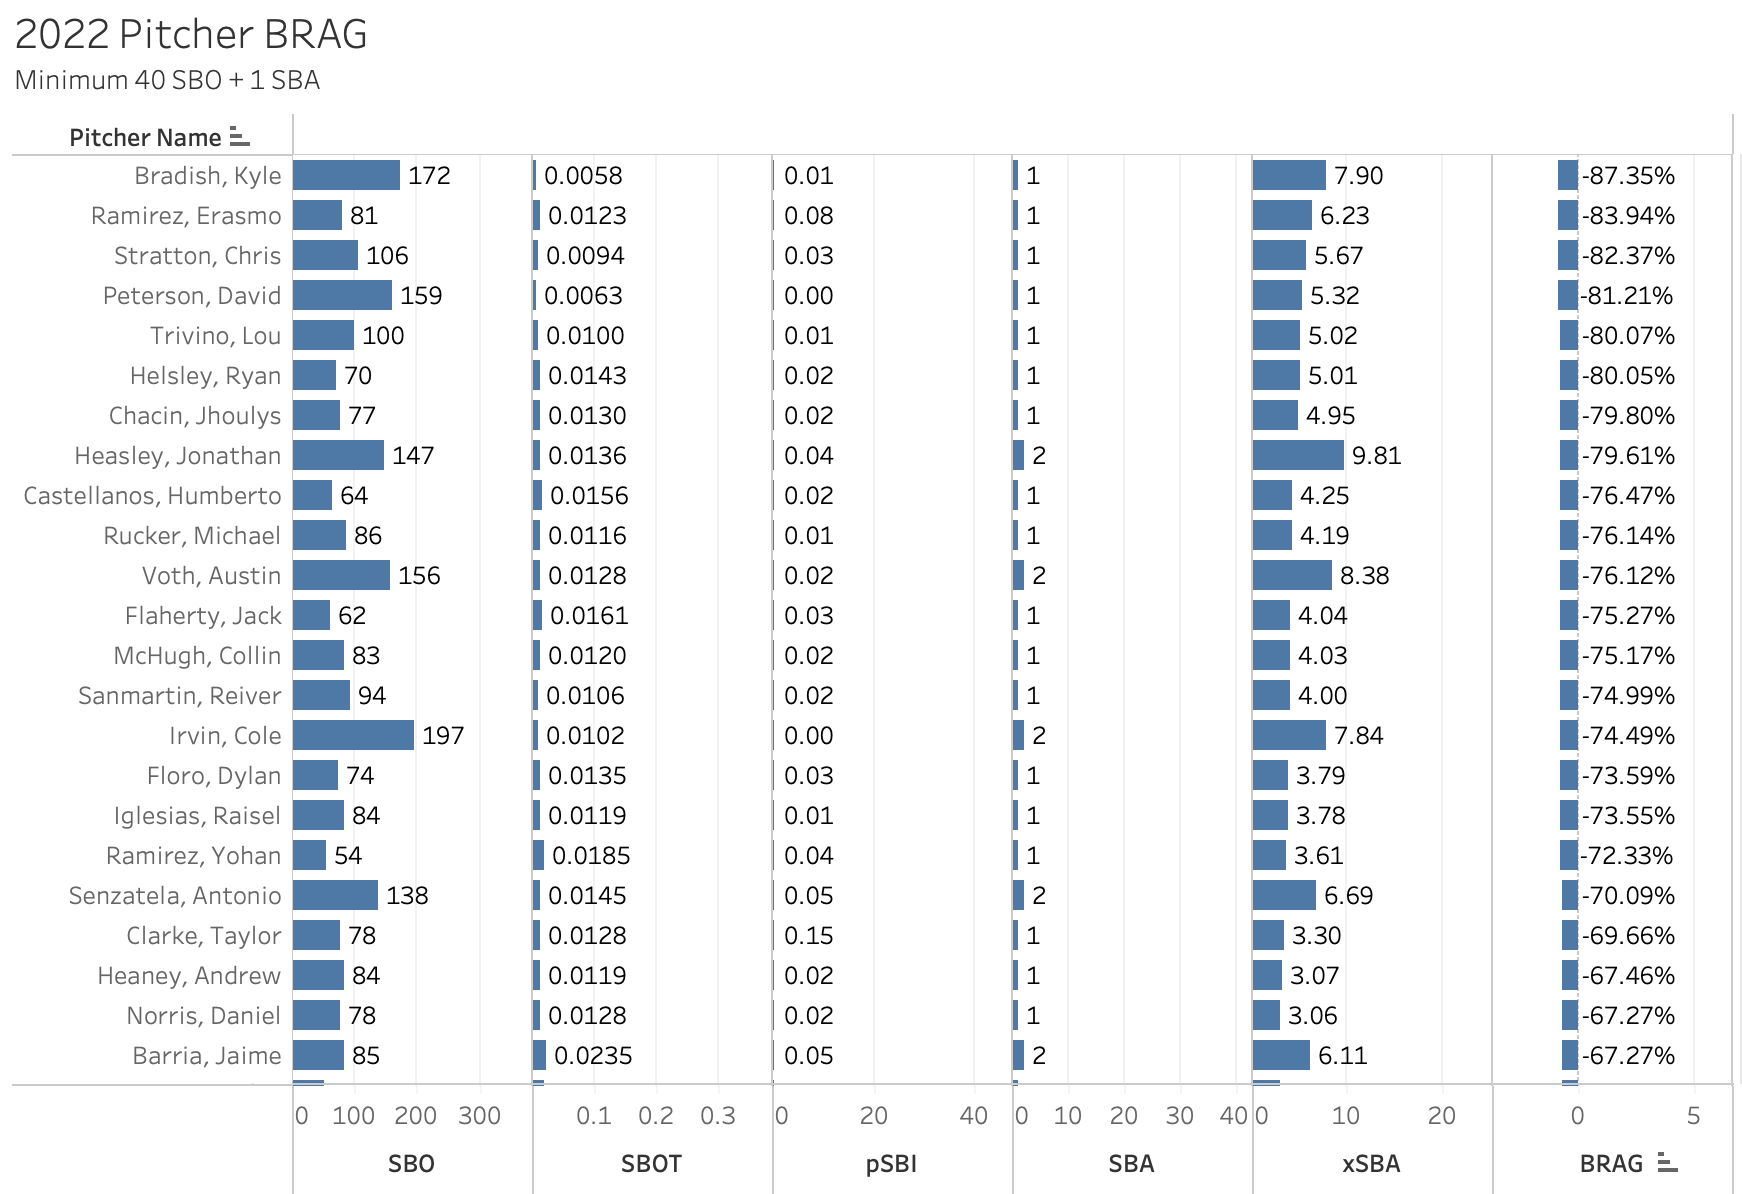
As discussed earlier, pitchers have more of a target on their back when runners are deciding to attempt a steal, and some are simply better at holding the runners back than others, whether or not that is due to a good pick-off move, quick times to the plate, or even pitch arsenal. Let’s take a look at the pitchers that allowed more SBA than our model would have expected, controlling for the five variables we’ve been referencing.
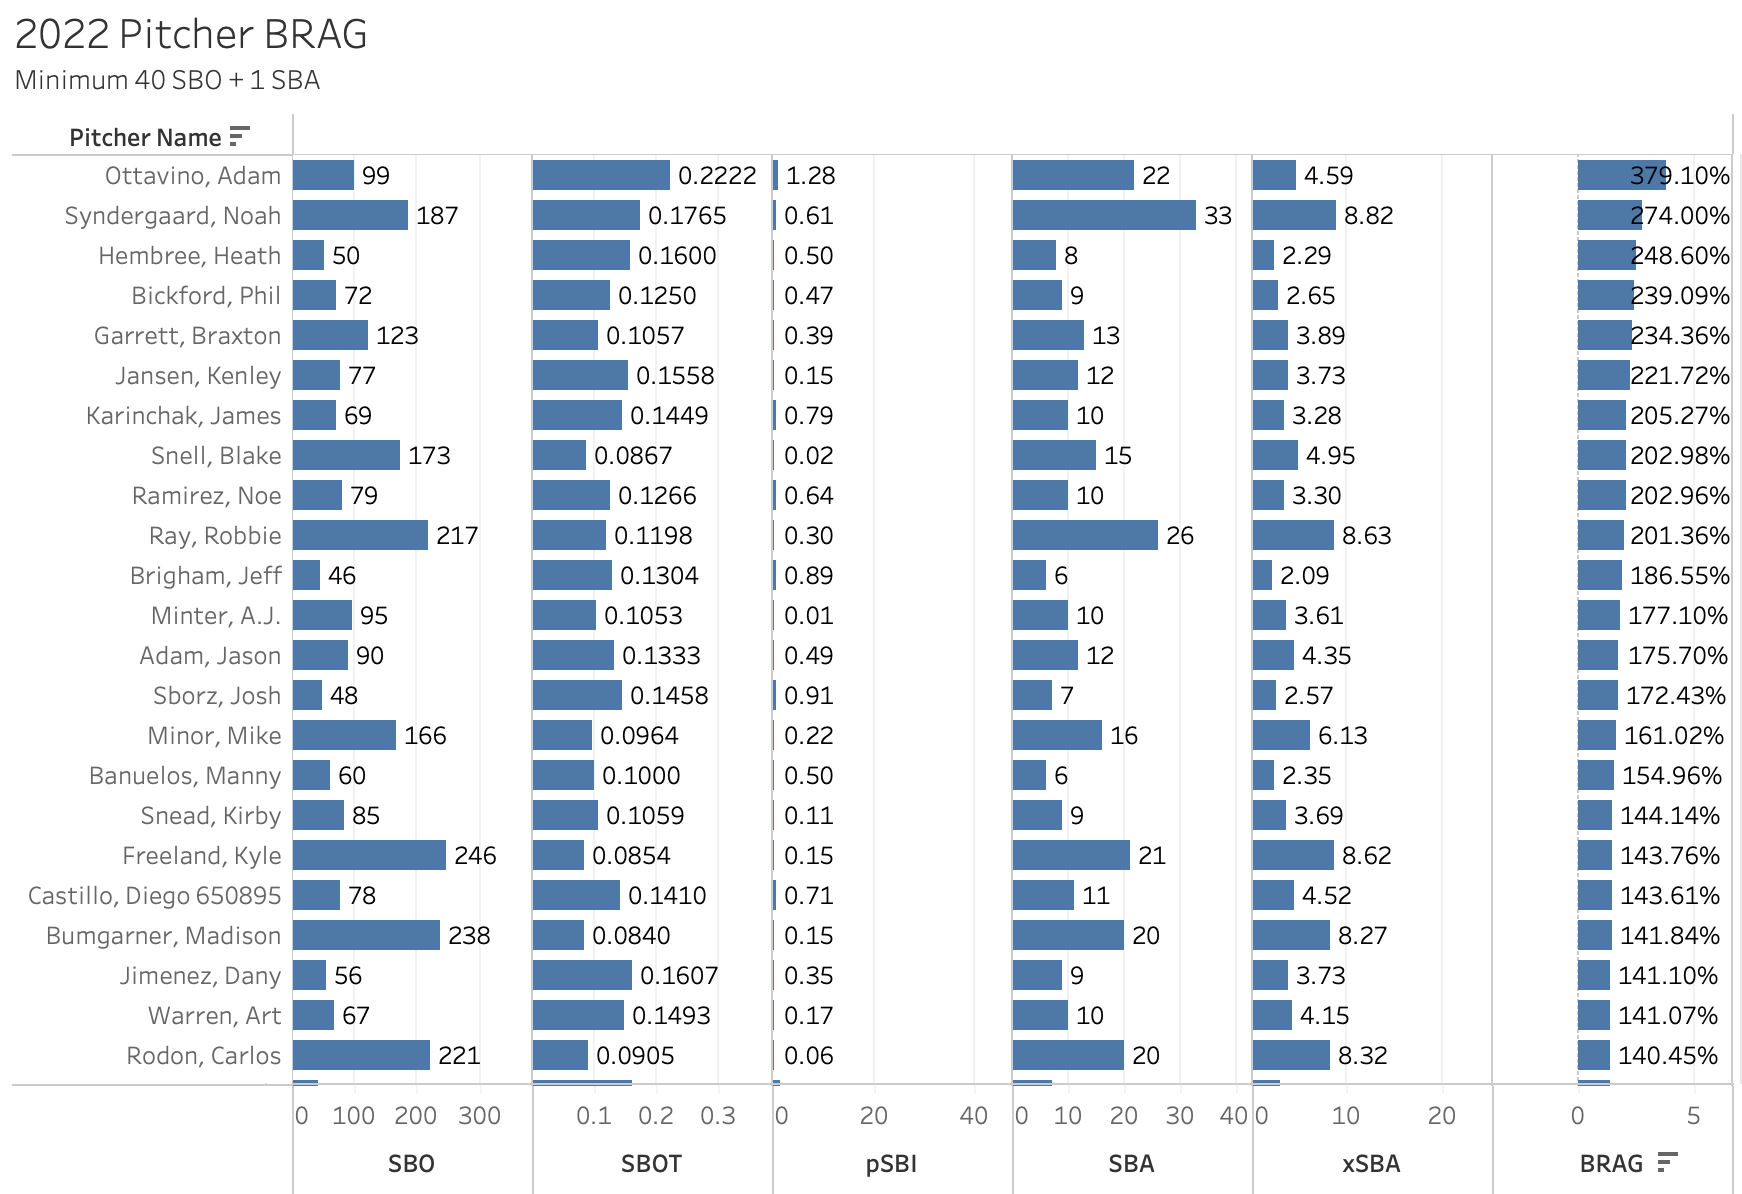
Keep an eye on the games in which these pitchers are throwing. There’s a strong possibility they’ll be providing an extra opportunity to base runners to advance.
Now onto the pitchers who did a better job holding runners than the model would have expected.
There’s always the possibility runners find ways to take advantage of situations while these pitchers are on the mound, but so far these pitchers have shown the ability to hold runners back regardless of the other variables. Maybe don’t expect even the best runners to bother attempting any steals against these pitchers unless some other drastic situation presents itself.
Conclusion
Using the data at our disposal it’s easy to see that many variables are taken into account when a runner decides to attempt a stolen base. Just like a batter shows tendencies at the plate versus like handed pitching or against high fastballs, a runner can play to their strengths on the base paths and can be more prone to being aggressive in the right circumstances. The key is identifying those tendencies and determining their validity.
SBI sets a strong base for measuring those tendencies for a base runner, providing a jumping-off point for analysis regarding whether or not a runner “got lucky” in their SBO situations or ignored the variables altogether. BRAG identifies runners, and pitchers, who have either been influenced by other strong variables not taken into account in this study to make them more or less aggressive on the base paths than we may expect. It creates another jumping-off point for further analysis by cutting out some of the stronger noise that influences base running decision-making.
Both metrics can (and will) be improved upon in the future, in order to filter out even more variables, but as of now, they provide added insight that can be useful for identifying situations that may conducive to added stolen bases. Consider OPT/SBOT/SBI to be a sort of stolen base slash line that helps identify runners making the leap in season, regardless of the type of opportunities presented.
ADDITION 3/26/23: BRAG Tabs. Below you will find an interactive set of leaderboards that encompasses data since the 2019 season, revolving around the metrics outlined in this piece.