


There are tons of statistics, old and new, that try to offer a practical way of “predicting” what a pitcher can do. In fact, almost every day you will find someone on Twitter praising their discovery about a new way of summarizing a pitcher’s capability or their possible future performance. That’s the world we are living in, and that’s fine with me.
So fine, in fact, that I’ve taken the same path.
Like any other tinkerer in this community, I’m pleased with all the data we get and all the info we have access to these days, I’m on the side of those that believe that more info, more power. While doing player analysis, we are used to swiping through a myriad of stats, comparing, relating, correlating, regressing, and we have the feeling that this will lead to a better result. That’s understandable and usually true, but it can also be exhausting.
That’s why in the past, I’ve been very eager in trying to develop simpler indicators that can work as well or better than others that are harder to calculate. I also prefer to combine multiple stats into one simpler aggregate. I’ve had success in using very simple stats as (K-BB)/IP or K%-BB% as good estimators of a pitcher’s future performance. They have provided guidance, but we know they are not an all-around solution; there is no such thing, but we can always keep trying.
So, in line with that, I wanted to have an indicator — a meta-number of sorts — which could be a summary of a few others and work as a quick first sign of what is lying ahead in terms of pitching performance.
Don’t we have other stats for this kind of thing? Sure, and we must continue using them; I’m just trying to simplify the work without denigrating or distorting the info.
Also, please let’s focus on this as a “first sign”. This is not by any means a complete and catch-it-all solution; it is a first step meant to open the door. You still have to keep walking to go beyond.
Simple Pitching Estimation indeX: speX
speX is an aggregate index composed of K-BB%, CSW, pCRA, Zone%, and O-Swing%. Why these? Honestly, I have been using them for some time by themselves, relying on my knowledge and instincts to gauge and decide which was more important in each case; although that’s not wrong per se, we know how subjective we humans are. Our subconscious biases define our decisions more often than not, so I wanted to find a way I could bypass that intuitive process; speX is the result.
These five stats provide a balance between dominance by power (basically, the strikes in CSW and K-BB%) and dominance by control and location (Zone% and O-Swing%) with the ERA estimator in between.
Let’s take a quick look at each one of them.
K-BB%
This is probably one of the most important of the traditional pitching stats; it’s deceptively simple and extremely useful. Basically, strikeout rate (K%) and walk rate (BB%) measure how often a pitcher walks or strikes out a hitter per plate appearance. To calculate them, you just have to divide strikeouts or walks by the total number of plate appearances:
- K% = K / PA
- BB% = BB / PA
Strikeout and walk rates are extremely important when we evaluate pitchers as the former helps their cause as they’re direct outs that (most of the time) don’t advance base runners, and the latter produces free bases (and possible runs).
One of the beautiful things about this stat is that it has a good amount of predictive capability; pitchers that do well (as in having a higher K-BB%) tend to have better results. A more rigorous approach to test this is doing correlation tests on it, for example, we can correlate the K-BB% from a pool of pitchers with their SIERA for the following season to check if having a good K-BB% in one season, predicts having a lower SIERA in the following one.
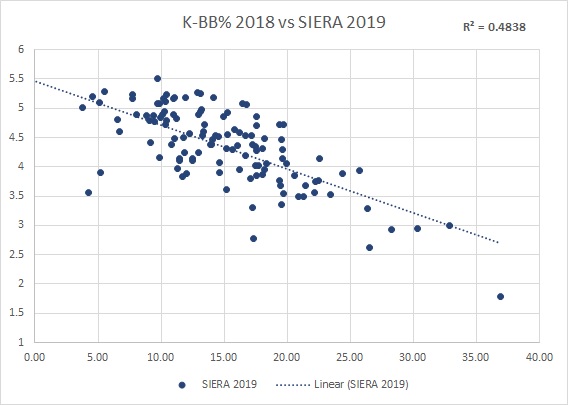
We can graphically see that the higher the K-BB% is (horizontal axis), the lower the following year’s SIERA (vertical axis). I used 2018 K-BB% and 2019 SIERA (min. 75 IP each season, n=121) for this example. If you haven’t heard of it before, SIERA stands for Skill-Interactive Earned Run Average, and it is an ERA estimator. It states that strikeouts are good, and walks are bad depending on how many you throw. The formula and its application are more complicated, of course, but you can check out a good explanation here.
One of the most important things about SIERA is that it has predictive value, and it can give us a good sense of whether or not the pitcher is doing better or worse than what his ERA shows. All of this makes SIERA a widely use stat for pitcher evaluation.
The above graph shows a coefficient of determination R2 of 0.4838, which translates into almost 70% of correlation between K-BB% and the following year’s SIERA; this means that 70% of what happens with SIERA could be explained because of K-BB% from the previous year. That’s tremendous, even considering it is a “could”.
Called Strikes, and Whiffs (CSW%)
Taking the words from Alex Fast in his 2019 FSWA Research Article of the Year about this stat: “Coined and created by Nick Pollack in the 2018 season, CSW rate stands for Called Strikes + Whiffs and the formula for it is simple:
Called Strikes + Whiffs
Total Pitches
It considers called strikes, swinging strikes (including blocked ones), swinging pitchouts, and foul tips into the glove while excluding foul balls. While the formula may seem rudimentary, the implications are far from it. CSW rate is a simple, fine-tuned and, most importantly, a predictive metric that gives us a better glimpse into the true skill of a pitcher.”
For the same data pool and conditions I previously used, this is the relationship graph between 2018 CSW vs 2019 SIERA:
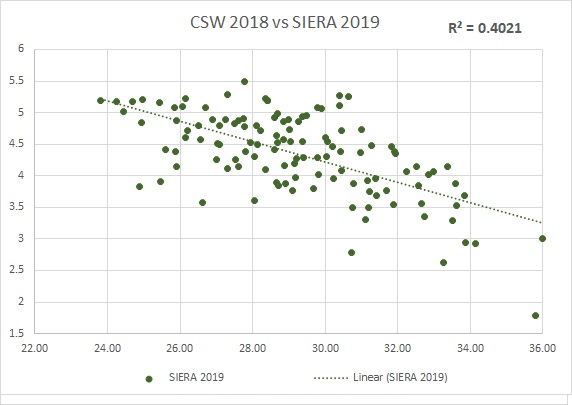
They correlate 63%, which is pretty good for baseball. I highly recommend reading the mentioned article for a better and expanded explanation of CSW.
pCRA
The original work of Connor Kurcon, pCRA (Predictive Classified Run Average) is probably one of the best ERA estimators since the appearance of Statcast. It is the predictive constituent of Classified Run Average (CRA), which formula is:
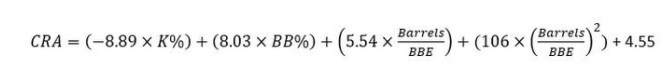
To decipher this simply, CRA adds balls in plays (BBE) and more specifically Barrels to K% and BB% as important factors to describe ERA and, by that way, obtaining an actual deserved quantity of runs, solely dependant on the pitcher’s ability.
pCRA’s formula is derived from this one but introduces “probable” K%, BB%, and Barrels/BBE to be able to act as a predictive stat.

Although the calculation for the “probable” terms requires some math and statistical analysis, Kurcon has done all the heavy lifting and we have available those formulas and numbers. What we must be clear about it is that pCRA shows the best year-over-year ERA prediction compared to other descriptive ERA estimators. For a more in-depth explanation, I highly recommend reading the full explanation in this article.
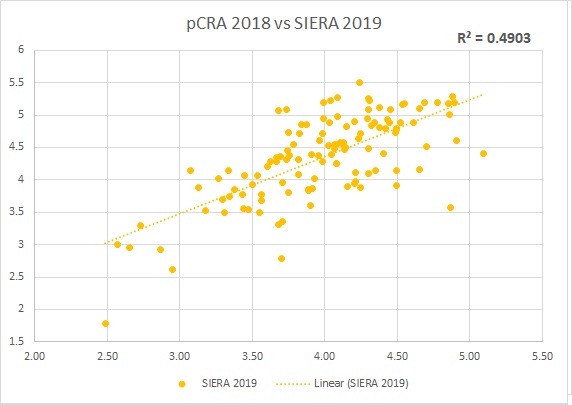
pCRA is the highest correlated to the following year’s SIERA from all the composing stats of speX, at an R2=0.4903, which translates to a little more than 70% of correlation:
O-Swing% + Zone%
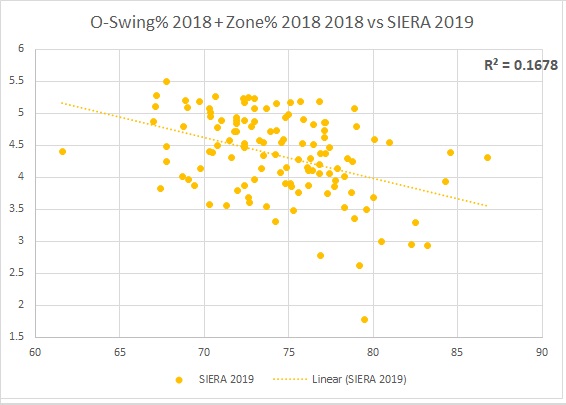
Known as part of the discipline stats, O-Swing% and Zone% roughly show how well the pitcher gets swinging strikes with pitches outside the strike zone (chasing) and which percentage of his total pitches fall into this zone, respectively. Here is a good summary of them and other discipline stats.
These two stats do not correlate well with the following year’s SIERA together or by themselves (take a peek at the following graph, and you can see what a low-correlated relationship looks like) but they add something that is needed: a measure of command and control. Relying only on stats that heavily value swinging strikes and stats that value high velocity introduces blind spots: Pitchers that depend more on deception and location get overlooked. Also, and extremely important here, these stats help with speX to SIERA correlation, too, when used in combination with the other composing stats.
Putting It All Together
I’ve been toying around with this idea since last year, with two previous versions with encouraging but incomplete results done (you can read about them here and here). Late last November, I began working with Pitcher List data-team member Jeff Nicholas, who diligently started getting the data and crunching the numbers. This spawned a months-long exchange of ideas and discoveries between us.
Initially, I was using True F-Strike% (the percentage of pitches that provide leads to a 0-1 count, excluding balls in play), (K-BB)/IP, and SIERA instead of O-Swing%, K-BB%, and pCRA, respectively. These latter stats were incorporated due to the enhanced results they provided in terms of better correlations and their impact on the Variance Inflation Factor (VIF) among other things. I won’t bore you with the math that led to it now (I’d do that later), so just let me introduce you to the formula we came up with:
speX = (11 * K-BB% + 165 * (10 – pCRA) + 7 * CSW + O-Swing + Zone%) * 0.049
It basically weights and scales the composing factors into a 1-100 range, so we can rank the players in a way where the higher their speX, the bigger the possibility to have a better SIERA the following period of time.
Each term of the formula corresponds to one of the composing stats multiplied by a weighting/scaling factor which levels the contribution from every one of them so they impact in a similar manner the overall formula.
Multiplying each component (K-BB% by 11, for example) has the function of properly adjusting the terms so they produce a balanced influence in the result, so no term is overweighted and skews the outcome. Let’s say that if there is a pitcher that gets his results more through command and/or control, then the discipline terms, O-Swing% and Zone%, will be able to provide enough influence to overcome any lacking on the other terms.
Putting the formula in practice, when testing for correlation between speX and the following year’s SIERA, we got the following result (2018 vs 2019, min. 75 IP each year, n=121):
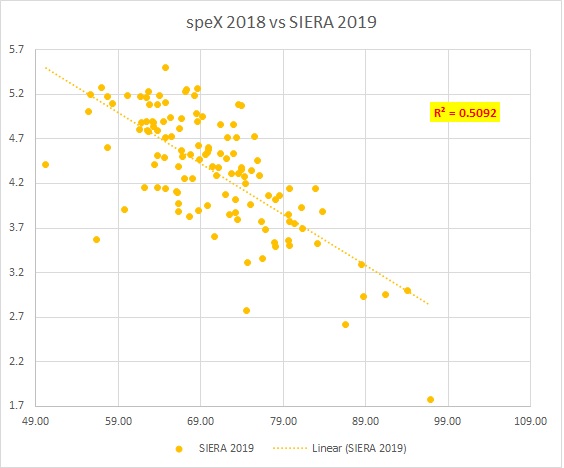
We can immediately get two things from the graph and R2 calculation:
- speX has a better correlation to the following year’s SIERA than any of its parts by themselves, its R2 of 0.5092 means that speX could explain a little more than 71% of it.
- The difference is not that big with pCRA and K-BB%.
Both statements are very important; number one confirms the usefulness of the stat, and number two makes us look for the appropriate context to use it: why would we need to calculate speX when pCRA and K-BB% do a similar job, in terms of correlation? To answer this, let’s talk about rankings and tiers.
The whole purpose of having better info is to apply it to get an edge in our fantasy endeavors. One of the most time-consuming, subjective, and overall hard-to-do things is to appropriately rank pitchers getting into the draft season so we can create our overall strategy, so anything we can do to ease this task will always be welcomed.
With that in mind, I tested for how well could speX work to produce rankings vs K-BB% and pCRA. First, I ranked the top 120 pitchers that had at least 75 IP in 2018 and 2019 by their speX, K-BB%, and pCRA:
Under this way of organizing our lists, we can retest for correlation:
| Metric | R2 | Corr |
|---|---|---|
| CSW | 0.3312 | 58% |
| pCRA | 0.4284 | 65% |
| K-BB% | 0.4289 | 65% |
| speX | 0.4425 | 67% |
We still get an edge from speX here; those edges are usually, for any type of competitive fantasy baseball player, the defining difference between a middle-of-the-table finish or a championship.
Going Beyond
I wanted to be very thorough with speX, so with a lot of help from our resident data graphics wizard Nick Koullaf, we took the testing further. It’s a little bit mathy but the conclusions are aligned with what was found before: the (properly weighted) sum is better than its parts, or in other words, speX provides a better estimation than its isolated components.
For those of you interested in the analysis, as we are evaluating the fit of a model for normal regression examination, Nick looked at the Adjusted R2 (coefficient of determination) and the RMSE (root-mean-square error) for speX and for its individual components and graphed its relationship, which we can see in the following pic:
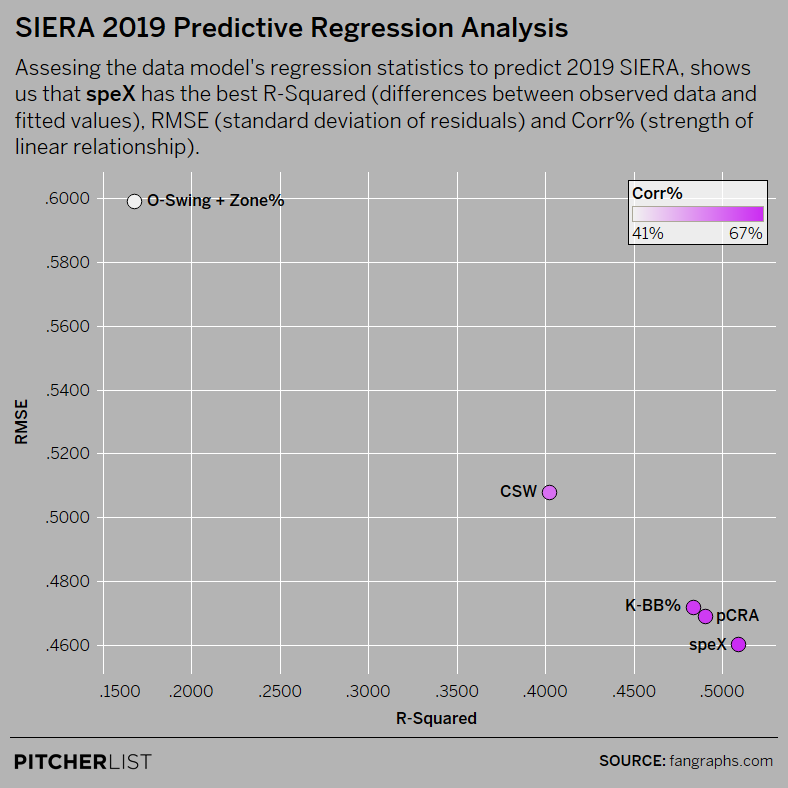
Data Visualization by @Kollauf on Twitter
The more you get to the bottom right portion of the graph, the better. Also, Corr% (R or Pearson correlation coefficient) is showed in a purple gradient color scale, being darker purple a better correlation. In both ways, speX has an edge, again.
By the way, I have to insist because it’s important: even when speX might have some advantage, the other stats, specially CSW, pCRA, and K%-BB% are rock solid and offer an excellent high floor for our analysis.
Estimating 2021
The 2021 season is one of the hardest seasons to predict; to tackle this I have calculated two different leaderboards, one using the 2020 data and another putting together 2019 and 2020, leaning myself more on the latter but you can use them as you wish. This is the 2020 top 20 pitchers by speX (30 IP min.):
| Rank | Name | spex | IP | pCRA | K-BB% | CSW% | O-Swing + Zone% |
|---|---|---|---|---|---|---|---|
| 1 | Shane Bieber | 94.04 | 77.1 | 2.58 | 34.01 | 35.7 | 71 |
| 2 | Jacob deGrom | 90.18 | 68 | 2.96 | 32.09 | 35.42 | 78.4 |
| 3 | Trevor Bauer | 87.83 | 73 | 2.88 | 29.5 | 31.59 | 71.5 |
| 4 | Tyler Glasnow | 86.59 | 57.1 | 3.07 | 28.99 | 32.99 | 74.6 |
| 5 | Kenta Maeda | 86.59 | 66.2 | 3.1 | 28.23 | 33.98 | 79.9 |
| 6 | Dinelson Lamet | 86.1 | 69 | 3.11 | 27.34 | 34.61 | 77.2 |
| 7 | Yu Darvish | 85.76 | 76 | 3.15 | 26.26 | 35.56 | 81.9 |
| 8 | Mike Mayers | 85.6 | 30 | 3.11 | 28.1 | 33.2 | 69.4 |
| 9 | Corbin Burnes | 84.39 | 59.2 | 3.1 | 26.67 | 31.78 | 68.7 |
| 10 | Aaron Nola | 84.26 | 71.1 | 3.12 | 24.57 | 34.15 | 75 |
| 11 | Gerrit Cole | 83.39 | 73 | 3.36 | 26.74 | 33.25 | 79 |
| 12 | Kevin Gausman | 83.31 | 59.2 | 3.27 | 25.71 | 32.72 | 77.5 |
| 13 | Lucas Giolito | 83.19 | 72.1 | 3.17 | 23.96 | 33.03 | 75.3 |
| 14 | Joe Musgrove | 82.64 | 39.2 | 3.27 | 23.49 | 34.62 | 75.4 |
| 15 | Brent Suter | 82.53 | 31.2 | 3.28 | 25.58 | 31.4 | 74 |
| 16 | Brandon Woodruff | 82.01 | 73.2 | 3.31 | 24.91 | 31.38 | 75.3 |
| 17 | Luis Castillo | 81.03 | 70 | 3.23 | 22.26 | 30.88 | 75.5 |
| 18 | Clayton Kershaw | 80.99 | 58.1 | 3.49 | 24.43 | 32.88 | 80.2 |
| 19 | Triston McKenzie | 80.07 | 33.1 | 3.59 | 25.98 | 30.73 | 74.8 |
| 20 | Scott Barlow | 79.92 | 30 | 3.55 | 22.4 | 35.11 | 74.4 |
Names of interest: Glasnow, Burnes, Gausman, Musgrove and McKenzie.
And here you will find the 2019-2020 leaderboard (min. 105 IP):
| Rank | Name | spex | IP | pCRA | K-BB% | csw | O-Swing + Zone% |
|---|---|---|---|---|---|---|---|
| 1 | Gerrit Cole | 90.81 | 285.1 | 2.85 | 32.13 | 34.36 | 79.6 |
| 2 | Jacob deGrom | 87.43 | 272 | 2.92 | 27.61 | 33.3 | 78.55 |
| 3 | Shane Bieber | 86.7 | 291.2 | 3.02 | 27.6 | 34.46 | 73 |
| 4 | Max Scherzer | 85.53 | 239.2 | 3.14 | 27.94 | 32.67 | 78.5 |
| 5 | Yu Darvish | 83.29 | 254.2 | 3.26 | 24.32 | 34.21 | 80.1 |
| 6 | Seth Lugo | 82.58 | 116.2 | 3.31 | 25.32 | 32.5 | 74.85 |
| 7 | Brandon Woodruff | 81.78 | 194.4 | 3.21 | 23.66 | 30.14 | 76.6 |
| 8 | Lucas Giolito | 81.51 | 248.3 | 3.39 | 24.07 | 32.9 | 77.2 |
| 9 | Walker Buehler | 81.17 | 218.3 | 3.34 | 23.64 | 31.36 | 77.55 |
| 10 | Kenta Maeda | 81.08 | 219.4 | 3.3 | 21.44 | 33.73 | 77.35 |
| 11 | Blake Snell | 80.92 | 157 | 3.36 | 23.45 | 32.09 | 73.85 |
| 12 | Mike Clevinger | 80.4 | 167.2 | 3.45 | 23.9 | 32.22 | 72.15 |
| 13 | Charlie Morton | 79.32 | 232.2 | 3.46 | 22.4 | 30.57 | 79.9 |
| 14 | Jack Flaherty | 79.07 | 236.2 | 3.5 | 21.97 | 32.5 | 72.4 |
| 15 | Trevor Bauer | 78.97 | 286 | 3.41 | 21.28 | 31.32 | 71.5 |
| 16 | Luis Castillo | 78.87 | 260.2 | 3.33 | 19.76 | 31.27 | 72.7 |
| 17 | Clayton Kershaw | 78.64 | 236.2 | 3.55 | 21.79 | 31.67 | 79 |
| 18 | Aaron Nola | 78.26 | 273.2 | 3.45 | 19.02 | 33.38 | 74.2 |
| 19 | Lance Lynn | 77.45 | 292.1 | 3.46 | 20.59 | 28.75 | 74.55 |
| 20 | Kevin Gausman | 77.4 | 161.3 | 3.6 | 20.4 | 31.71 | 77.75 |
Names of interest: Scherzer, Woodruff, Snell, Morton, Nola, Gausman.
You can check the complete lists in this Google Sheet, available in 2020 and 2019-2020 seasons.
The consensus top three SPs keep popping here too; no doubt about the quality and top performance from Cole, deGrom, and Bieber. More interesting would be the case of Trevor Bauer dropping all the way to the 15th spot among available pitchers, considering that he’s been picked 15 overall (NFBC Draft Champions ADP, from 03/01 to 03/22) and the fourth pitcher from the board.
Another interesting situation happens with Kevin Gausman, who makes the top 20 by speX but has been targeted with an ADP of 123, being the 49th pitcher taken off the board. If speX gets it right even with a 50% variance for the worse, that would still mean that we could pick a top-30 pitcher in Gausman at a huge discount, and that’s the value we are aiming for.
Another example, Blake Snell, has been going as the 15th pitcher in DC but we could expect a borderline top-10 performance from him, and so on; we can find multiple other similar situations going through the complete list.
In the end, we need multiple info sources to be able to make educated enough analysis on the estimated performances, having another good stat in your toolbox will always help, that’s what’s ultimately desired and hopefully, speX can be useful in that regard.
This kind of info helps us reorganize and recalibrate our expectations while looking for the different ways to maximize what we get from our picks, that’s ultimately the idea behind using speX.
The use of well-tested stats like K-BB%, CSW%, pCRA, O-Swing%, and Zone% has proven extremely worthy for all kinds of fantasy analyses and players, so we are stepping onto solid ground by delving into them. The intention behind speX is to try to minimize the subjective nuances that are embedded in any kind of analysis and fortify, while simplifying, the application of said stats in a trustful and reliable way; that’s something that I believe speX will do for you.
Photo by Larry Radloff/Icon Sportswire | Adapted by Justin Redler (@reldernitsuj on Twitter)
SIERA is essentially k-bb% x GB%. You’ll probably get a better R2 using those two last year values and next year’s SIERA. Or just last years SIERA. Did you compare to that?
Those stats you used are all correlated with each other. I’m surprised the regression worked at all tbh.
Hi, Justin! Thanks for reaching out. As per your question, we tested for SIERA 2018 vs 2019 and R2 was 0.483, slightly lower than for speX (sorry, can’t find a way to add an image, sorry).
It might be surprising how do all the stats make the regression work, but fortunately, they do!
Wow! A month later and this speX has proven to be incredibly predictive of pitching success this season. Bravo! I hope you can see your way to providing in-season data on pitchers using this incredibly predictive formula. Oracular, to say the least!
Hi, Jelani! I’m so happy that you are finding it helpful, that’s all we were looking for!
I’m now keeping a leaderboard for the 2021 season, trying to update it frequently! Here is the link:
https://bit.ly/speX-and-Q-Leaderboard
There is also a Q leaderboard, which is another metric we developed, you can read about it here:
https://pitcherlist.com/introducing-q-and-the-case-for-a-2021-matt-olson-breakout/
Thanks for the super kind words!
Best regards,
Carlos.
Carlos,
Checking in. Two months in and the leaderboards continue to be awesome resources. The adds, trades and drops I’ve made in light of this info have materially improved my team. Thank you again for developing and sharing these tools!
This is fantastic to read, Jelani! It makes all us so happy to know that the things we do are helpful for you, guys! I hope it keeps being like that for the rest of the season!
Once again, thanks for letting us know about this!
Best regards,
Carlos