


We know that CSW rate (called strikes plus whiffs) is both more strongly predictive and correlates to strikeout rate and SIERA more than other pitch metrics. Based on that research from Alex Fast, we also know that a pitcher’s CSW rate takes around ten starts before it starts to stabilize or become predictive toward a pitcher’s end-of-year CSW%.
I’ve used CSW rate to take a look at pitch mixes to see if there is room for a change in usage rates to get more strikeouts and fewer balls in play. For example, Codi Heuer’s elite slider might be used even more, with a 47.1% CSW while being thrown only 22% of the time. But at what point can we “trust” an individual pitch’s CSW rate?
Purpose
To get a full sense of a pitcher’s strikeout and SIERA potential, their overall CSW rate is an incredible metric. However, digging deeper into individual pitches may provide a look at “pre-breakout” data. If a pitcher has an elite pitch but isn’t throwing it often, perhaps a pitch mix change would be an effective adjustment. Likewise, every spring training there are reports of a new pitch that a particular hurler has worked on in the offseason. Knowing how quickly to “trust” CSW% provides a potential opportunity to assess that pitch’s effectiveness along with the rest of the arsenal.
Freddy Peralta added a slider to his repertoire in the winter of 2020. Prior to that, he had not thrown a single slider in over 150 MLB career innings. That first season with a slider he used the pitch to great effect, with a 35% CSW while only throwing the pitch 7.8% of the time. This season in 2021, he has upped that usage to a third of his total pitches and has retained the elite CSW rate on the pitch. The result? A nearly 40% strikeout rate to go along with a 2.40 ERA (2.71 FIP) and 0.89 WHIP.
Of course, that’s just one example, but knowing Peralta’s slider CSW% and monitoring its usage would have been a clue for a breakout season. Knowing when to trust that CSW, however, is the key.
Methodology
In order to determine when individual pitch CSW becomes “reliable,” Pitcher List data scientist Justin Filteau and I looked at each pitcher in MLB in 2019 (the last season for which we have a full, regular season’s worth of data), and determined their CSW% for each pitch in increments of ten, then compared them to each pitch’s end-of-season CSW rate. We (well, Justin) then used the Cronbach’s alpha method to determine reliability, as described in this article on pitcher streaming reliability:
Cronbach’s alpha, also known as tau-equivalent reliability, essentially tells us how closely related a set of items are as a group. In our case, we’re going to be looking at the ratio of an observed stat and the true talent of a team. The closer the alpha is to one, the more reliable the observed stat becomes, and that happens as the sample size grows.
Justin referenced the brilliant work done back in 2015 by Jonah Pernstein and Sean Dolinar on Fangraphs regarding not just Cronbach alpha, but also reliability and confidence bands that tell us how quickly the alpha approaches one.
Essentially, this will tell us at what point in the season certain stats stabilize.
Findings
Different pitch types do in fact have severely different points at which they start to become predictive of season-ending CSW rate.
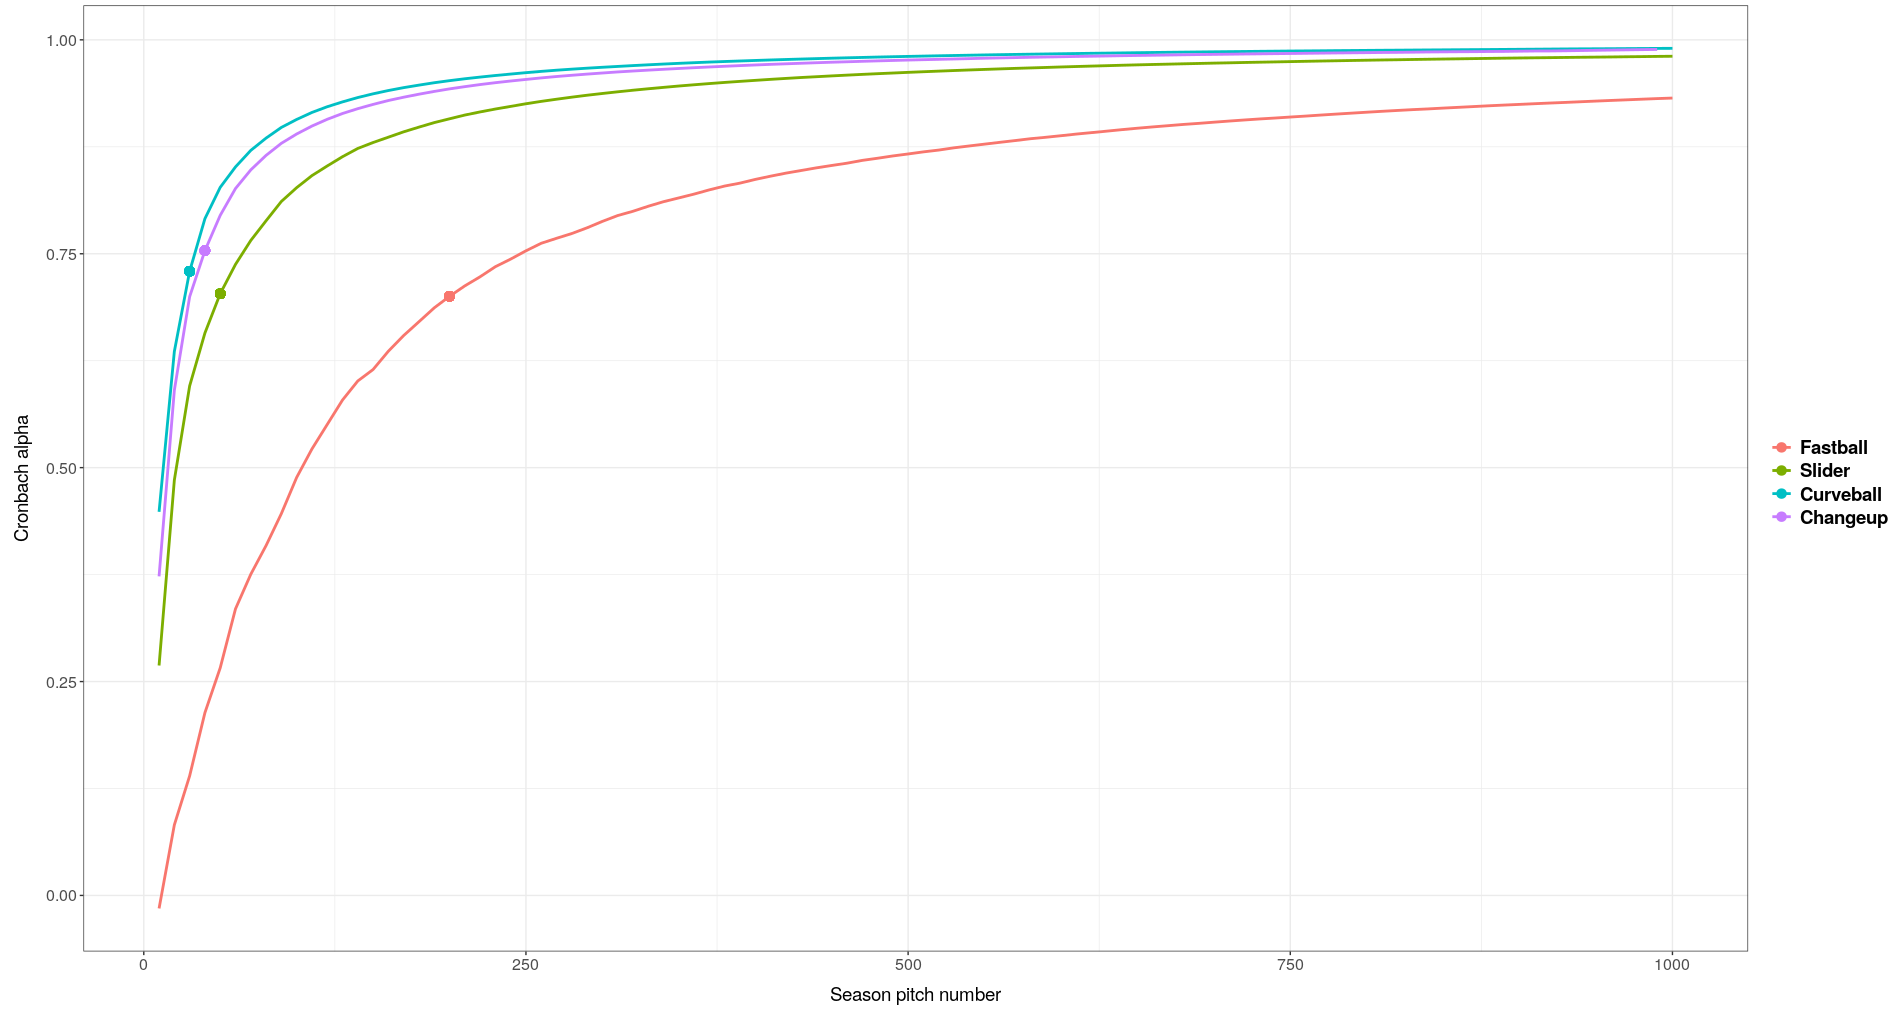
Fastballs are the red line in the graph, and represent a pretty strong outlier, needing four times as many samples to become predictive than the next-quickest, sliders. Here is that data in table form:
| Pitch Type | Number of pitches thrown |
| Fastball | 200 |
| Slider | 50 |
| Changeup | 40 |
| Curveball | 30 |
So, based on the 2019 MLB season, we can say that after a pitcher has thrown 30 curveballs, it’s indicative of what his season-ending curveball CSW rate will be.
However, there’s a wrinkle to all this that Justin found. These numbers are drastically different for starters and relievers. Here are the stabilization points when broken out between roles on the pitching staff.
| Pitch Type | No. of pitches thrown- Starters | No. of pitches thrown- Relievers |
| Fastball | 700 | 200 |
| Slider | 125 | 50 |
| Changeup | 125 | 50 |
| Curveball | 175 | 25 |
It’s not immediately clear why starters require a much larger sample before their season-ending CSW rate becomes predictive. One hypothesis is that because starters typically have more pitches to mix into their repertoire, it introduces another variable that makes any one pitch more difficult to stabilize. The fastball playing off three other pitches, for instance, may lead itself to more “noise” in the sample with hitters being fooled more often looking for other pitches. Relievers, on the other hand, are more likely to just have one or two pitches they’re throwing the majority of the time, so a pitch’s “true” ability to generate whiffs or called strikes may stabilize more quickly.
Identifying the Potential Breakouts
Codi Heuer’s slider still sits close to the top of the CSW leaderboard for the pitch, despite throwing it less than a quarter of the time. Looking at the qualifying number of pitches, a couple of other pitchers stand out in terms of how often they’re throwing their elite offerings.
Garrett Cleavinger, RP, Los Angeles Dodgers
Garrett Cleavinger has thrown a four-seamer 60% of the time so far in 2021. Unfortunately, it’s been hit for an expected slugging percentage of .829.
His curveball, on the other hand, he throws just 21% of the time despite a CSW rate of 46.4% (28 times thrown in 2021). Cleavinger has less than 7 MLB innings to his name, but even more encouraging is that his slider is just as elite by CSW in 2021– though, that’s cheating a bit as he has not thrown enough sliders to meet our criteria here. Based on the curve alone, you might expect him to take a step forward if he ditches the four-seamer more often, but the slider is also worth keeping an eye on as he gets more repetitions throwing it.
Alas, Cleavinger was placed on the IL with “left forearm tightness” earlier this month. Hopefully, the arm issues weren’t preventing him from throwing those breaking pitches as often, and he can get back to full health soon.
Ryne Stanek, RP, Houston Astros
Stanek joins the Houston bullpen this season after a 7.20 ERA in Miami last year in just 10 innings pitched. He already has a save to his name this season, so while he’s not exactly sneaking up on anyone, he has an elite slider (42.4% CSW) that he’s thrown just 13% of the time in 2021. His two previous best seasons were also the years where he threw his slider the most. The slider has decreased mostly at the expense of his four-seamer, which the Astros may like for its high spin rate and movement, but the results haven’t matched up.
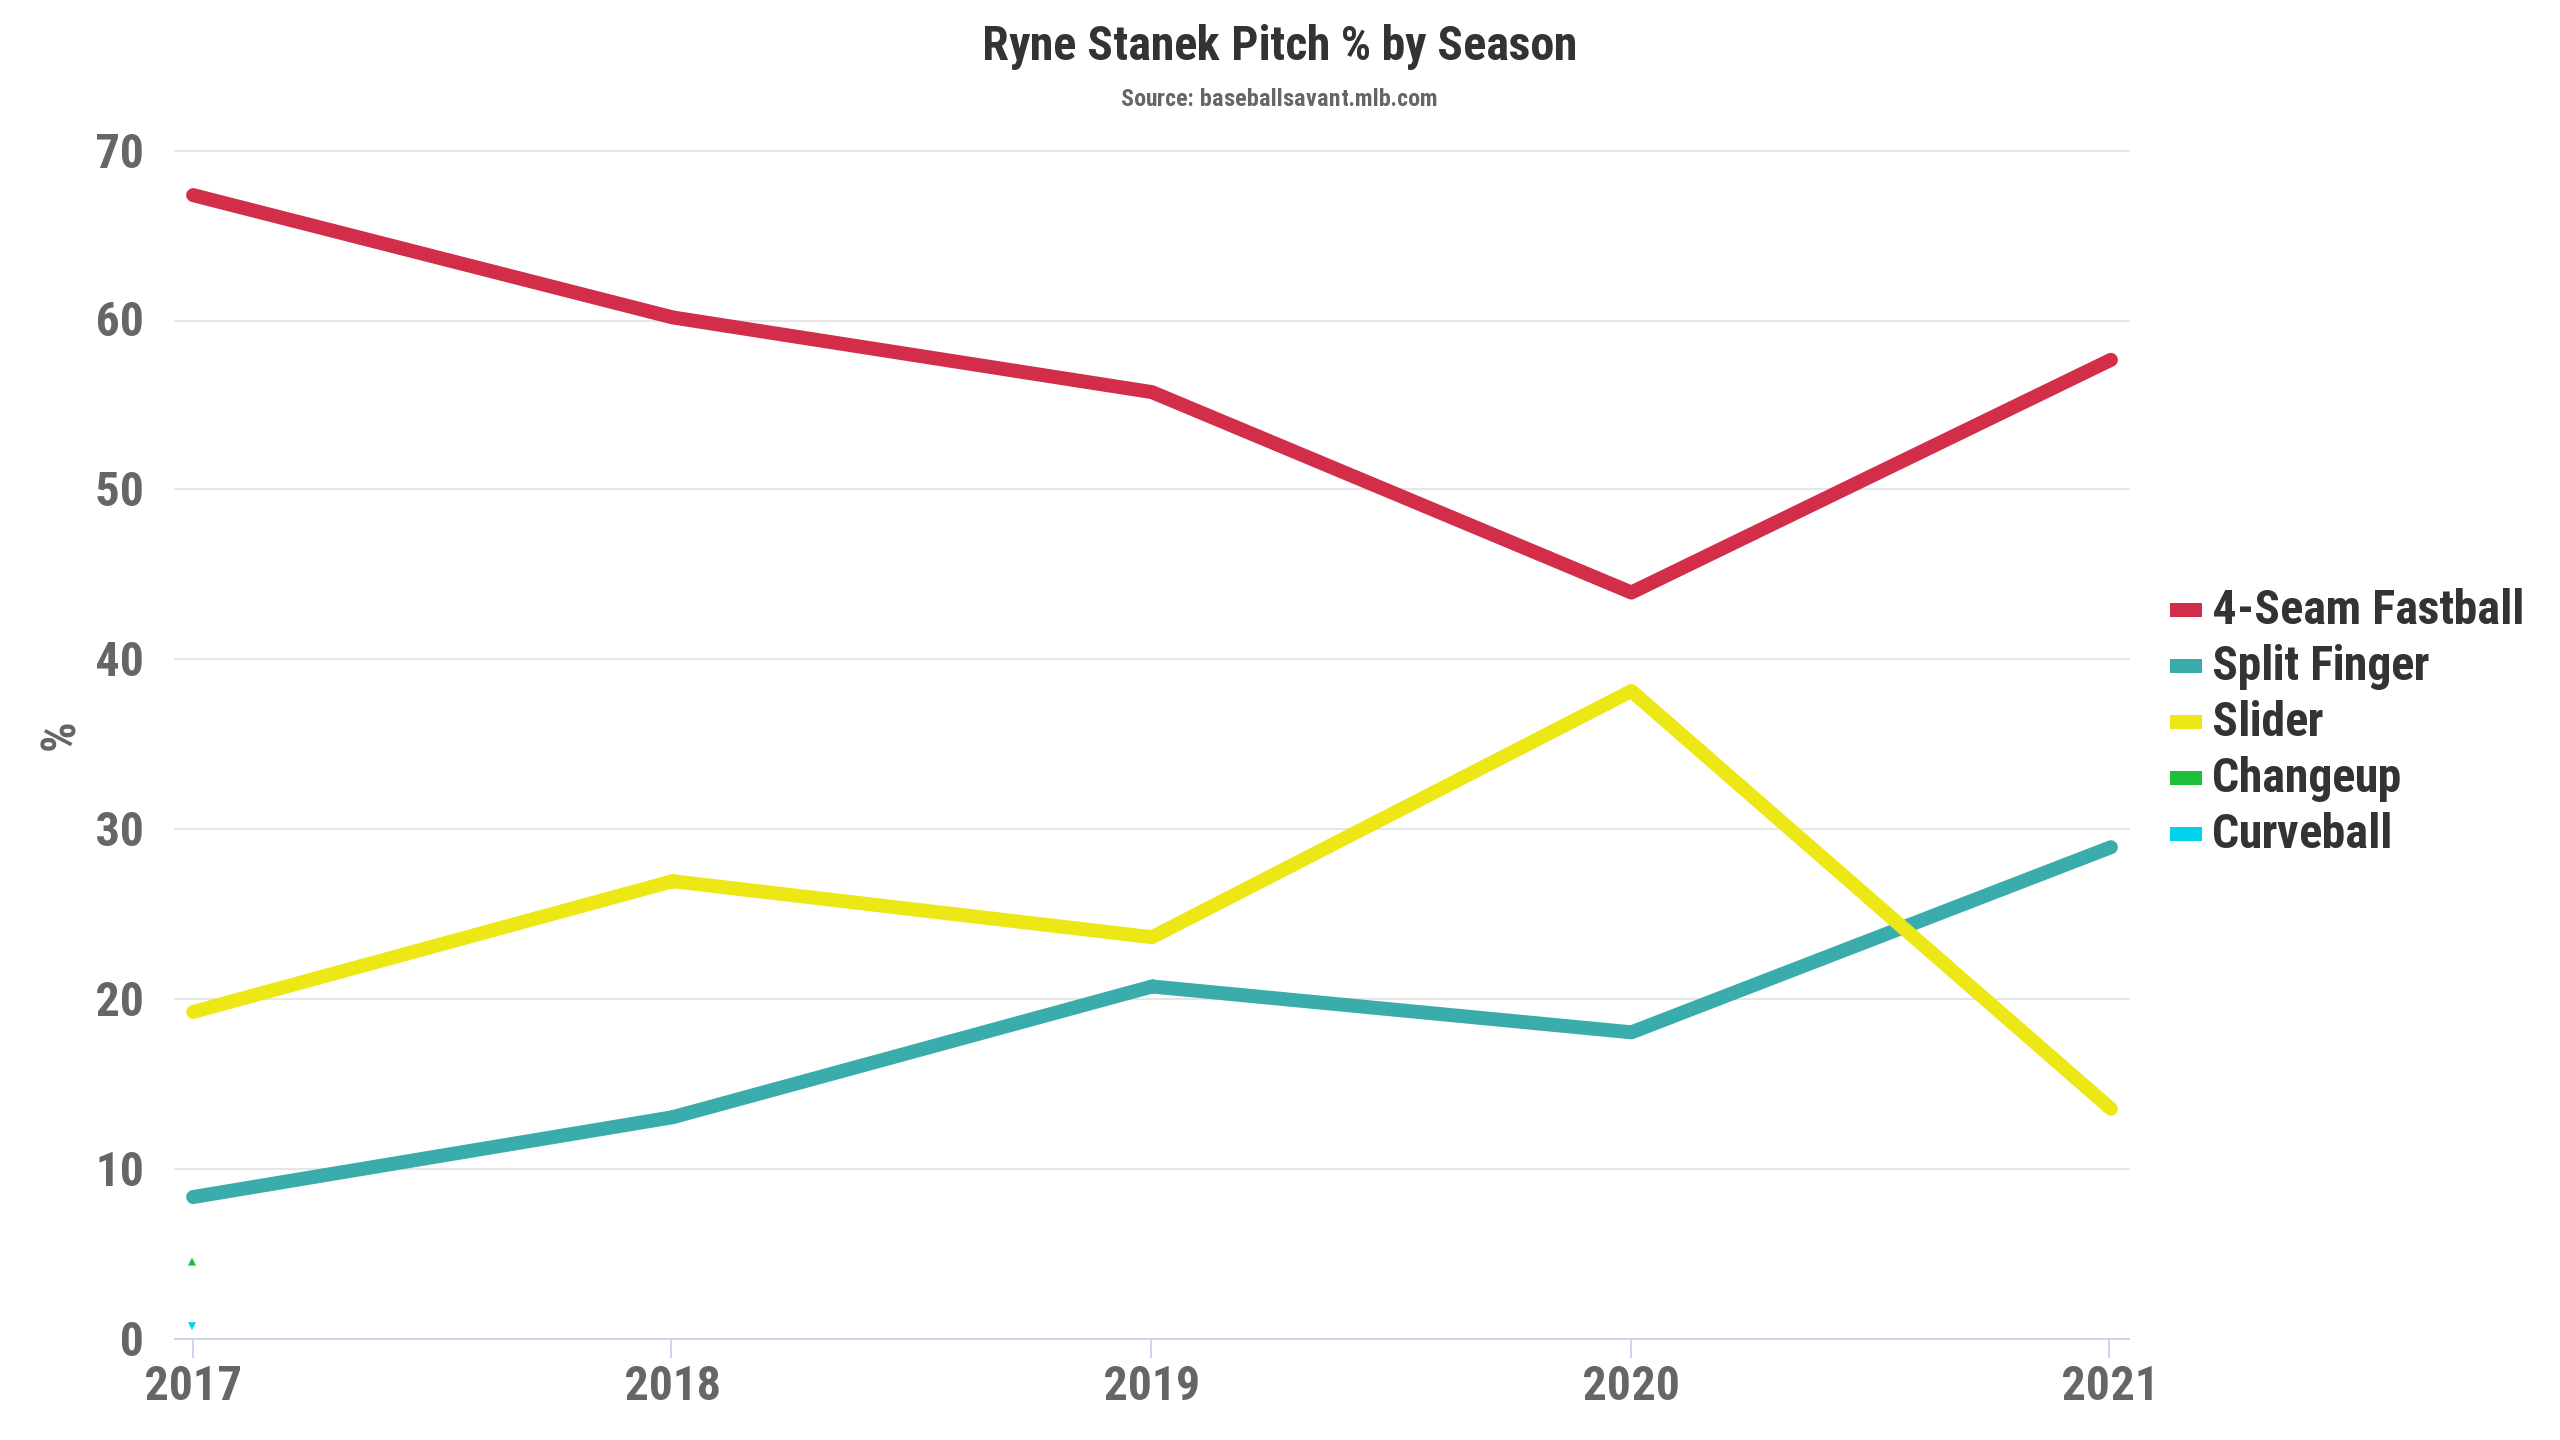
If Stanek gets to the point where the slider retains its effectiveness with increased usage, he could take a step forward as an elite reliever based on the early returns of the pitch.
Conclusion
An individual pitch’s ability to miss bats and catch batters looking varies greatly depending on both the pitch type and pitcher’s role. Used correctly, pitch CSW% can be used to identify elite pitches and potentially, breakouts with increased usage of that pitch.
Looking for individual pitches based on their stabilization points while filtering for lower usage is one strategy to identify such breakouts. When pitchers add a new pitch in the offseason, monitoring its early usage and results in as little as a few games may give clues as to what’s to come in the season and years ahead.
Further study in the differences between relievers and starters may provide more data to more effectively analyze pitch mix effects. Other pitch types (e.g., splitters, cutters), while not as common as those presented in this study, can also provide fertile ground for future analysis, as well as pitch characteristics (e.g., shape and movement of sliders’ impacts on CSW).
CSW rate provides one tool for predicting such pitch breakouts, but other metrics such as called strike percentage and swinging strike percentage may stabilize more quickly for individual pitch types, such as a slow curveball that is used as a change of pace pitch and generates mostly called strikes. These factors have not been included in this study but may be worthy of further research.
Photo by Dan Sanger/Icon Sportswire | Feature Image by Justin Redler (@reldernitsuj on Twitter)
Anywhere to find this stat in a sortable data list anywhere?