


(Photo by Lawrence Iles/Icon Sportswire)
INTRODUCTION
This week, I’d like to take a look at relief pitchers, and what can be gleaned from their Plate Discipline metrics. Previously my analysis was limited to starters, but having put some thought into this the past couple of weeks, it really should apply to relievers even more so. To explain my line of thought:
1) Relief pitchers in today’s MLB rely even more on strikeouts than starters do. These guys are pitching in the highest-leverage situations, so they don’t want to let their fate be decided by BABIP. A strikeout is the most surefire way to get an out. Following this principle, one of the noticeable current trends in MLB is to assemble a dominant bullpen capable of putting up massive strikeout numbers. Teams like the Yankees and Astros are great examples of this approach, and how successful it has been. Plate discipline metrics are focused mainly on predicting strikeout rates, so it seems like a perfect fit.
2) Relief pitching is no different from starting in terms of what the pitcher is trying to do – avoid contact. Probably even more so, as starters are more likely to pitch to contact, trying to keep their pitch counts down to stay in the game longer. But relief pitching is subject to the same luck factors – umpires and foul balls. So the rules we established earlier should hold true, and the same basic logic can be applied. But relievers are also much more fickle than starters. They can come out of nowhere to succeed, or disappear just as easily. As a result, sometimes there can be a huge focus from the fantasy community on a player’s tiny sample of data, with everyone trying to find the next diamond in the rough. Savvy fantasy owners are likely to be including strikeout rates in their analysis, (via FIP), but now we can go beyond that. Plate discipline metrics are the best thing we’ve got for small samples, and the idea of over-performing or under-performing ones K% is magnified even further by the spotlight of the closer role.
RANKINGS
To get things started, I thought it might be interesting to calculate the “PD Scores” using the exact same formula applied to starting pitchers previously. This should give us a rough sense of which relievers are pitching the best – but also it should show just how dominant relief pitchers are, relative to starters. I also included the predicted K% vs. actual K% here, since I had all the data in the same table and it was easy. For the “difference” column, positive numbers are good. Negative numbers indicate that a player has over-performed their metrics, and their strikeout rate should fall.
Here are the results (all qualified RP through May 1)
|
It’s a lot of data but you really don’t need to read it all. I included the whole table so you can Control-F the players you are interested in.
As you can see, the scores are very high overall compared to starters. Remember, a starter with a score of 100 for a full season is typically in Cy-Young-winning territory. There are currently thirty-three relievers with a score over 100 in the early goings. This confirms what we knew already – relievers are more dominant than starters. This makes sense, as relievers can max out their effort when it’s focused on just 1 inning rather than spread out over the course of a start. This is already a well-understood phenomenon, but it’s nice to see it confirmed in the data like this. Due to this, I have adjusted the grading scheme accordingly. Relievers need to hit a score of 110 to receive the “A-plus” grade compared to 100 for starters. The average score for all relievers is about 84, so that equaling a C grade rather than B seems about right.
The other thing I tried to show in the chart is who the current closers are. When it comes to analyzing relief pitchers for fantasy, the role is very important. That part of the equation is not really the focus of this piece, but I tried to make the data slightly more useful by underlining the current closer for each team, as identified by Closer Monkey as of May 2. The closers who are currently identified as being part of a “closer by committee” are marked with an asterisk*.
Let’s take a deeper look at some of the standouts, surprises, and newer closers filling in for injuries:
PLAYER UPDATES
Josh Hader (RP, Milwaukee Brewers)
Very effective in a setup role last year, Hader took over as closer when Knebel was injured early on. So far he has managed to improve on last year’s success, putting up some truly eye-popping numbers in the early goings. After 18 innings, he’s sitting on an absolutely absurd K-rate of 62.9%. Of course, we should not expect that to continue, and you probably didn’t need any metrics to know that. His metrics are in fact incredibly good; he’s currently rated as the 4th best reliever in MLB. But he’s still not THAT good, probably no one is. That 20 percent discrepancy between predicted K% and actual K% is the largest in MLB. This is basically what it looks like when a player is very good AND very lucky over a short time.
Hader gets it done with the fastball/slider combination commonly seen in relievers. Last year he mixed in a changeup occasionally, but seems to have abandoned it in favor of the slider this year. His slider has an amazing 40% contact rate, and this year he’s tripled its usage from just 10% to 30%. This is not the last time I’ll mention this trend. Since most relievers are two-pitch guys, mixing in the secondary pitch often enough to prevent hitters from sitting on the fastball is a key to success. Hader was successful in 2017 with an 80% fastball rate, but the new approach seems more sustainable, and likely a huge part of his improved numbers. Unfortunately for Hader owners, Knebel looks like he’s coming back soon, so you can probably say goodbye to the saves. That’s a bummer. He’s looking like one of the most elite setup arms though.
Blake Treinen (RP, Oakland Athletics)
A sleeper pick heading into 2017, things didn’t work out for him in Washington. He seemed to have re-discovered himself in Oakland though, improving his numbers after the mid-season trade. This year, he has really taken things to the next level. His Contact% and SwStr% are both trending the right way significantly, and he has noticeably under-performed his K%, suggesting more strikeout upside. But the most eye-popping number is his O-Swing%, which currently sits at 52%, tops among MLB relievers by 7 points, and a big part of his #1 overall ranking.
How is he doing it? Treinen is another two-pitch guy; he’s got a sinker and a slider. This year he’s throwing his slider a career-high 35 percent of the time. His slider has a 30% whiff rate and 50% contact rate, so this seems like a great strategy. Again, here is a guy following the trend, and for good reason as it seems to be incredibly effective.
Edwin Diaz (RP, Seattle Mariners)
Diaz took a step backwards in 2017 in many ways after his dominant 2016 rookie season. This downturn was also apparent in his PD metrics, with his 8-point drop in K% fully supported by the metrics. This year though, he’s mostly reversed those bad trends. SwStr% and Contact% both support a K% over forty…although not quite his current rate of 48%. Like Hader, he has been lucky AND good so far, but not nearly so lucky as Hader. As the #2 overall reliever in MLB so far, and no questions into his role, this is looking like a very solid pick. Nice job, Diaz drafters.
Diaz also throws a fastball and slider. Like Treinen, his slider is an incredible weapon, with similarly ridiculous whiff and contact rates. Since he’s been very successful this year, I’m going to guess…he’s throwing more of them? Checks Fangraphs…well, look at that. Who would have guessed? Diaz’s slider usage is up to a career high 38%.
Kenley Jansen (RP, Los Angeles Dodgers)
One of the best in the game, Jansen has struggled in the early goings. He currently sits on an ERA around five, after ten innings of work. His strikeout rate is way down to 25% compared to his career mark near 40%. And there’s no denying his metrics are down as well. His O-Swing% is down by ten points from last year, which is quite a lot. SwStr% and Contact% are trending the wrong way as well, indicating a K% near thirty. That’s five points above his actual mark, so he may have been getting a little bit of bad luck to exacerbate matters. But for the most part, the decline is supported. However, I am not worried about Jansen. In one chart here is why:
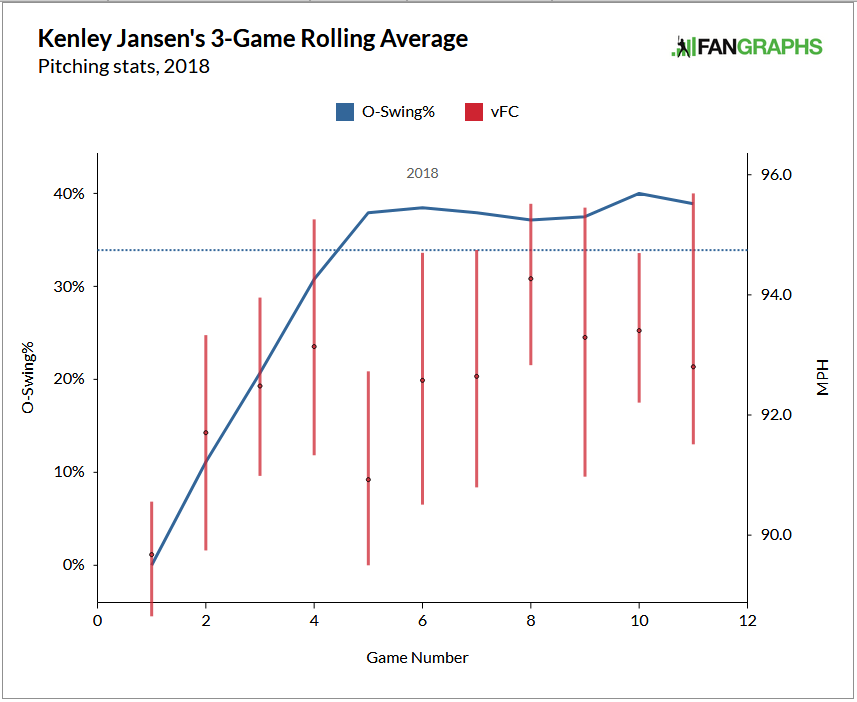
The red is his cutter velocity, and the blue is his O-Swing%. As you can see, his velocity was down at the beginning of the season, and with it his O-Swing%. However by about halfway through April, his velocity had recovered, and with it, his O-Swing% returned to elite levels. SwStr% and Contact% also show similar patterns. He should be just fine going forward.
You probably know this already, but Jansen is fairly unique in that he predominantly a one-pitch guy. Like Mariano Rivera (almost), he rides his dominant cutter to success, throwing it about 90% of the time. The other 10% is composed of sliders. I would say he should throw more sliders, but if no one can really touch the cutter even when they expect it, it doesn’t really matter. Keep doing what you do, Jansen.
Hunter Strickland (RP, San Francisco Giants)
How about that Mark Melancon, huh? The term “free agent land mine” comes to mind. When his latest injury reared its head, the Giants turned to Hunter Strickland, and he has performed admirably in the closer role so far (7/9 in saves, ERA/FIP/SIERRA under 3). Strickland is familiar to Giants fans as a generally dependable setup guy the past 3 seasons, with a career ERA of 2.5. He does not grade out well on this list at all, and I think it’s mainly because he pitches to contact at the friendly confines of AT&T park. Given its extreme offense-suppressing abilities, this is not necessarily a bad idea. This theory is supported by his sizable discrepancy over his career in home/road K% splits (he strikes out 5% more batters on the road, and actually has a lower road ERA).
Strickland is another guy who gets it done primarily with the fastball/slider combination. So far, he has resisted the trend and not increased his slider usage at all, throwing it at almost exactly his career rate, near 25%. He’s been experimenting with his changeup this year, but it’s actually faster than his slider by a few ticks, so there’s less separation from the fastball and hence less good. I feel like he really could benefit from following the trends and increasing his slider usage into the mid-30s instead of messing with the changeup. Until then, we’ll have to settle for a decent, if unspectacular, closer. You could do worse. Of the current closers with bad grades, he’s one I’d feel comfortable owning anyway.
Sean Doolittle (RP, Washington Nationals)
The other side to the Blake Treinen trade, it’s pretty remarkable how these two have progressed in almost mirror-like fashion. Just like Treinen, he immediately started pitching much better after being traded mid-season, and then so far in 2018 has taken it to the next level. Unlike Treinen though, he is currently over-performing his metrics a bit. They paint the picture of a 36-39 K% guy, quite a drop from his current rate of 48%. There are also a few more red flags in his profile – .111 BABIP and 96% LOB suggest some regression incoming. But even with regression, he still looks like a top ten closer. A strikeout rate in the upper thirties is still very good, you know.
Doolittle is more of a one-pitch guy, riding his four-seam fastball to success with usage around 87%. I have never watched him pitch, but given that success from just one pitch, I’m guessing he has insanely good command. He’s got a good slider too that had a 20% whiff rate last year, but he’s barely throwing it (4%). It’s kind of scary to imagine him throwing it more, given how good he’s been with just the four-seamer. It does kind of make me wonder, though, if that could take him to another level.
Brad Boxberger (RP, Arizona D-Backs)
A standout for the wrong reasons, Boxberger is the lowest-rated “current closer” on the list. He has seemingly been very fortunate this year to carry a 28% K-rate, while his metrics point towards a much lower rate in the high teens. That would be flat-out terrible for a reliever. He also struggles with walks, as he’s never been a high O-Swing% guy to begin with, and is down from his even his modest career numbers. As such, I really have a hard time believing his pristine-looking ERA and FIP are sustainable at all. He seems to be on shaky ground relying on weak contact, and is one of the closers more likely to lose his job. Boxberger owners are hoping this is just a small-sample blip, as his career metrics are better than he’s done so far this year. It could certainly play out that way, but I’d be a little nervous.
Boxberger is getting it done this year with the good old fastball/changeup combo. In previous years he threw a slider, but has seemingly abandoned it this year in favor of the changeup. His changeup seems fine; I am not going to say he should go back to the slider. But, it could have something to do with his career low whiff rate of just seven percent this year.
Richard Rodriguez (RP, Pittsburgh Pirates)
The highest ranked non-closer on the list, Rodriguez is also the only player in the top 5 whom I had never heard of prior to working on this. He doesn’t even have a player profile on Fangraphs. Last year, his first, he pitched 5 whole innings (badly) so basically he’s a rookie. But this year in nine innings he has been as dominant as anyone in MLB. He’s struck out 15 batters and only walked one, which was intentional, and those numbers are actually in line with the metrics. It really doesn’t get much more dominant than that. Obviously this is a super-small sample, but I think he is intriguing enough to keep an eye on. It’s very impressive that he’s managed to put up an ERA under one, with a BABIP over .400. It goes to show what a 40% K-rate can really do. Currently Rodriguez is not anywhere close to the closer role, but that could change if he keeps pitching like this.
Rodriguez is another two-pitch guy. He relies primarily on a four-seam fastball which he throws up in the zone, supplemented with a breaking pitch he throws about 30% of the time (systems are torn between labeling it a slider or a curveball). Both pitches have been getting great results, with similar SwStr% and Contact%, so his pitch mix seems fine. Batters have been completely unable to handle the fastball so far, putting up an wRC+ of -20 against it. I didn’t even know that was possible.
BONUS – TEAM BULLPEN POWER RANKINGS
I’m not sure how useful this will be for fantasy, but I thought it might be fun to calculate each team’s score as a unit. By this point in the season, most team bullpens have thrown over 100 innings, so it’s not a small sample. This covers the entire teams bullpen’s body of work through May 1:
|
Before I even ran the numbers, I would have picked the Yankees to top the charts. Not that I’m bragging, most people that follow MLB trends would. And indeed, they do have the highest score by far with 97. It shouldn’t come as a surprise that they top the list; they have been at the forefront of the bullpen revolution the last few years, assembling a ridiculous number of high-powered strikeout arms. But I wouldn’t have guessed a 97 score. An entire bullpen pitching near Cy-Young-winner quality innings is crazy. But they are doing it. Of their six qualified relievers, not one of them is average or below. Chapman has been utterly dominant, with Shreve and German not far behind. Betances, Green, and Robertson, possibly closers on other teams, have also been above average. This is simply an excellent unit and deserves every bit of the acclaim.
The Phillies bullpen has been much talked-about this year, thanks to manager Gabe Kapler’s unorthodox methods. But it seems they have found something special in Victor Arano, in addition to Hector Neris, who we already knew was good. I had to mention the Phillies because they are the only team with two relievers currently graded as A-plus. And Luis Garcia looks pretty good too, solidly above average. There is a red flag here in Edubray Ramos. He currently sits on a very pretty 2.8 FIP, but he is overperforming his K% by a significant margin, and his O-Swing% is nowhere near elite either. Something is not adding up, as a D+ grade should not translate to an ERA under one. Crazy things can happen in sample sizes this small. But overall, this unit still looks above average, and especially good at the back end.
Wait, aren’t the Braves rebuilding? Where did this dominant bullpen come from? Well, they actually haven’t been very dominant, with an ERA of 3.9. One thing the PD score can somewhat miss is crazy high walk rates. Walk rates are not very predictable from PD metrics, and only account for roughly a quarter of the PD score. The Braves bullpen has been walking absolutely everyone, leading MLB by a wide margin. However I feel this group is still poised for better times ahead. Five of their six qualified relievers grade out well above average, with B grades or higher. Furthermore, four of those five guys show significant discrepancies indicating more strikeout upside. So even if they keep walking everyone, K to BB ratios should improve going forward.
The Pirates currently have three A-grade relievers, and I’ve never heard of any of them! In addition to Rodriguez, Felipe Vazquez and Edgar Santana have also been throwing very well so far. In hindsight, I really should have heard of Vazquez before now, as he was excellent last year in the closer role. As the return in the Mark Melancon trade, the Pirates have got to feel pretty good about that. There’s one guy in the Pirates pen whose numbers look good but are misleading – Michael Feliz. That K% is a mirage and not to be trusted. After the top three arms there is a sizable drop-off, so overall they grade out as just average. But still, with some work, this could definitely be a strength if the Pirates are ready to contend again any time soon.
Similar to the Yankees, the Astros have spent the past few years assembling a dominant bullpen. And like the Yankees, it’s easy to see in the rankings. The Astros have seven qualified relievers, and only one is below average. Unlike the Yankees though, they haven’t had any truly dominant relievers so far, with not even one cracking a 100 score. Right now it’s looking more like a collection of very good, but not elite, arms. Still, I think most teams would LOVE to have six very good relievers in their pen. And given their history of success, it’s not improbable for a couple of those guys to make their way back to elite territory in short order.
The flip side of the Yankees or Astros, the Giants bullpen has been awful the last couple years. As a Giants fan myself, I thought it might be interesting to check on them, and see how well-founded my nightmares are. Lo and behold…yeah, they are truly bad. The Giants have eight qualified relievers, only one of whom is above pitching above average (Osich), and him just barely. This is mainly a collection of D-grade arms. Maybe, we can give the Giants management some credit for playing to the strengths of their park, rather than blindly following the trends in MLB and chasing strikeouts. And there is no denying they’ve had significant injuries to cope with as well. But for a team trying to contend…it probably wouldn’t hurt to have some strikeout guys in their pen. Road games do happen, from time to time. Last year the Giants bullpen had a home ERA of 3.5, but a road ERA of 5.3. Strickland wasn’t a part of that problem, but everyone else? Yeesh. I don’t think a healthy Melancon and Will Smith are enough to turn this around, but one can hope.
Even worse than the Giants, the Angels bullpen is particularly problematic for fantasy owners. They haven’t had a real closer the past few years, relying on a revolving door of guys. Cam Bedrosian, the currently annointed closer, has an F grade. So it probably shouldn’t be him. All of the other options who have pitched enough innings to qualify, are also below average. Their lone bright spot right now is probably Justin Anderson. He’s only pitched five innings, but if he qualified his score would be 108, 25 points better than the next runner-up (Blake Parker). Yes, five innings is a tiny sample, but what else do we have? If I had to touch the Angels bullpen with a ten-foot-pole, he would be my choice.
Really appreciate your plate discipline series! I have one question about how you arrived at the predicted K%. I am assuming you take the average of 2 times the swstr% and the inverse of the contact% here as well here? If that is the case, how did you arrive at the rules for swstr% and contact%? Did they come from the regression analyses you ran?
Thanks man! Yep, I used the same rules as for starters which were formulated in my first article, based on the regression lines. For Contact% it’s simply taking the inverse, and for SwStr% it’s doubling it plus one. Then I take the average of those two.
Thanks for the reply! Looking forward to your future articles!