


(Photo by Cliff Welch/Icon Sportswire)
This week we return to the topic of starting pitchers. At this point in the season there’s a lot of data to talk about, and to be honest I may have gotten a bit carried away. For easier digestion, I am breaking this post into four sections:
1) Checking in for updates on the guys I covered last time
2) Looking at some newer guys who have emerged recently
3) “Gainers & Losers” analysis of the largest changes in scores over the past two weeks
4) Rankings, grades and K% Over/Under-performers table
1. CHECKING IN
(Previous update can be found here: http://pitcherlist.com/plate-discipline-for-pitchers-update-1/)
Patrick Corbin (SP, Arizona D-Backs)
The top pitcher in my previous ranking, Corbin has now ceded the #1 spot in the rankings to Max Scherzer, by just a hair. The two games he pitched since that update were not nearly as dominant as he was over his first five starts. To be clear, his lines were actually very good from those games, only the metrics have taken a turn for the worse. His competition was a bit tougher, but there are other things going on as well. I think this graph helps explains it:
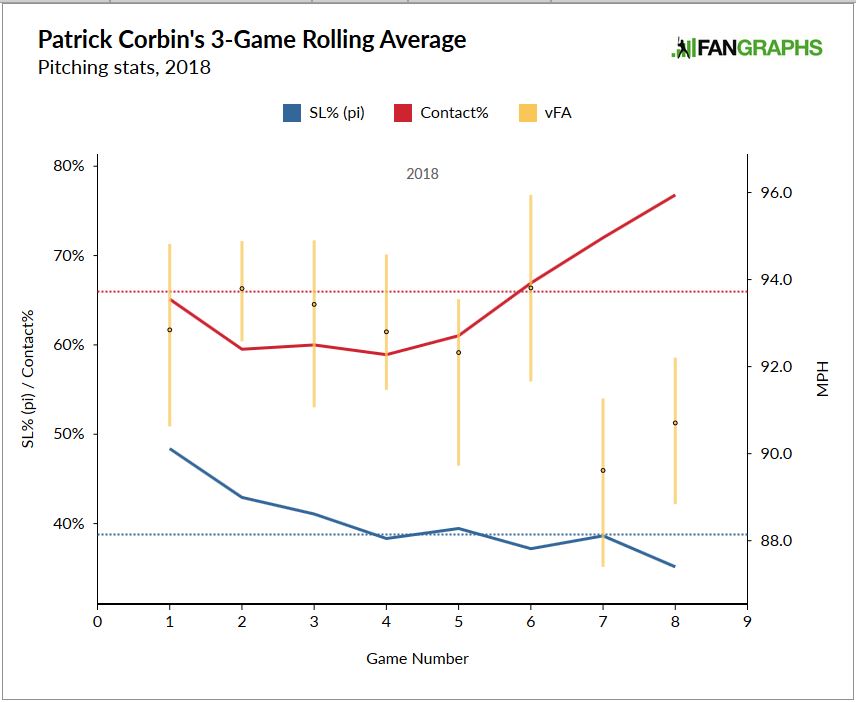
During his first five completely dominant starts, two things were true: he threw his slider around 40% of the time, and his fastball sat around 92-94. The last few games, his metrics are down a bit from the godly tier down to just “pretty good” levels, as you can see with the contact% line. My best guess is that it’s related to the fact that neither of those two statements are true any longer. His velocity has trended downward, and also his slider usage. At this point the velocity is down for two straight games, though it did recover slightly in the second one. His velocity should probably be watched closely going forward, as it could be the difference between an elite pitcher and a pretty good one. 35% sliders is still plenty, so I’m not terribly worried about that, but hopefully it won’t dip much more.
Outside the plate discipline realm, there are also other reasons to consider selling. Corbin may not be benefiting from strikeout luck, but he does show the traditional red flags of low BABIP and high LOB rates (.217 and 90%, respectively).
Dylan Bundy (SP, Baltimore Orioles)
There’s no getting around the fact I took one on the chin here. I rated Bundy a “BUY” previously, and then he proceeded to pitch horribly. In particular his last start was an absolute nightmare of historic proportions, giving up seven runs without recording an out…against the Royals. I had predicted a correction in his HR rate, but not giving up nine homers in nine innings! Now it’s important not to overreact, this is baseball. Anything can happen in one game, good pitchers do have bad games, yaddah yaddah. But let’s see if we can figure out what’s going on here. Bundy doesn’t show a big velocity drop like Corbin, though his fastball is down about 1 MPH his last two starts. That could be a contributing factor, but after looking at all the data, I think pitch selection has more to do with it. Here is a graph that I think does a decent job of explaining things:
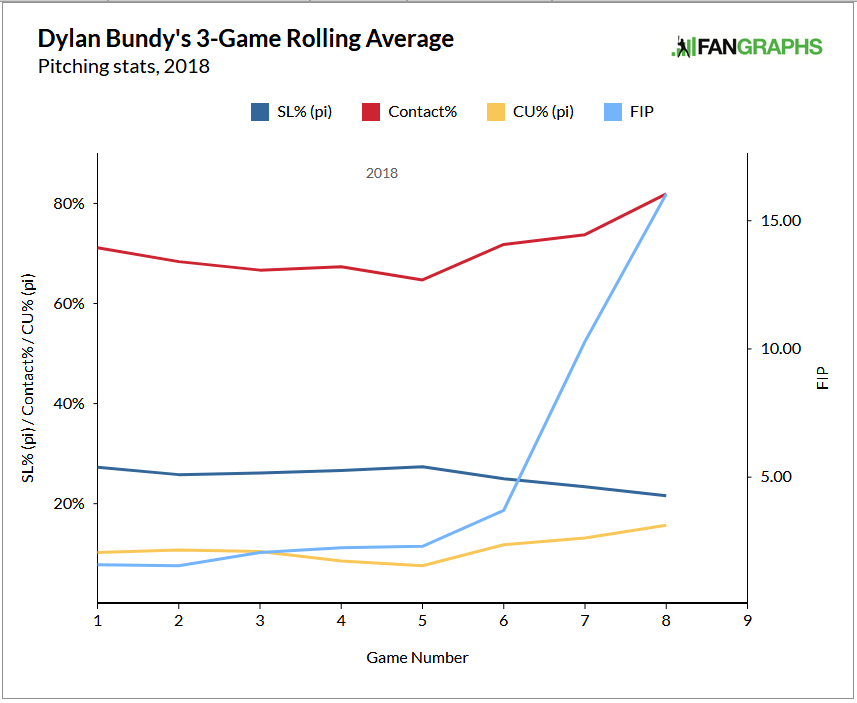
For his first five starts, everything was groovy. But then clearly something was different in the last three starts, with Contact% spiking way up, and with it, his FIP. As you can see towards the bottom of the chart, in the sixth game he started throwing less sliders and more curveballs. On its face this isn’t a huge change, but in Bundy’s case, actually, it is. His slider is among the best in the game, with a 32% whiff rate and opposing hitters only putting up a wRC+ of 22 against it. In comparison, his curveball has just an 8% whiff rate and opposing hitters are walloping it to the tune of a 253 wRC+. With Bundy the key thing to watch going forward is his slider/curveball usage. If he returns to throwing the slider more and cuts back the curveballs, he should be great going forward. And honestly, I’d love to see him increase the slider usage even more into the 30s. It’s getting such great results, why not throw it? It works for Corbin.
It’s pretty remarkable that even with three straight bad games, Bundy still receives an A+ grade with a score of 100. I would absolutely still rate him a “BUY”, the difference being that now you’re buying low instead of high. Go for it! His HR/9 rate now sits way above his career number, it should come back down. My main worry right now would be his self confidence.
Luke Weaver (SP, St. Louis Cardinals)
In contrast with Bundy, Weaver continues doing his absolute best to help make me look good. If you recall, he stood out as the largest over-performer on his K% in the 2017 numbers. He struck out roughly 30% of batters last year, while his metrics pointed to just a 20% rate. This year his metrics are essentially unchanged from last year, and his K% has hovered right around 20. I almost feel a little bad that he’s struggled this year. For what it’s worth he’s probably been a little unlucky on his ERA, sporting a low LOB percentage. But now his FIP/xFIP/SIERA (3.4/4.5/4.5) are much more in line with the metrics than last year’s numbers were. I’m afraid this is mostly just the real Luke Weaver, folks.
Aaron Nola (SP, Philadelphia Phillies)
Nola had a slow start to the year that was somewhat masked by good fortune, previously receiving a C score in my first update. I wasn’t particularly worried about it, but still keeping an eye on him. He has thrown three excellent games since then, raising his score back to the B level in the process. His last start in particular was downright dominant, with the previously red-hot Giants only making contact on 53% of his pitches.
Again, trends in his pitch mix seem to be an important factor here explaining his success. In previous years, Nola’s curveball has always been his best pitch. But this year, his changeup is emerging as another real weapon, possibly even better than his curveball. In terms of the results so far at least, it is performing better (whiffs and wRC+ allowed). Here is a pretty straightforward chart showing how his changeup usage has increased substantially as the season progressed, and with it, good things have followed:

Corey Kluber (SP, Cleveland Indians)
April has been officially over for more than a week, and Kluber still has a bad grade, basically unchanged from the last update. His ERA is still great, thanks to some lucky BABIP and LOB numbers. His FIP on the other hand, is much uglier (3.9 vs 2.6). His metrics agree with the FIP, not the ERA. So, what gives? Well, as best I can tell, pitch mix might be a factor. Last year, Kluber threw a career high amount of sliders, around 27%, but this year he’s back in line with his career number closer to 20. He’s made up for those sliders with more cutters and sinkers. Those aren’t bad pitches by any means, just less good than the slider in terms of missing bats. The slider has a 20% whiff rate and an wRC+ allowed of -9 (yes that’s a negative number), so maybe he should go back to throwing it more. And yes, I realize I am starting to sound a bit like a broken record with the whole “throw more sliders” shtick. I can’t help if that’s what the data keeps telling me.
Luis Castillo (SP, Cincinnati Reds)
Castillo has been frustrating the hell out of his owners this year, but I’m here to tell you (again) that everything is going to be fine. After my previous update, he went out and threw a clunker, at which point would have been the perfect buy-low opportunity. After that, he has rebounded with two VERY solid efforts. In the process, he raised his season grade into the A+ range and is currently ranked sixth overall in MLB. With an ERA over six, he’s still an excellent buy-low opportunity IMO. He still shows a sizable discrepancy in his K% indicating many more strikeouts to come, and his BABIP and LOB rates suggest some bad luck there as well. My hope is that he becomes the opposite of Luke Weaver – a perfect example of my theory playing out…but in a more positive direction.
2. NEW GUYS
Caleb Smith (SP, Florida Marlins)
One question on people’s minds this early season has been: Is anyone in the Marlins rotation worth knowing about? And right now, it may seem that Caleb Smith is that guy. After seven starts, he’s sporting a solid ERA of 3.6. His FIP is 3.37, and xFIP/SIERA are in the same ballpark. So it’s easy to see why people are starting to talk about him. However, looking at the plate discipline metrics, he is showing the classic red flag just like Weaver last year. Much of the reason for his success so far is explained by his lofty K%, around 34 percent. However, both Contact% and SwStr% point towards a K% more in the 25% area. This is a classic demonstration of what it looks like when a pitcher is lucky on foul balls and umpires for a short time. But as we know, it’s unlikely to continue as the season goes on, and we should expect less strikeouts going forward.
That’s not to say Smith has zero value. 25% is not a bad strikeout rate at all for a good contact manager (not that I’m sure he is). For context, if you swap out his real strikeouts in the FIP equation, and replace them with his “predicted” strikeouts, his “Predicted FIP” rises to 4.0.
VERDICT = SELL
Trevor Cahill (SP, Oakland Athletics)
Cahill is a guy who I have been patiently waiting to come back after pitching excellently for the Padres for a short stretch early last year. He was traded mid-season to the Royals, and completely fell apart afterwards, so his excellence in the early season is completely hidden in his full-season stat line. As it turned out, he was actually pitching through shoulder injury. He finally made it back from the injuries in Mid-April this year, and has thrown four starts this year. These starts are certainly worth looking at. All four have been very solid, with three of the four being completely dominant, and the fourth team being the Astros. His K% currently sits around 34%, and the metrics fully support that excellent rate. So far this year, he has put up career highs in all of the important ones: Contact%, SwStr%, and O-Swing%. And they are not small incremental improvements either; his Contact% for example is 15 points under his career rate!
Cahill is a 30-year-old journeyman pitcher with 9 whole career WAR to his name, so I can’t blame anyone who might be a little hesitant to jump on the bandwagon. But for those skeptics, I would definitely recommend reading Nick’s piece on him: https://www.fangraphs.com/fantasy/pitcher-spotlight-trevor-cahill-is-doing-it-again/
VERDICT = BUY
Fernando Romero (SP, Minnesota Twins)
If you haven’t heard this name yet, it’s time to learn it. Romero is a 23-year-old rookie who has made two starts this year. Not a top prospect, he signed as an international amateur way back in 2011 and then was somewhat forgotten as he persevered through years of injuries and even TJ surgery. However he currently is healthy, and throws two mid-90s fastballs (sinker and four-seamer), plus a slider and changeup. After two starts, his ERA is zero, with 14 strikeouts and 6 walks in just 11 innings.
Romero currently sports a K% of 30, which I don’t need to tell you is excellent. With a contact% of 68, and SwStr% near 13, that strikeout rate is fairly in line with the metrics. No red flags here. Obviously his ERA of zero will rise at some point, but there’s no denying he has pitched extremely well in his two starts, against good teams (TOR & STL). There are plenty of things to like in his arsenal as well, as his sinker is sporting a 75% groundball rate, and both the slider and changeup are generating solid amounts of whiffs. On the flip side, of course there are a few reasons to hesitate. For starters, obviously the sample size is very small with just two starts. Also, he has not shown a great O-Swing% ability so far, so walks could continue to be a weakness. Lastly, he has never pitched more than 125 innings in a season, and so he could have his innings managed at some point. But right now he is looking like a must-add in 12-teamers.
VERDICT = BUY
Domingo German (SP, New York Yankees)
German started out the year as a strong contributor towards the Yankees best-in-MLB bullpen, grading out as a top-30 reliever in my article last week. But with the injury to Jordan Montgomery, he was given a chance to start this past Sunday. And what a start it was! He ended up pitching six innings without giving up a hit, striking out nine in the process. His fastball still sat at 95 in the sixth inning, a great sign for his stamina.
German actually has a fairly similar arsenal to Romero, with two types of fastballs in the mid-90s, a breaking ball (curve in his case) and changeup. However, he throws the fastballs far less often, just 37% compared to Romero’s more traditional 66%. This is likely a reflection of organizational philosophy – the Yankees throw the least fastballs in MLB by far (just 40%). It could be interesting to follow these two players progression as the season goes on.
On the plate discipline side, his metrics are also excellent across the board, both from that start, and including his complete body of relief work. Overall his K% is very much in line with expectations. German didn’t make the cut for the rankings because his innings are in relief, but he would have graded out as a 103 score (A+).
VERDICT = BUY
Walker Buehler (SP, Los Angeles Dodgers)
Here is a guy everyone is probably aware of. Buehler is a top prospect in a top system, so he’s typically very highly rated on prospect lists. Also, he can hit 100 MPH on his fastball, he plays for the large-market Dodgers, and has already contributed to a no-hitter this year. Accordingly, the hype train is very real. Luckily, I am here to damper expectations and pump the brakes a bit. Buehler was not supposed to be in the rotation this year, but the Dodgers hand was forced by multiple injuries. While the results have undoubtedly been great (ERA = 1.1, FIP = 2.1) the metrics simply don’t support this level of success. With a Contact% of 87, and a SwStr% of 7.3, we should expect a K% only around 13-15. Buehler currently sports a K% of 30, which is the largest discrepancy I’ve seen in a starter since I started doing this. Overall his grade is F and his score is among the worst 20 pitchers in MLB. Curiously, his vaunted 100 MPH fastball seems to be under-performing, with only a 5% whiff rate and 89% contact rate.
Don’t get me wrong, there are certainly things to like in Buehler; he does have a promising career ahead of him. It’s just that so far, his success is mostly attributed to managing the “quality-of-contact” side extremely well. Per various Statcast measurements, he’s definitely been elite at generating weak contact. But in the end, there is just such a huge difference between a 30% K guy and a 15% K guy, I cannot recommend buying at current prices. I would look to take advantage of the hype train, and cash out while his value is sky high (unless it’s a keeper league).
VERDICT = SELL
3. GAINERS AND LOSERS
Here are the top 10 pitchers who have improved their PD score over the last two weeks:
|
I’ll go into a bit more detail for players with a change of 10 percent or more.
Michael Fulmer (SP, Detroit Tigers)
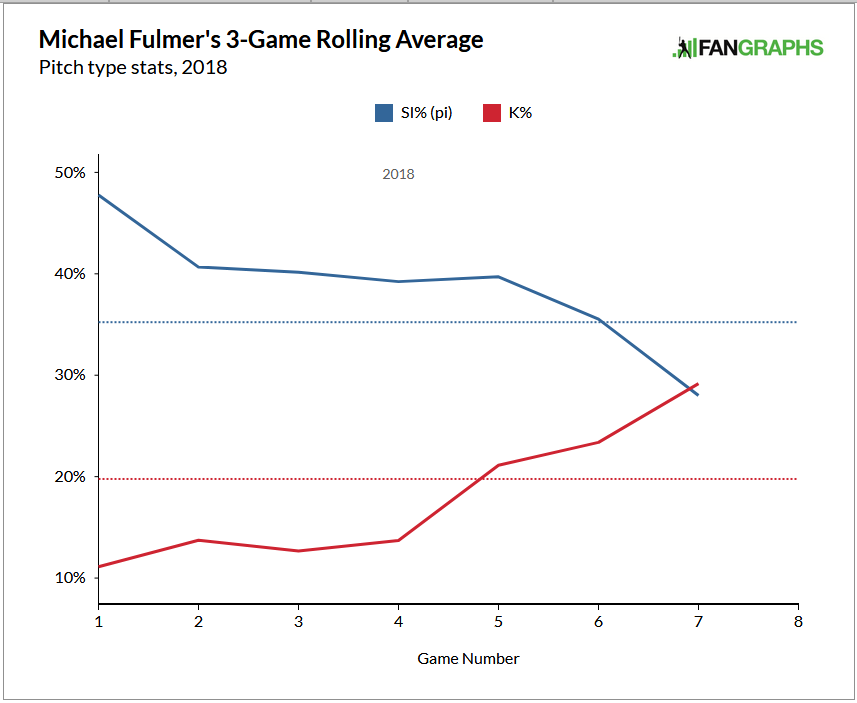
In my first update Fulmer received a D grade, so it’s nice to see him getting back up to where he belongs. Fulmer has never been a big strikeout guy, relying more on his sinker to generate groundballs consistently. For a pitcher like that, a B- grade is not bad at all. Fulmer looks to be back on track as an up & coming young hurler, showing incremental improvements in his metrics over his career numbers at this point in the season.
In looking at his pitch mix, it seems his success may actually be a result of throwing a bad pitch less often, rather than a good pitch more often. Something seems off with his sinker, his most-used pitch. This year it’s simply not getting great results – line drives up, groundballs down, and the wRC+ allowed is 170. As you can see below, Fulmer has cut way down on his sinker usage in his last two starts in favor of his various other pitches, of which he has four. All four of those pitches have double-digit whiff rates, so it’s not surprising to see less contact and more strikeouts when he throws them more. This could possibly be the start of something new – if he can’t find his sinker soon, he may be forced to adapt to be more of a strikeout pitcher. And he might just have the tools to pull it off.
Jon Gray (SP, Colorado Rockies)
Similar to Fulmer, Gray performed much worse than expected in my first ranking, and this is mostly just a matter of him getting back on track. A lot of the improvement was from just one dominant performance against the Padres, but that’s kinda how baseball works. Otherwise I don’t have an explanation other than random fluctuation. There doesn’t appear to be any meaningful change in his pitch mix or velocity. But Gray’s metrics right now would be best in his career, and like Fulmer, seems to be back on track after an April hiccup.
Lucas Giolito (SP, Chicago White Sox)
Improvements are great, but improving from an F to D doesn’t move the needle a whole lot. Like Gray, most of his improvement was also just from one very good start. Giolito had some hype this pre-season due to increased velocity in spring trailing, but then it didn’t materialize in the regular season. He’s been very disappointing overall, with an ERA over seven. He’s also walking more guys than he’s striking out. F-Strike% and O-Swing% are both down, supporting the rise in walk rate. However on a positive note, he should be striking out more guys going forward, with a sizable under-performance on his K% based on the metrics.
There are a couple things to watch in Giolito going forward. First, his velocity is trending upward, up about 2 MPH since opening day. If it keeps trending that direction, he would be a lot more intriguing. The other thing to watch for would be slider usage, of course. Giolito’s slider is his best pitch by the numbers, both this year and for his career. But he only throws it 15% of the time. Getting that number up could improve things in a hurry.
Jacob Faria (SP, Tampa Bay Rays)
Faria was also a disappointment this April, with a reduced K% and the problems that come with it. That drop in K% was fully backed up by his metrics, which have trended the wrong direction. They are still down noticeably from last year’s numbers, but at least they are improving. Like Giolito, Faria has been improving his velocity since the beginning of the season, and that would certainly be worth keeping an eye on.
Faria technically has four pitches: a fastball, changeup, slider, and curve. But really the curve is just a show-me pitch; he relies on the other three. Overall for his career so far, his changeup is his best strikeout pitch, but it’s not getting great results this year. Movement seems to be down and he’s getting less whiffs than last year. His slider is a good groundball pitch, but not a big bat-misser. This year, he has increased his changeup usage at the expense of slider, which would have been great if his changeup was the same as last year. The show-me curve, which he only throws 4% of the time, gets hammered. My hope going forward would be that he abandons the curve, and favors the slider a bit more over the changeup. Alternatively, he could figure out how to regain that movement on his change.
I have covered Nola already, and unfortunately I have to draw the line somewhere or I’ll just keep writing about every single pitcher. Drawing the line at 10% seems as good a place as any.
On the flip side, here are the pitchers who have dropped off in performance the most the past two weeks:
|
Jon Lester (SP, Chicago Cubs)
Lester looked fine in the previous update, with a B+ score. But then he had the largest dropoff of any pitcher since then, and now looks just average overall. I wouldn’t blame any owners who might be a little nervous; I certainly would be, despite his ERA of 2.8. He’s 34 years old, and putting up some of his worst K/BB rates of his career right now. Overall his metrics back up these trends, as they are the worst since his Boston days. The problem seems to be mainly with his four-seamer. It’s not getting the same movement this year as in the past, and is getting hammered pretty hard, to the tune of a 181 wRC+ allowed. That’s not good, considering it’s his most-used pitch. To pile on, his second-most-used pitch, his cutter, is also his second-worst-performing pitch. Combined, he’s throwing those two pitches about 70% of the time. That worked fine for him in the past, but don’t seem to be getting it done this year. He might want to consider mixing in a few more offspeed pitches going forward. He’s got a sinker, changeup, and curveball, all of which have solid results over his career when he feels like throwing them. I think he’s got the tools to adapt as he ages, if he chooses to use them.
Jake Arrieta (SP, Philadelphia Phillies)
Unlike Lester, Arrieta never looked fine to begin with, receiving a C grade in my first update. Now he has slipped down to a low D. Along with the metrics, his K% has nosedived in line, down to just 16%. This is clearly not the same pitcher who won the Cy Young a few years ago. The good news is that Arrieta never fully depended on strikeouts. Actually a C grade wasn’t even alarming, considering he’s long been a master of managing quality-of-contact, and owes much of his success to that side of the equation. He’s not letting up this year, putting up extremely low LD%, HardHit%, and BABIP so far. StatCast also still loves his work, so his ERA of just 3.1 is almost believable. The major red flag there would be his BABIP allowed of .228, which is 40 points under his career rate.
When Arrieta was at his peak from 2014-2016, he was able to combine that elite contact management skill with excellent strikeout/walk ratios. Since 2015, when his velocity peaked, it has been incremental declines across the board of PD metrics each year, and now we’re here. It’s very hard to see success anywhere near that level going forward with such a reduced strikeout rate. I will give Arrieta a lot of credit for adapting to his lower velocity though. The last couple years he’s perfected his sinker into a groundball machine, and started throwing it more, to the point where it’s now his bread & butter pitch at 65% usage. In a sense, his low grades are somewhat intentional on his part – he’s a man with a plan. It’s probably the best plan to prolong his career…but his days as a fantasy ace are behind him.
Joey Lucchesi (SP, San Diego Padres)
I probably should have covered Lucchesi in my first update. As a rookie with an A grade after five starts, he certainly would have been worthy of a deeper dive. But now the shine has worn off a bit, sliding down to a B-minus. This is the result of two bad starts, where his “big three” metrics (O-Swing%, Contact% and SwStr%) all fell off a cliff. But overall, his metrics still do support his K rate of 26.
Lucchesi’s Fangraphs page says he has four pitches – a fastball, changeup, curve and slider. But so far this year, he’s only a two-pitch guy, throwing the fastball and changeup. The fastball isn’t anything special velocity-wise at 91, but does have excellent movement in both planes, so overall it’s rated as a top-30 fastball in MLB. The changeup also seems good so far, with a 60% contact rate and 20% swinging strike rate. He’s thrown just ten curveballs (4%) and not a single slider. It’s rare for two-pitch starters to have a lot of success in MLB, especially rookies, so it’s not a surprise to see a dropoff in his rating as the league gets the scouting report. His changeup currently has a 46% K rate, four times higher than the fastball, indicating he greatly prefers to use the changeup as his putaway pitch. With only two pitches, that carries the danger of being predictable. Typically I consider two-pitch guys streamers, to be played carefully depending on matchups, and that seems about right here as well.
J.A. Happ (SP, Toronto Blue Jays)
Happ has seemingly done something very rare and special in baseball, transforming from a contact-manager into a high-strikeout pitcher at age 35. It’s usually the other way around. Nick has already covered this one in detail so I don’t need to get into the specifics, but I’ll just say that the metrics are mostly a believer. They do point towards a slightly lower K%, around 25 rather than 31, but that’s pretty much in the margin of error. It would still be a career best for Happ even if it does drop that far.
That being said, his last couple starts haven’t looked great in the metrics. One of the starts was actually pretty great though – his line against Texas was 7 IP, 2 ER, 0 BB, 9 K. He got it done with soft contact and a lot of good luck, with double the strikeouts predicted by the metrics in that game. But still, he’s just been a little lucky overall, and his K% this year is mostly a reflection of his skill.
4. RANKINGS
|
Loads of useful information. Many thanks.
Great write-up. Should I be concerned with Mikolas’ C+ score?
Thanks! I wouldn’t be particularly worried about Mikolas score per se. He’s been successful so far with his 20% K rate, which is in line with the metrics. He’s just not a big strikeout pitcher, and relies instead on weak contact and a minuscule walk rate. However, I do have some concerns in those areas. Checking Statcast, it seems he’s been a bit lucky on his contact so far, to the tune of about 50 points of wOBA. On the walk rate, it’s just so low it’s hard to believe he can keep it quite at that level. For reference, the lowest BB% last year of qualified pitchers was about 4% compared to Mikolas current 1%.
Long time King Felix fan, owner and yes, I’ve met him too. #125 for the King is unrosterable. Is it time to bite the bullet and send him on his merry way? Does the King have any redeeming qualities left? Pivetta, Mahle, VV are sitting on the WW wire at no cost.
yeah, I think I’d drop him for Pivetta at this point. It’s hard to see much success going forward. He’s trying to adapt to be more of a contact-manager, throwing his sinker a career high rate. But his sinker just isn’t great.