


Welcome folks to the Pitcher List staff leagues! This year Pitcher List added a huge amount of new staff members which allowed us to expand from three to a whopping six leagues! As a reminder, these leagues are standard 5×5 and are set up relegation style, which means if you finish in the top three, you move up; bottom three, you move down.
Legacy League
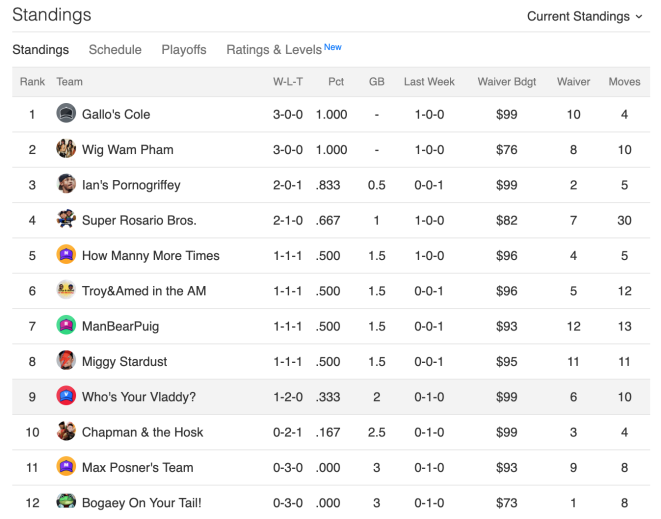
Best Performance: How Manny More Times (Nick Pollack)
Although there were matchups with a greater spread than Nick’s 7-3 victory over myself, Who’s Your Vladdy?, the stats tell a greater story. Nick’s pitching was flat out dominant, posting a 2.51 ERA and a 0.91 WHIP. In fact, Nick posted an ERA under 1.50 until Saturday. On top of that, his hitting was dominant up and down the lineup. Yes, Nick benefited from having Christian Yelich at the top of his game, and until Saturday, that was the entirety of his offense; however, the rest of his bats exploded after that, compiling a total of 15 HRs, 41 RBI, and 8 SBs. A begrudging tip of the cap to you, Nick.
Closest Matchup: Troy & Amed in the AM (Austin Bristow II) vs. Ian’s Pornogriffey (Ian Post)
This was the closest in terms of overall score (5-5), but there were also multiple close categories including HRs (11-13), wins (3-4), and saves (2-3) that all went in Ian’s favor. It’s a tough result for Austin, who dominated the categories he won, but couldn’t pull out the overall victory as Ian just edged out the tie. Ian gained the benefit of a late-week boost, netting 3 wins and 5 HRs over the last two days of the week.
Weird Stat: Over the last few years, I’ve posited a theory that you can draw a strong correlation between the number of transactions made and position in end of year standings. Through three weeks, the Legacy League is spitting in the face of this theory, as there are six teams with fewer than 10 transactions – three in the top five, and three that bring up the rear in the league. It is possible the theory merely works because teams that are more involved make more moves, but the Legacy League could indicate it’s the quality of the moves rather than the quantity that moves the needle. While we’re talking about league transactions, Jonathan Metzelaar is responsible for 27% of the transactions made by the entire league thus far.
-Dave Cherman
Prodigy League
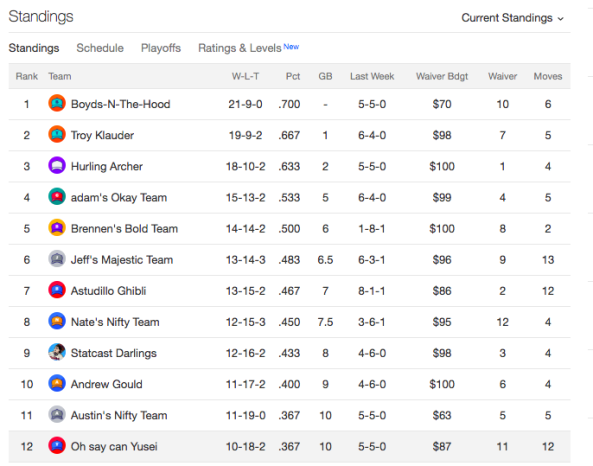
Best Performance: Astudillo Ghibli (Ben Pernick)
Ben’s team beat Brennan’s team in commanding fashion, going 8-1-1. His squad had over double the runs, triple the home runs and over double the RBI, while also earning more wins and a considerably better ERA. This is partly due to Brennan’s team falling apart, with only four home runs, 19 RBI and a .184 batting average, along with a 5.57 ERA. Yikes.
Closest Matchup: Austin’s Nifty Team (Austin) vs. Hurling Archer (Steve)
Austin and Steve were one of two 5-5 ties, although their matchup came right down to the wire. Austin took home runs and steals by one each, and his WHIP (1.15) just edged Steve’s (1.16). Meanwhile, Steve had a slight edge in batting average (.272 to .270). The other categories were all decided fairly handily, but a final day blow-up by Collin McHugh and Chris Archer cost Steve WHIP and sealed the tie.
Weirdest stat: Boydz-In-The-Hood (Brandon)
Brandon had a monstrous week on the hill, posting a 1.85 ERA and a 0.87 WHIP with six wins, four saves and 78 strikeouts in 58.1 innings pitched, nearly completing a clean sweep of the pitching categories against yours truly. His staff was anchored by two strong starts from James Paxton, as well as solid outings from Justin Verlander, Caleb Smith, Matthew Boyd, Masahiro Tanaka and Julio Urias. Not a fun week to face him, but an impressive performance nonetheless.
– Andy Patton
Futures League
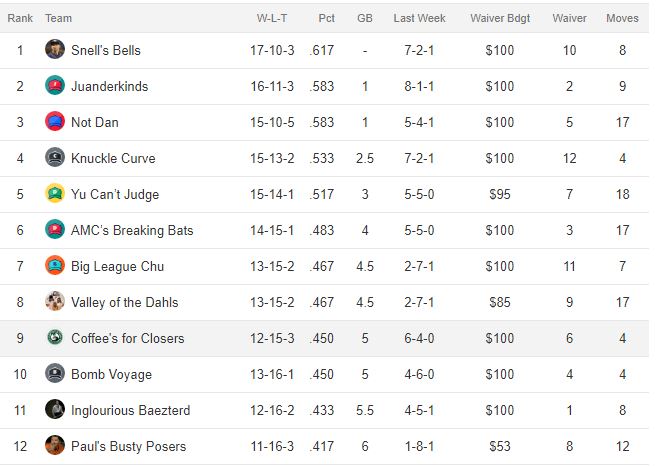
Best Performance: Dan Wist (Juanderkinds)
Dan’s team blew up! Six homers from Eddie Rosario and another four from Joey Gallo will do that for you. Those 10 dingers were enough to equal his opponent Paul Ghiglieri’s (Paul’s Busty Posers) whole team. When you combine that kind of power (18 total HR) plus 50 RBIs and a team .304 average with a sub-3.00 ERA and a 1.08 WHIP, Dan would have beaten anybody last week.
Closest Matchup: Not Dan (Dave Fishman) vs. Inglourious Baezterd (Rob Z)
Despite there being a 5-5 tie this week, Dave’s 5-4 win over Rob earns the closest matchup for Week 3. Three hitting categories could have gone either way, with Dan coming out the victor in RBI (25-23) and AVG (.237-.231) while tying HR (8-8). If that wasn’t close enough, Dan and Rob were just 0.1 away in ERA as well (2.92-2.82) with Rob taking the stat.
Weirdest team stat:In a fairly mild week for odd performances, Rob Z’s (Inglourious Baezterd) squad employed an old-school pitching approach to steal three categories. In an age where strikeouts are at their height, the Baezterd’s had a remarkably low K-rate of 6.45 (32 whiffs in 44.2 IP). Rob didn’t need to dominate Ks though to post impressive marks in ERA (2.82) and WHIP (1.01). He also had five saves, which did not garner high K-rates either. He has his low-key staff of Jake Arrieta, Miles Mikolas, Nate Eovaldi, Rick Porcello, Jake Junis and Chris Archer to thank for that.
Biggest Performance-Enhancing Wire Add: Kyle Freeland, picked up by Dan Richards (Yu Can’t Judge) at the beginning of Week 2. Dan spotted Freeland and started him April 18 in Colorado against the Phillies. Freeland posted a dominating 6.0 IP, 0ER, 0.33 WHIP, 7 K performance to get the win and help Dan score a tie with Dan McNamara (AMC’s Breaking Bats) by stealing WHIP 1.29-1.31.
– Travis Sherer
PL-League-1
– Ryan Fickes
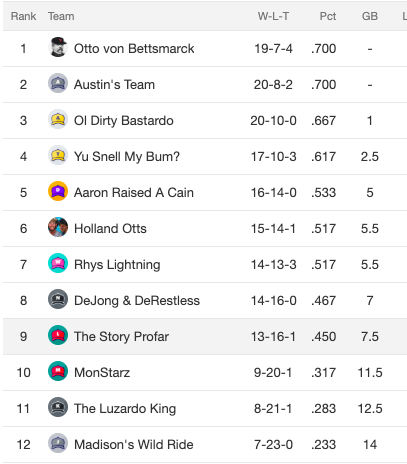
PL-League-2
Best performance: There were a number of strong performances in PL League 2 this week, but most were significantly one-sided. Holland Otts (Clay Cotton) may not have put out the best overall numbers, at least on offense, but his week was by far the most balanced between hitters and pitchers. Cotton’s hitters scored 40 runs and drove in 34 with a solid, if unspectacular, nine home runs. Four stolen bases and a .281 batting average rounded out an effective hitting performance, but Holland Otts really shined on the mound. In more than 61 innings, its pitchers earned seven wins, racking up 63 Ks and sparkled with a 2.04 ERA and 1.02 WHIP. For all his trouble, the performance resulted in just a 6-4 win.
Closest matchup: Rhys Lightning (John Wallace) and Austin’s Team (Austin Gretencord) each picked up four categories, leaving wins and saves tied at three and two, respectively. Not all of the individual categories were particularly close, but one stolen base, .007 batting average points and five strikeouts were the margins in those categories, making for a close overall matchup.
Weirdest stat: Aaron Raised a Cain (Daniel Port) and DeJong and DeRestless (Nathan Mills) nearly split offensive and pitching categories down the middle, save for one category on each side. Daniel’s team took every pitching category except for saves, where Nathan won 5-1, while Nathan won every offensive category besides stolen bases, where Daniel prevailed 6-2.
– Jordan Larimore
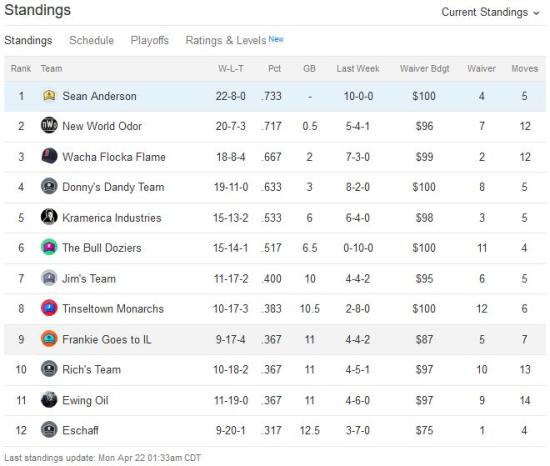
The Bottom of the Barrel
Best Performance: From a pure matchup standpoint, Sean Anderson beating Evan Rockow 10-0 takes the cake. The problem when you look at it from that standpoint is opponent performance needs to be taken into account and Evan had a terrible week across the board. Three batters were under the Mendoza line for Evan in Week 3, which is a good segue into the fact that batting average was the only category Evan had an average week in. Sean had the sixth-best performance overall, though he would have gone 4-1 in offensive categories against the entire league.
From an individual team performance viewpoint, Colin Ward continues his onslaught against the league, putting up 86 roto points (out of 120) for the week. At this point, Cody Bellinger and Tyler Glasnow are trending to be the MVP picks of the draft and Colin has been using them to make the rest of us feel silly.
Closest Matchup: David Fenko and Jim Chatterton fought their way to a 4-4 tie, tying in both HR (15) and W (4). The other categories have an interesting breakdown, as David won every rate category handily (AVG: .276 to .242, ERA: 2.56 to 3.27, and WHIP: 1.01 to 1.07), while Jim had a distinct advantage in the non-K counting stats (R: 49 to 35, RBI: 38 to 35, and SV: 6 to 3). Had David not sat Joey Gallo for several games earlier in the week, the tie might not have occurred, but bad decision-making shows up in the standings (as I am David, I have no concerns about calling myself out).
– David Fenko